HOW DO DIVIDEND ANNOUNCEMENTS AFFECT BONDHOLDER AND SHAREHOLDER WEALTH?
by
JASON L. TURKIELA
A DISSERTATION
Presented to the Department of Finance and the Graduate School of the University of Oregon
in partial fulfillment of the requirements for the degree of
Doctor of Philosophy September 2014
DISSERTATION APPROVAL PAGE Student: Jason L. Turkiela
Title: How Do Dividend Announcements Affect Bondholder and Shareholder Wealth? This dissertation has been accepted and approved in partial fulfillment of the
requirements for the Doctor of Philosophy degree in the Department of Finance by:
Ro Gutierrez Chair
John Chalmers Core Member
Zhi (Jay) Wang Core Member
Wesley Wilson Institutional Representative and
J. Andrew Berglund Dean of the Graduate School
Original approval signatures are on file with the University of Oregon Graduate School. Degree awarded September 2014
© 2014 Jason L. Turkiela
DISSERTATION ABSTRACT Jason L. Turkiela
Doctor of Philosophy Department of Finance September 2014
Title: How Do Dividend Announcements Affect Bondholder and Shareholder Wealth?
Dividend payments to shareholders can create conflicts between debt and equity investors as these payments can expropriate wealth from bondholders to shareholders. However, dividend payments can also serve as a signal regarding firms’ future earnings. Utilizing both improved bond event study techniques as well as a conditional event study model to control for self-selection and the presence of confounding earnings announcements, I find that, on net, dividend increases represent a transfer of wealth from debtholders to shareholders. Nevertheless, bondholders react more favorably to larger dividend changes consistent with the presence of a positive signaling effect. The conditional event study approach also provides the ability to test whether managerial hesitancy in cutting dividends may represent an additional source of expropriation. My results indicate that while bondholders are clearly harmed by these implicit dividend increases, evidence in support of shareholders’ gains is mixed.
CURRICULUM VITAE NAME OF AUTHOR: Jason L. Turkiela
GRADUATE AND UNDERGRADUATE SCHOOLS ATTENDED: University of Oregon, Eugene, OR
Central Michigan University, Mount Pleasant, MI Michigan State University, East Lansing, MI
DEGREES AWARDED:
Doctor of Philosophy, Finance, 2014, University of Oregon Master of Arts, Economics, 2008, Central Michigan University Bachelor of Arts, Economics, 2004, Michigan State University
AREAS OF SPECIAL INTEREST: Corporate Debt
Payout Policy
PROFESSIONAL EXPERIENCE:
Treasury Analyst, Cherokee Insurance Company, January 2005 – August 2007 Rates Analyst, Central Transport, Inc., November 2004 – January 2005
GRANTS, AWARDS, AND HONORS:
Graduate Teaching Fellowship, University of Oregon, 2009 - 2014 Doctoral Travel Grant, American Finance Association, 2013
ACKNOWLEDGMENTS
I would like to express my sincere gratitude to my dissertation committee, Ro Gutierrez (Chair), John Chalmers, Jay Wang, and Wes Wilson, for their guidance and feedback throughout this process. Special appreciation is given to Diane Del Guercio for the extensive amount of time and effort she provided to help improve previous versions of this study. Additionally, I am grateful to Julian Atannasov, Larry Dann, Pei-Hui Hsu, Hai Tran, and seminar participants at Washington State University for their helpful comments.
Most importantly, I would like to thank my parents, Gary Turkiela and Michelle Vasley, my siblings, Rachel and Michael Turkiela, my in-laws, David and Cathy Shield, and my wife and daughter, Christina and Evelyn Turkiela, for all of the sacrifices they have made to provide me this opportunity.
TABLE OF CONTENTS
Chapter Page
I. INTRODUCTION ... 1
II. DATA AND METHODOLOGY ... 12
Event Sample Construction... 12
Confounding Earnings Announcements ... 13
Event Study Methodology ... 17
The Choice of Event Window... 21
Conditional Event Study Regressions ... 22
III. TRADITIONAL EVENT STUDY RESULTS ... 31
Basic Event Study Results ... 31
Event Study Results Partitioned by Dividend and Earnings Announcement Choice ... 34
IV. CONDITIONAL EVENT STUDY RESULTS ... 39
Variable Selection for Ordered Probit Models ... 39
Financial Variables ... 39
Corporate Governance Variables ... 41
Managerial Compensation Variables ... 43
Signaling Variables ... 44
Other Variables ... 45
Summary Statistics... 46
Ordered Probit Results ... 48
Chapter Page
Robustness Checks... 52
V. PASSIVE EXPROPRIATION ... 56
Detecting Passive Expropriation ... 56
Passive Expropriation Results... 58
VI. CONCLUSION... 64
APPENDICES A. SIZE TESTS ... 67
B. DIVIDEND INITIATIONS AND OMISSIONS ... 70
C. VARIABLE DEFINITIONS ... 73
LIST OF FIGURES
Figure Page
1. Proportion of Firms that Jointly Announce Both Dividends and Earnings in
Dividend Event Time ... 15 2. Average and Median Dollar Volume During Dividend Event Time. ... 23
LIST OF TABLES
Table Page
1. Dividend Event Summary Statistics ... 14
2. Stability of Joint Dividend and Earnings Announcements Decisions Over Time ... 17
3. Event Study Results by Type of Dividend Announcement ... 32
4. Stock Event Study Results by Dividend and Earnings Announcement Choice .... 37
5. Bond Event Study Results by Dividend and Earnings Announcement Choice ... 38
6. Firm-level Summary Statistics ... 47
7. Ordered Probit Selection Models ... 50
8. Cross-sectional Abnormal Return Regressions ... 53
9. Passive Expropriation Event Study Results ... 60
10. Passive Expropriation Regression Results ... 62
11. Summary Statistics and Size Properties for Cumulative Abnormal Bond Returns ... 68
12. Dividend Initiations and Omissions ... 71
CHAPTER I
INTRODUCTION
Bonds and equity possess option-like payoffs such that shareholders generally wish to increase the risk of the firm whereas bondholders prefer to minimize downside risk (Mer-ton, 1974). Given the differing nature of these securities, debtholders and shareholders can come into conflict with one another regarding the optimal management of a leveraged firm. Commonly mentioned examples of this behavior include the asset substitution prob-lem raised by Jensen and Meckling (1976) and the debt overhang issue explored by Myers (1977). A third example, and the focus of this study, is the transfer of wealth from bond-holders to sharebond-holders through dividend payments.
Dividends can potentially transfer wealth from bondholders to shareholders by increas-ing the default risk of the outstandincreas-ing debt (Galai and Masulis, 1976). As noted by Lease, John, Kalay, Loewenstein, and Sarig (2000), by paying dividends, stockholders appropri-ate assets (i.e. cash) shared by all securityholders to their exclusive control. This harms debtholders as it not only increases the likelihood of default, but also lowers the amount of assets that can be used for repayment should forfeiture occur. As bondholders are not compensated for the increased riskiness of their claims, they lose wealth when dividends are paid, while shareholders ultimately gain.
However, it is not necessarily the case that dividend payments should be interpreted negatively by bondholders. The information content of dividends hypothesis (e.g. Bhat-tacharya, 1979; John and Williams, 1985; Miller and Rock, 1985) posits that, in the pres-ence of asymmetric information, managers can use dividend increases as a credible mecha-nism to communicate to external investors that earnings will be higher in the future. There-fore, a positive change in dividends paid may indicate an increase in the likelihood of repayment. While the empirical evidence in favor of the information content of dividends hypothesis has been mixed (see Kalay and Lemmon, 2007, for an overview), recent work
by Grullon, Michaely, and Swaminathan (2002), DeAngelo, DeAngelo, and Stulz (2006), and Denis and Osobov (2008) has found support for the life-cycle hypothesis of dividends. The life-cycle hypothesis suggests that as companies mature, their ability to generate stable cash flows outpaces the number of profitable investment opportunities available to them. Consequently, they disburse their free cash flows as dividends. Thus, regardless of whether dividend increases signal the rise of earnings growth or stability of firms’ future permanent income, dividend announcements have the potential to be positive news for bondholders.
To date, previous work has reached differing conclusions on how bondholders view dividend announcements. For example, Woolridge (1983) and Handjinicolaou and Kalay (1984) execute event studies and find that bondholders experience positive, albeit statis-tically insignificant, abnormal returns from the announcement of dividend increases, but respond in a negative and statistically significant fashion to dividend decreases. As these studies find that abnormal bond returns move in the same direction as abnormal stock re-turns, their results are consistent with the signaling hypothesis. However, in line with the wealth transfer hypothesis and contrary to theoretical models which suggest that larger div-idend changes should send more credible signals to market participants, Dhillon and John-son (1994) find that the bond market reacts negatively to dividend initiations and increases greater than 30% in magnitude and positively to dividend omissions and decreases.
Aside from the ambiguity surrounding the conclusions reached in prior studies, the abil-ity to generalize the results from the extant literature is further complicated by two factors. First, a number of substantial changes have taken place in both payout policy and corporate governance since the 1970’s, the sample period examined by previous work. As bondhold-ers’ responses to dividend announcements are likely to depend on these conditions, a rein-vestigation of how debtholders respond to these events seems warranted. This is especially pressing given that many of these changes may adversely affect bondholders. For instance, Fama and French (2001) find that while there are now fewer firms paying dividends, the real amount of aggregate dividends has steadily increased over time. Moreover, as noted
by DeAngelo, DeAngelo, and Skinner (2004), dividend payment has become increasingly concentrated in large, mature industrial firms where asymmetric information should not be a pressing concern. From the perspective of bondholders, these developments may prove worrisome as they indicate that while the need to use dividends as a signaling device has lessened, firms are nevertheless paying out dividends at higher levels. Moreover, Skinner (2008) shows that share repurchases have recently become the predominant method of cor-porate payout, with only a few firms now paying dividends exclusively. Thus, given that shareholders are already distributing cash to themselves in the form of share repurchases and repurchases offer distinct advantages relative to dividends (e.g. greater flexibility, tax treatment), the announcement of a dividend increase may be viewed by debtholders as simply an additional wealth grab by equityholders.
Signaling is not the only motivation that the payout literature has proposed for issuing dividends. Indeed, a large literature has emerged which suggests that dividend payments are an effective means of reducing the agency problems associated with free cash flow (e.g. Easterbrook, 1984). However, it is not immediately obvious that corporate governance mechanisms that have developed to protect shareholders’ interests necessarily safeguard bondholders. For example, recent work (e.g. Klock, Mansi, and Maxwell, 2005; Chava, Kumar, and Warga, 2010) has shown that debtholders prefer firms with higher levels of managerial entrenchment, as it insulates them from costly anti-takeover measures1 and re-sults in the use of less leverage (Garvey and Hanka, 1999). Directly related to dividend policy, Francis, Hasan, John, and Song (2011) use the changes in state-level anti-takeover laws as a quasi-natural experiment to show that increases to managerial entrenchment led to lower dividend payout levels. This suggests that another reason bondholders may favor entrenched management is their lower propensity to pay out.2 Consequently, the general
1See Dann and DeAngelo (1988), Denis (1990), Heron and Lie (2006) and Billett and Xue (2007) for evidence of payouts as a takeover defense mechanism. Also, see Warga and Welch (1993) and Billett, King, and Mauer (2004) for evidence of bondholder losses following successful takeover bids.
2It is worth noting that Hu and Kumar (2004) find that more entrenched managers are more likely to pay out and have higher payout levels. The authors attribute this to entrenched managers preempting any type
decrease in managerial entrenchment over time may alter how bondholders perceive divi-dend payments.
Other areas of corporate governance have also undergone substantial changes over time, such as the increased presence of institutional investors and modifications to how managerial compensation is awarded. As Aghion, Van Reenen, and Zingales (2013) note, in 1970 institutions only owned 10% of publicly-traded equity, but by 2006, they owned nearly 60%. Since recent work has shown that concentrated institutional ownership can adversely affect bondholders (Bhojraj and Sengupta, 2003) and can shape payout policy (Desai and Jin, 2011; Crane, Michenaud, and Weston, 2012; Gaspar, Massa, Matos, Pat-giri, and Rehman, 2013), exploring how their increased presence has affected debtholders through dividend policy seems worthwhile. Likewise, executive compensation may affect how debtholders view dividend payments. Relative to the 1970’s, there has been sizable growth in the use of equity-based compensation over time (Frydman and Saks, 2010). The impetus behind this shift is that equity-based compensation is thought to better align man-agers’ and shareholders’ interests. However, doing so comes with the potential problem of exacerbating the agency costs of debt (John and John, 1993).3 As executive compensation packages are multifaceted, it is not easy to succinctly state how these changes may affect bondholders’ perceptions of dividend payments. Even so, given its potential to change managers’ incentives, an investigation seems prudent.
The second reason that it is difficult to extrapolate the results of previous studies to bondholders today is that prior work was based on small, hand-collected samples of bond prices from the mid-1970’s. Additionally, as noted by Bessembinder, Kahle, Maxwell, and Xu (2009), these studies often focused on a “representative bond” method where only one
of disciplinary takeover. However, Hu and Kumar do not attempt to control for the possible endogeneity between the dividend payout decision and the level of entrenchment.
3Consistent with this idea, Brockman, Martin, and Unlu (2010) note that credit rating agencies often consider executive compensation in making their credit assessments as it directly affects managers incentives in setting firm policy, while Kuang and Qin (2013) actually show that increases in equity-based compensation lead to credit rating downgrades. Finally, Billett, Mauer, and Zhang (2010) show that announcements of equity-based compensation tend to be good news for shareholders and negative news for bondholders.
bond per firm was selected for analysis. This approach was obviously understandable given the difficulty in obtaining reliable daily bond prices at the time. Nonetheless, it clearly has the potential to misrepresent the true wealth effect generated from a dividend announce-ments since companies, such as the large, mature types of firms that populate the universe of dividend payers, often have multiple debt issues outstanding. However, the recent avail-ability of transaction-level bond price data through the Trade Reporting and Compliance Engine (TRACE) coupled with the newly developed bond event study methodology spear-headed by Bessembinder et al. (2009) should provide a more comprehensive assessment of the wealth effects caused by dividend announcements.
Given the aforementioned issues, the goal of this study is to reassess how dividend an-nouncements affect bondholders’ wealth using data from the TRACE database from 2002 to 2012. In order to accomplish this task, I will first focus on performing an event study to establish whether the wealth transfer or signaling effect dominates on net. While this approach is how previous studies have typically proceeded, it does not provide a complete picture of the potential wealth effects caused by dividend announcements. For example, categorizing abnormal returns into bins based on dividend announcement type ignores the cross-sectional variation in the abnormal returns due to factors such as the magnitude of the announced dividend change. This point is particularly germane as previous authors have noted that the wealth transfer and signaling hypotheses are not mutually exclusive; it is possible for both effects to simultaneously exist. Thus, finding that abnormal bond returns earned at dividend increases are negative on average does not preclude the possibility that dividends do not also serve a signaling function and vice versa. Therefore, it seems rea-sonable to conduct a regression-based analysis to further examine any conclusions reached from the event study results.
The use of a regression-based analysis is also beneficial in the context of the cur-rent study as there are two pertinent issues that traditional event study techniques are ill-equipped to handle. The first concern is that the decision of the firm’s management to
modify its dividend payout is not a random outcome; rather, it is one that managers pur-posefully self-select.4 For example, the results of Brav, Graham, Harvey, and Michaely (2005) indicate that over two-thirds of the Chief Financial Officers surveyed indicated that a careful consideration of the permanence of future earnings was critical in making a div-idend payout decision. The self-selection issue has direct consequences for the abnormal returns earned by securityholders at dividend announcements. If the event is largely antic-ipated by securityholders, the announcement period abnormal returns will be muted since the value-relevant information from the event will have largely been priced into the secu-rity. However, if the actual announcement differs from the market’s expectation, then larger abnormal returns will be experienced. Thus, predicting the market’s expectations regard-ing the likelihood of a dividend change based on observables related to the firm’s financial condition, governance mechanisms, and financial contracting (i.e. the presence of restric-tive dividend covenants) environment is crucial in properly understanding how dividend announcements affect the wealth of bondholders and shareholders.
Secondly, as has been recognized since at least Aharony and Swary (1980), dividend news is often released near quarterly earnings announcements. As prior research (e.g. Eas-ton, Monahan, and Vasvari, 2009) has shown that the corporate debt market responds to earnings announcements, the presence of these secondary announcements raises the con-cern about confounding information invalidating the event study results. While the cus-tomary advice would be to drop the dividend announcements with corresponding earnings announcements nearby, this is problematic for two reasons. First, as dividends and current earnings are thought to provide a signal regarding the firm’s future earnings, the fact that managers choose to pair both types of information does not seem coincidental. Previous work has demonstrated that dividend and earnings announcements have a corroborative re-lationship. For example, both Ofer and Siegel (1987) and Ely and Mande (1996) find that analysts use information from dividend announcements to update their predictions of
ture earnings while Kane, Lee, and Marcus (1984) find direct evidence of a joint signaling effect in abnormal stock returns and Datta and Dhillon (1993) find a similar effect in the bond market. These results, coupled with the fact that managers often strategically time both earnings (e.g. Penman, 1984) and dividend announcements (Kalay and Loewenstein, 1986), suggests that the joint announcement decision should be controlled for rather than ignored. Second, as noted by Nayak and Prabhala (2001), the elimination of confounding observations may not eliminate bias from the sample. Specifically, if the market expects a joint announcement to occur, then its absence (i.e. a “non-event”) may cause a price reaction. Thus, the seemingly “clean” sample may contain multiple instances of these non-events and be biased itself. This point is particularly relevant given that Venkatesh and Chiang (1986) find an increase in asymmetric information following the absence of an an-ticipated joint dividend and earnings announcement suggesting that investors respond to so-called non-events.
The use of a self-selection model also allows me to explore a form of wealth trans-fer that has been suggested in the literature, but never explicitly tested. Specifically, as discussed by Allen and Michaely (2003), the idea that managers will attempt to system-atically expropriate bondholders by paying shareholders excessively high dividends seems somewhat implausible given reputational costs and the possibility of having to return to the corporate debt market sometime in the future (e.g. John and Nachman, 1985). However, Allen and Michaely suggest that a form ofpassive expropriationmay be possible.
Given the well-documented reluctance of managers to cut dividend payments, man-agerial inaction in cutting an unsustainable dividend may create a transfer of wealth from bondholders to shareholders. If capital market participants are anticipating that a firm will cut its dividend, the failure to do so will result in animplicitdividend increase. Hence, it is a non-event that the market reacts to rather than an explicit action on the part of managers. Both survey (Brav, Graham, Harvey, and Michaely, 2005) and empirical (Daniel, Denis, and Naveen, 2010) evidence suggests that managers may take actions to maintain dividend
payments that are detrimental to bondholders, such as taking on additional debt or cutting investment expenditures. Traditional event study techniques would not be equipped to deal with measuring such non-events. However, given that the conditional event study method-ology employed in this study measures the difference between the announcement the firm chooses and what the market was anticipating, measuring these types of passive actions is fairly straightforward.
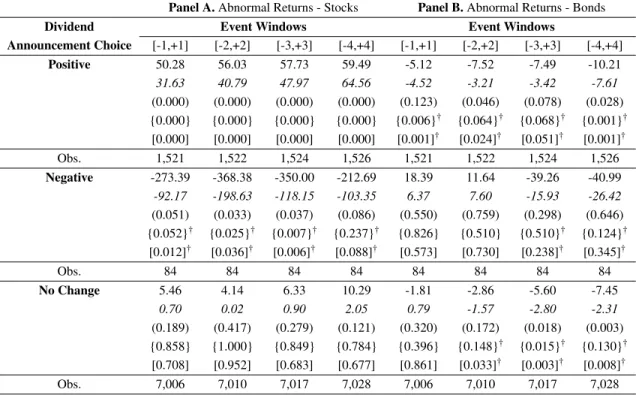
Overall, the results from my event study tests demonstrate that dividend increases rep-resent a transfer of wealth from bondholders to shareholders. For example, at the [-2,+2] event window, debtholders lose -7.52 basis points (bps) on average, while shareholders gain 56.03 bps. While a loss of -7.52 bps may seem modest, as the average market value of debt for firms in my sample is $8.44 billion, the typical loss of bondholders’ wealth at these announcements is approximately $6.34 million. Thus, while dividend increases do not represent pure wealth transfers, as shareholders gains outstrip bondholders’ losses, at least some portion of the value earned by shareholders appears to be expropriated from debthold-ers. The event study results from the announcement of a dividend cut yield inconclusive results. In smaller event windows (e.g [-1,+1]), dividend cuts appear to be reverse wealth transfers with bondholders earning positive, albeit statistically insignificant, abnormal re-turns while shareholders clearly lose. Yet, in longer windows (e.g. [-3,+3]), bondholders appear to lose wealth as well, although the results are again statistically insignificant. How-ever, additional evidence from dividend omissions seems to hint at dividend reductions as being negative signals. As my results indicate that dividend increases are wealth transfers on net and dividend decreases show no consistent evidence of being negative signals for bondholders, my findings appear to contradict the conclusions reached by Handjinicolaou and Kalay (1984).
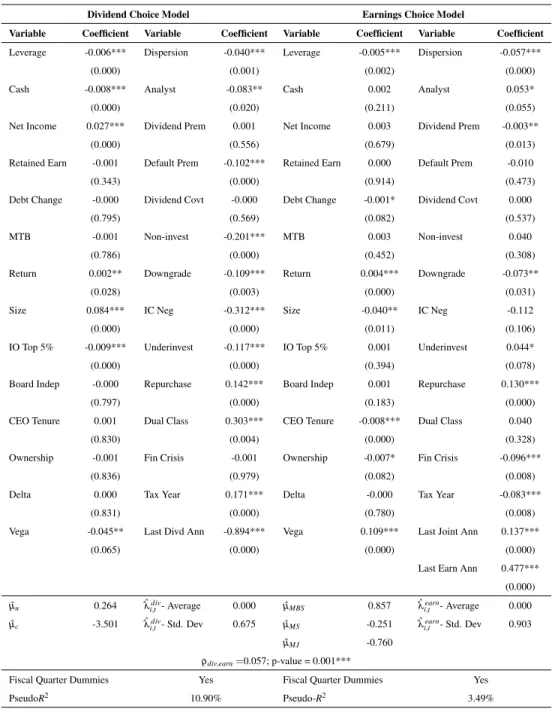
I next estimate a conditional event study model similar to the one designed by Nayak and Prabhala (2001) to handle managers’ self-selection into particular dividend and earn-ings announcement decisions. The results from the conditional event study support the
findings from the traditional event study. Specifically, the conditional model finds that un-expected dividend increases cause bondholders to lose wealth while simultaneously ben-efiting shareholders. However, the conditional event study regressions also demonstrate that both investors’ abnormal returns are increasing in the size of the announced dividend change. Thus, my results indicate that larger dividend increases are responded to more positively than smaller dividend increases and larger dividend cuts yield more negative ab-normal returns than smaller dividend decreases. Taken together, these results suggest that while dividend increases are wealth transfers on average, the transfer of wealth is partially mitigated by the signaling effect. These findings are consistent with theoretical signaling models (e.g. Miller and Rock, 1985) which posit that the strength of the signal released at a dividend announcement is a function of the dividend change. This result is also note-worthy since it differs from prior studies examining bondholders’ reactions to alternative payout mechanisms, such as share repurchases (Maxwell and Stephens, 2003) and spin-offs (Maxwell and Rao, 2003). Similar to dividend payments, these alternative payout schemes are thought to possibly contain both signaling and wealth transfer effects. However, these studies demonstrate that these events represent a transfer of wealth on average and that bondholders’ losses grow as the size of the payout increases. Thus, it seems that the im-plicit costliness of maintaining a quarterly dividend payment makes dividend policy a more credible signaling mechanism to bondholders relative to more transitory payout schemes.
To examine the passive expropriation hypothesis, I focus on the subsample of dividend announcements that feature no change in the dividend payout. As passive expropriation is caused by managerial inertia in cutting dividends, it should be present during announce-ments where the firm states that it will not modify its established dividend level, despite the fact that the market predicts that it will lower it. As the conditional event study approach produces a measure of the market’s surprise relative to the actual dividend announcement, it is possible to use this measure to test of passive expropriation. Consistent with passive expropriation, I find that bondholders in firms that surprisingly declare that their dividend
level will not change when a dividend cut is anticipated earn lower abnormal returns (-7.36 bps) over the [-2,+2] event window than other bondholders (-1.67 bps). However, while shareholders of firms that maintain their payout level when a cut is expected earn higher abnormal returns (17.11 bps) compared to shareholders (0.69 bps) in firms that are not expected to lower their dividend payment, the results are weak in terms of statistical significance. To place the results for the bond market in context, note that the wealth loss generated by the implicit dividend increase caused by passive expropriation is only slightly less than the magnitude of the wealth loss experienced at an actual dividend increase an-nouncements (i.e. -7.52 bps). Further testing finds that the use of debt to maintain an oth-erwise unsustainable dividend level exacerbates bondholders’ losses while simultaneously augmenting shareholders’ gains, suggesting that it may be one mechanism through which passive expropriation reliably occurs. Therefore, passive expropriation appears to be a real phenomenon that adversely affects bondholders while concurrently benefiting shareholders under certain circumstances.
My study contributes to three different literatures. First, it adds to the extant work on dividend policy in general. While a substantial amount of attention has been dedi-cated to how dividend policy affects shareholders, there is a relative dearth of evidence on how dividend policy affects debtholders’ wealth. This is especially concerning given the wide-spread changes that have occurred since prior studies were completed. Therefore, the current study aims to provide an updated, comprehensive account of how bondholders react to dividend announcements in order to remedy this gap. Second, my study aug-ments the corporate governance literature, and more specifically, the literature pertaining to shareholder-bondholder conflicts. To date, this area has largely focused on risk-shifting (i.e. investment policy) concerns, however my study is one of a select few to extend this analysis to payout policy. Furthermore, my study is novel given that it is the first to test for wealth transfers arising from managerial inertia in cutting or suspending dividends. The third area that my study supplements is the use of conditional event study techniques. To
my knowledge, this is the first study to apply the conditional event study framework to a bond event study. While the conditional event study procedure seems to largely verify the conclusions reached through the traditional event study approach, it nevertheless high-lights the usefulness of conditional models in testing for the presence of value-relevant “non-events”.
The remainder of this paper is structured as follows: In Chapter II, I outline how the event sample is formed, discuss the methodology used for the event studies in both the bond and stock markets, and introduce the conditional event study regression framework. In Chapter III, I present the event study results. In Chapter IV, I discuss the findings from the conditional event study. Chapter V investigates the passive expropriation hypothesis and Chapter VI concludes.
CHAPTER II
DATA AND METHODOLOGY
In the first section, I discuss how the event sample is formed and highlight the preva-lence of joint dividend and quarterly earnings announcements within the sample. In the second section, I provide an overview of how the event studies for both the bond and stock markets are executed. In the third section, I introduce the conditional event study model I will employ to deal with managers’ non-random choice of dividend (i.e. whether to in-crease, dein-crease, or leave the dividend payout level unchanged) and earnings announcement (i.e. whether to announce earnings joint with dividends or not) type.
Event Sample Construction
The sample of dividend announcing firms comes from the Center for Research in Se-curity Prices (CRSP) events file. To be included in the sample, a firm must possess a share code of either 10 or 11 (i.e. the firm must be incorporated in the United States and can-not be either a real estate investment trust or closed-end fund) and announce the payment of an ordinary cash dividend at a quarterly frequency (i.e. CRSP distribution code 1232). To match the coverage of the daily bond return data discussed below, the sample period spans from the start of July 2002 to the end of December 2012. Additionally, I require that there be at least 30 calender days and no more than 184 calendar days between subsequent quarterly dividend announcements.5
Besides providing announcement dates, the CRSP events file also supplies the an-nounced dividend amount. I modify the reported dividend amount to account for non-cash distributions such as stock splits and spin-offs and use the adjusted dividend amount (Divad ji,t ) to determine the percentage change in dividends paid (∆Divi,t) as:
5I select a maximum of 184 days as it is the maximum number of days that can pass between the beginning of one quarter to the end of the following quarter.
∆Divi,t =
Divad ji,t −Divad ji,t−1 Divad ji,t−1
!
∗100 (1)
As shown in Panel A of Table 1, the sample is comprised of 8,611 dividend announce-ments made by 503 different firms. Breaking down the announceannounce-ments by the direction of dividend change, it is obvious that the overwhelming majority of observations (7,006) fea-ture no change in the dividend payout level whatsoever, which is consistent with the notion that managers are generally adverse to modifying dividend policy unless material shifts in the firm’s permanent income have occurred. Conditional on a positive change occurring (1,521 observations), the average increase in the quarterly dividend is 31.31% on average with a median change of 10.84%. Confirming prior findings of managerial reluctance to cut dividends, there are only 84 dividend decreases in the sample; however, despite their relative scarcity, the average reduction of -57.78% (median cut = -50.00%) is substantial in magnitude.
Confounding Earnings Announcements
As earlier studies (e.g. Aharony and Swary, 1980) have indicated, one of the most pervasive facts regarding dividend announcements is that they are often coupled near quar-terly earnings announcements. As shown in Figure 1, this holds true in my sample as well since nearly 12% of firms appear to release dividend and earnings announcements on the exact same day. Extending this further, within the [-4,+4] dividend announcement event window, approximately 38% of sample firms have chosen to make a quarterly earnings announcement and in the [-7,+7] event window, around 48% of firms have made a joint announcement in quartert.
Table 1: Dividend Event Summary Statistics. Summary statistics for the intersection of firms covered by both the CRSP and TRACE databases are presented above. In Panel C, the bond ratings on the left-hand side are from Moody’s while the those on the right-hand side are from either Standard and Poor’s or Fitch. The bond classifications in Panel C include any subranking included within the category (e.g. the Aa/AA group includes bonds rated by Moody’s as Aa1, Aa2, Aa3 and bonds rated by Standard and Poor’s or Fitch as AA+, AA, or AA-).
Panel A.Dividend Summary Statistics
Event Observations Mean Percentage Change Median Percentage Change
Positive Change 1,521 31.31% 10.84%
Negative Change 84 -54.53% -50.00%
No Change 7,006 0.00% 0.00%
8,611
Number of Firms 503
Panel B.Dividend Events by Year
Year Positive Change Negative Change No Change
2002 7 1 74 2003 53 2 344 2004 104 1 475 2005 168 7 736 2006 176 1 720 2007 157 3 696 2008 144 12 707 2009 110 27 806 2010 180 6 835 2011 211 9 845 2012 211 10 774 1,521 84 7,066
Panel C.Dividend Events by Bond Rating
Bond Rating Positive Change Negative Change No Change
Aaa/AAA 29 0 92 Aa/AA 64 1 220 A/A 511 7 1,888 Baa/BBB 644 39 2,918 Ba/BB 184 24 1,141 B/B and below 89 13 747 1,521 84 7,066
Figure 1: Proportion of Firm that Jointly Announce Both Dividends and Earnings in
Dividend Event Time. Event date zero is the announcement of a quarterly dividend. The
height of the boxes indicate the proportion of firms with an earnings announcement on the given event date.
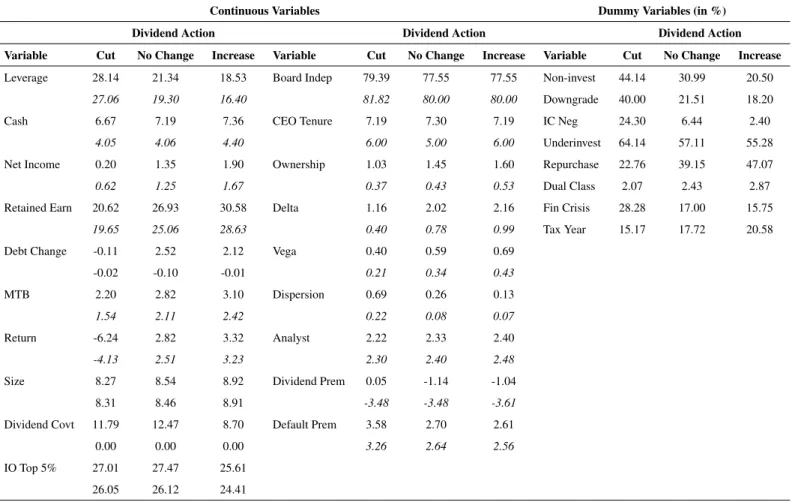
Given the proximity of these events, executing an event study on dividend announce-ments becomes more difficult as the reaction to the earnings announceannounce-ments obscures the amount of change in market value that occurs due to the dividend announcement. Tradi-tionally, the method to deal with confounding events would be to eliminate announcements contaminated by the secondary announcement from the sample. However, this method has three disadvantages. First, as discussed by Kane et al. (1984), dividends and earnings only provide crude signals about the firm’s future earnings. One manner for managers to improve the quality of the signal they transmit is to strategically choose to release the information together. This way investors have the opportunity to immediately determine whether the individual signals corroborate or conflict one another. Consistent with this idea, Kane et al. (1984) and Datta and Dhillon (1993) find evidence of a corroborative ef-fect (e.g. positive (negative) dividend and earnings information released together generates higher (lower) returns than either event announced separately) in the stock and bond
mar-kets respectively. The interplay between these two signaling mechanisms is important to consider in the current study since certain signaling outcomes will affect bondholders and shareholders differently. For example, the announcement of a dividend increase coupled with the firm missing analysts’ expectations may be the type of scenario where a wealth transfer is most likely to occur. Therefore, it seems beneficial to control for the joint earn-ings decision rather than simply discarding these observations.
One possible objection that could be raised is that the decision to joint announce earn-ings and dividend information is not a choice that managers make for signaling purposes, rather it is one that firms simply perform quarter after quarter. To provide some initial evidence that the joint announcement decision acts as an additional signaling mechanism, in Table 2, I determine the proportion of sample firms that choose to jointly announce dividend and earnings together in quarter t and then subsequently choose to make joint announcements in the following quarters. As can be seen, while there does appear to be a non-trivial number of firms that consistently make joint announcements (about 15% of firms jointly announce in quarters t, t+1, t+2, t+3, and t+4), there is also a substantial reduction as each quarter progresses, suggesting that managers do select in and out of the joint announcement decision.
The second reason for keeping these observations comes from Nayak and Prabhala (2001). As the authors point out, expunging confounding observations from an event study may not cure the problem of bias; but rather, only serve to introduce a new type into the sample. Namely, as market participants are likely to create expectations about joint announcements occurring, thenon-occurrenceof a predicted event can actually cause in-vestors to react. The findings of Venkatesh and Chiang (1986) confirm this fact for dividend and earnings announcements as the authors find that asymmetric information increases fol-lowing expected joint announcements that do not occur. As traditional event study methods are not equipped to determine if a particular event was expected to happen, non-events can consequently contaminate a supposedly clean sample. Therefore, they recommend the use
Table 2: Stability of Joint Dividend and Earnings Announcements Decisions Over
Time. The table below lists the proportion of sample firms which choose to jointly
an-nounce both dividend and earnings information during the [-7,+7] interval in dividend event time across consecutive quarters.
Joint Announcement Joint Announcement Joint Announcement Joint Announcement Joint Announcement int,t-1,t-2,t-3,
in quartert intandt-1 int,t-1, andt-2 int,t-1,t-2, andt-3 andt-4
47.68% 29.89% 22.04% 17.43% 15.40%
of conditional event study methods for dealing with the issue of joint announcements. Fol-lowing their suggestion, I employ a conditional event study approach in this study which is described in more detail in a subsequent section.
Event Study Methodology
The daily stock return data necessary for the event study come from the CRSP daily returns file. Abnormal stock returns (ARstocki,t ) are calculated as:
ARstocki,t =rstocki,t −βˆirvw,t (2)
where rstocki,t is the daily return for firm i on day t, βˆi is firm i’s estimated beta, and rvw,t
is the daily return of the CRSP value-weighted market index. As noted by Kothari and Warner (2007), the choice of benchmark has little effect on the results of short-run event studies, therefore the abnormal returns calculated in excess of the market model (Brown and Warner, 1985) should not differ materially from abnormal returns derived from more complicated benchmarking schemes.
Daily bond returns are formed using transaction-level data from the TRACE database. As discussed by Bessembinder, Maxwell, and Venkataraman (2006), the TRACE database was initiated by the National Association of Securities Dealers on July 1, 2002 at the behest of the Securities and Exchange Commission as a means of improving the transparency of the secondary bond market. At its inception, the TRACE database only covered 498 bond
issues, but as of February 2005, it now covers nearly all over-the-counter bond transactions. Panel B of Table 1 lists the number of dividend events by year for the intersection of firms tracked by both the CRSP and TRACE databases. The limited coverage of the TRACE database prior to 2005 is evident given the lower number of transactions in 2002, 2003, and 2004. Furthermore, the consequences of the recent financial crisis are clearly discernible as the number of positive dividend changes fell, and the number of dividend cuts increased, throughout 2008 and especially 2009.
Daily bond returns are formed using transaction-level data from the TRACE database from July 2002 to December 2012. To calculate daily bond returns, I largely follow the procedure established by Bessembinder et al. (2009). I begin by first dropping transactions involving the debt of financial firms and bond issues with option-like features, such as convertible debt and putable bonds, although it is worth noting that I do retain callable bonds in my sample as they constitute a large percentage of the issues (around 47%) in my sample. I also eliminate transactions in TRACE which are under $100,000 in volume as well as all canceled, corrected, commission, and duplicate trades.
As a particular bond issue may trade multiple times in a given day, and therefore have several recorded prices, I form a single daily price for each bond by weighting each trans-action price by the dollar amount of its trade divided by the total daily dollar amount of activity for that issue. From these trade-weighted prices (Ptw), I calculate the “dirty” hold-ing period return for bondion dayt(rbondi,t ) using the following formula:
rbondi,t =
Pitw,t −Pitw,t−1+AIi,t
Pitw,t−1 (3)
where AIi,t is the amount of interest that has accrued over the holding period. My
decision to report dirty returns (i.e. returns that include accrued interest) is primarily based on the fact that it most accurately reflects the returns that bondholders would experience from the sale of a bond. Nevertheless, my results are robust to the use of “clean” returns
(i.e. those that ignore accrued interest), which is not surprising given that the amount of interest which will accrue over the holding period will typically be small relative to the bond’s market price.
Given the illiquidity of the corporate bond market, it is often the case that a bond does not trade at least once per day. Therefore, it is worth noting that the return calculated in equation (2) may not be a daily return; rather it may represent a holding period return calculated over several days. The fact that the last recorded transaction price for a bond may be several days old raises the concern that returns calculated by equation (1) may be biased due to stale pricing.6 To mitigate this concern, I impose two filters for a bond to have a usable return. First, I require that a bond must have traded at least once in the past month (i.e. 20 trading days), and second, I require that the bond issue must trade at least once during the event window. I impose one final condition for a bond issue to have a usable return; specifically, consistent with Bessembinder et al., I omit bonds with returns greater than 20% in absolute value to reduce the influence of outliers.7
To calculate the abnormal bond returns (ARbondi,t ) for each issue, I first create twenty-four benchmark portfolios sorted by credit rating and time-to-maturity. Benchmarking event bonds’ returns to similar bonds based on credit rating and time-to-maturity controls for any systematic factors that may influence either default risk or the term structure of interest rates. The data necessary to determine the bond’s credit rating and time-to-maturity are ob-tained from the Fixed Income Security Database (FISD) provided by Mergent. In the case of a conflict between rating agencies, I use the Moody’s Inc. rating if available, followed by the Standard & Poor’s rating, and finally the Fitch rating if the other two are unavail-able. The benchmark portfolios are formed on a value-weighted basis using the returns
6Another potential issue is bid-ask bounce. However, as noted by Bessembinder et al., the elimination of smaller trades and the use of transaction-weighted prices should largely mitigate these concerns.
7Bessembinder et al. (2009) find that the majority of cases where bonds have returns greater than 20% in absolute value typically involve firms in default. Correspondingly, they do not likely represent the types of returns financially healthy firms experience and are thus inappropriate for benchmarking. However, I find little difference in my results if I extend the absolute value limit to 50%.
calculated from all straight, industrial bonds included in TRACE. To ensure comparability to the event bond returns, I require that the bonds that constitute the benchmark portfolios meet the same selection criteria as the event bonds (e.g. they must be issued by an indus-trial firm, they must have traded at least once in the past month) and, additionally, that they have valid returns for both timet and t - 1. The benchmark portfolios are sorted into six bins on the basis of credit rating (i.e. AAA, AA, A, BBB, BB, B and lower) and then each credit rating category is further split into one of four groups (i.e. time-to-maturity between one and three years, time-to-maturity between three and five years, time-to-maturity be-tween five and ten years and time-to-maturity greater than ten years) based on the issue’s time-to-maturity.
After obtaining the benchmark portfolios’ returns (rirate,t /ttm), each bond’s abnormal holding period return is calculated as:
ARbondi,t =rbondi,t −rratei,t /ttm (4)
Once again due to the illiquidity of the corporate bond market, abnormal returns are computed on a holding period basis where the holding period may be of several days length. For example, if a bond last traded seven days ago, its raw return would be calculated over a seven day holding period and its benchmark return would similarly be computed over the same seven-day interval. This approach ensures that bond returns are judged against benchmark returns of comparable length.
While it is possible to execute a bond event study at the issue level, due to concerns such as overweighting firms with multiple bond issues and having to correct for the cross-sectional correlation between a particular firm’s different bond issues, Bessembinder et al. (2009) advocate the use of firm-level rather than issue-level returns in bond event studies. The firm-level approach has the added advantage of measuring the average total change
in the market value of the firm’s debt as opposed to the average change in the value of a particular debt issue which makes it particularly relevant for the current study.
To form the firm-level abnormal bond returns, I begin by constructing a linking table which helps to correct for several difficulties in matching the data from TRACE and Mer-gent FISD to the data from CRSP, such as variations in issuer CUSIPs8and changes in debt responsibility due to merger activity9, to ensure that my tests provide an accurate appraisal of bondholders’ wealth changes at dividend announcements. After assigning each of my sample firms the debt issues that they are obligated to pay, each firm is treated as a portfolio of bonds in which the issue-level abnormal returns are weighted by their respective market capitalizations. I will use these firm-level abnormal returns in my statistical testing. Fol-lowing the advice of Bessembinder et al. (2009), I will test for the statistical significance of the firm-level abnormal bond returns using the nonparametric sign and sign-rank tests in addition to the standard t-test, as the authors find that nonparametric test have superior ability in detecting abnormal performance in abnormal bond returns.
The Choice of Event Window
While the choice of a proper event window is crucial for any event study, it is particu-larly imperative in a bond event study. Given the illiquidity of the corporate debt market,
8For instance, in CRSP, the only eight-digit CUSIP assigned to Abbott Laboratories over its history is 00282410, which implies an issuer identification, or base, of 002824 (i.e. the first six digits of the CUSIP). However, Mergent FISD lists additional debt belonging to Abbott under the base of 002819. Therefore, the linking table assigns debt under both the 002824 and 002819 bases to Abbott’s unique CRSP PERMCO identifier.
9Consider the following example. The current company known as AT&T was formed from the merger of SBC Communications and the old AT&T effective on 11/18/2005 and the merger of the aforementioned entity with BellSouth effective on 12/29/2006. Currently, Mergent FISD has assigned all debt belonging to the new AT&T to the parent ID of 19126. However, during some point in my sample period, the old AT&T, BellSouth, and SBC Communications were all independent companies that paid a quarterly dividend. Therefore, to properly determine the effect of a dividend announcement on bondholders’ wealth, it is necessary to ascertain which entity had responsibility for a particular debt issue at a given point in time. This process is further complicated by the fact that each of these firms has made prior acquisitions which need to be investigated. My linking table establishes an ownership record for each debt issue and thus helps to properly assign its returns to the correct firm.
expanding the event window has the advantage of increasing the number of usable bond issues; however, this comes at a cost as it simultaneously increases the likelihood of con-founding information biasing the sample. Therefore, to help judge the appropriate window length, Figure 2 displays the average and median daily dollar volume in dividend event time. Panel A of Figure 2 shows the daily volume for the total sample, while Panel B shows the volume for the sample excluding the dividend announcements made near earn-ings announcements. I chose to examine the volume patterns for each sample separately in order to assess whether the widespread presence of the quarterly earnings announcements affects the event window selection.
Overall, the volume patterns appear to be roughly similar. In both cases, there appears to be a detectable spike in volume on the dividend announcement day (i.e. event day 0) followed by a decline in activity over event days +1 and +2. This is followed by a sharp increase in volume over event days +3 and +4 before the volume once again decreases. In order to capture, the spike in activity during days +3 and +4, I will investigate four different symmetric windows starting from [-1,+1] to [-4,+4]. One noticeable difference across the samples is that Panel A typically has a much smaller daily volume than the firms in Panel B. Consistent with a signaling motivation, this is primarily due to the fact that joint announcers tend to be smaller firms which usually have smaller debt issuances and less liquid bonds (Sarig and Warga, 1989), which in turn lowers the average daily volume.10
Conditional Event Study Regressions
There are two particularly challenging aspects to determining how bondholders and shareholders react to a dividend announcement. The first problem is that dividend
an-10In unreported results, I examine whether the joint announcement decision yields increased attention for firms in the form of higher trading volume. Indeed, across firm size terciles, joint announcers tend to have statistically higher dollar volume in both the bond and stock markets during the dividend event window relative to non-joint announcers. For example, in the smallest size tercile, joint announcers witness a $31 million bump in dollar volume across the [-2,+2] event window compared to non-joint announcers.
Figure 2: Average and Median Dollar Volume During Dividend Event Time. Event date zero is the announcement of a quarterly dividend. Panel A depicts the average (boxes) and median (line) dollar volume in dividend event time for the entire sample (i.e. includ-ing firms with joint earninclud-ings and dividend announcements). Panel B displays the average (boxes) and median (line) dollar volume for the sample of firms that do not have a contem-poraneous earnings announcement during the [-7,+7] dividend event window.
Panel A.Average and Median Dollar Volume for Whole Sample.
Panel B.Average and Median Dollar Volume for Sample without Contemporaneous
nouncements are not random decisions; rather, they are the result of firms self-selecting into a dividend announcement type. The second issue is that dividend payments are often an-nounced near quarterly earnings releases. Both of these concerns can affect the inferences reached using standard event study techniques. In the first case, self-selection implies that investors may be able to determine which firms will choose a particular announcement ac-tion based on pre-announcement period observables. In well-funcac-tioning capital markets, investors will impound this information into security prices which may lead to a somewhat muted (i.e. biased) response when the announcement is actually made. In the second case, information learned from the earnings announcement will contaminate the abnormal re-turns calculated during dividend event time, potentially leading to erroneous conclusions regarding the effect of dividend announcements on securityholders’ wealth. Thus, while the traditional event study approach is useful in getting a broad assessment of the net effect of a given announcement and has some limited ability to control for confounding events (e.g. partitioning into subsamples), I will also employ the conditional event study method. I execute a conditional event study utilizing regression techniques developed by Nayak and Prabhala (2001) to deal with the aforementioned problems. To begin, I introduce a self-selection model to predict the firm’s choice of a dividend. Following Lintner (1956), Kumar and Lee (2001), and Hu and Kumar (2004), I assume that the dividend decision made by management is a deliberate two-stage process. In the first stage, the manager judges whether the firm’s expected permanent income is sufficient to support a change in the payout level (i.e. the extensive margin) and then, conditional on a change being made, decides on the appropriate magnitude of the change (i.e. the intensive margin).11 The man-agers’ decision along the extensive margin is assumed to be determined by a latent variable,
Div∗i,t, which can be thought of as the utility management derives from making the dividend
11Taking a broader perspective, the decision to simply pay a dividend at all can be considered the extensive margin decision. I do not include this selection into my framework since they represent changes inpayout policyversus modification of the firms currentdividend policyand moreover movements along this margin tend to be fairly rare (i.e. once a firm pays a dividend, it tends to continually pay). However, I do examine dividend initiations and omissions in Appendix C.
announcement.12 While Div∗i,t is imperceptible, market participants can nevertheless still form expectations regarding managerial utility through a set of variables (wi,t−1) that are publicly available prior to the announcement period. Thus, div∗i,t can be expressed as the following linear function:
Div∗i,t =αwi,t−1+ui,t (5)
whereαwi,t−1represents investors’ ex-ante expectations with respect to the benefit experi-enced by firmi’s management from announcing a dividend payout andui,t is an innovation term that is assumed to follow a standard normal distribution and constitutes management’s private information set.
Although managerial utility is unobservable, the decision they eventually undertake is easily discernible. Specifically, managers can choose one of three potential dividend an-nouncement options (indexed by j={0,1,2}respectively); that is, they can either choose to cut the dividend payment (C), leave the dividend payment unchanged (U), or increase the dividend payout level (I). Therefore, managers’ dividend announcement decision can be cast in terms of an ordered probit regression model, such that managers will:
choose I if Div∗i,t>µ2 choose U if µ1≤Div∗i,t ≤µ2 choose C if Div∗i,t<µ1 (6)
whereµjare unknown, but estimable, cutoff values.
12For the time being, I do not take any stance on whether management’s utility is aligned with the goal of maximizing the value of shareholders’ equity as the degree to which this holds depends on the compensation structure managers are given. Compensation variables will be included in the ordered probit model predicting firms’ dividend choices to account for the fact that managers’ personal incentives may influence dividend policy.
Rather than being a direct focus itself, the primary function of the ordered probit model is in determining the extent to which a given dividend announcement is anticipated by debt and equity investors. Accordingly, following studies such as Kao and Wu (1990), I collect the generalized residuals from the ordered probit model and include them as a regressor in a set of cross-sectional regressions on abnormal bond and stock returns. In essence, this is a control function approach where the generalized residuals from the ordered probit model serve as an analog to the correction developed by Heckman (1979) to the omitted vari-able problem induced by selection bias.13 Following Gourieroux, Monfort, Renault, and Trognon (1987), the generalized residuals ( ˆλidiv,t ) for the dividend announcement ordered
probit model are calculated as: ˆ
λidiv,t = φ(µˆj−αˆwi,t−1)−φ(µˆj+1−αˆwi,t−1)
Φ(µˆj+1−αˆwi,t−1)−Φ(µˆj−αˆwi,t−1)
(7)
whereφ(·)is the probability density function for the standard normal distribution andΦ(·)
is the cumulative density function for the standard normal distribution. Positive values of ˆ
λidiv,t represent unexpectedly high deviations from investors’ ex-ante predictions. Given
the choice set available to managers, this can either occur when the market anticipates that the firm will cut dividends, but instead chooses to leave them untouched, or when investors believe that the firm will leave its dividend the same, but the firm unexpectedly increases its payout level. Conversely, negative values of ˆλidiv,t will occur when the firm
chooses a dividend action that is below investors’ expectations, such as if the firm were to cut dividends when no change is predicted or leave the dividend level the same when the market is anticipating an increase.
As emphasized by Li and Prabhala (2007), the variable ˆλidiv,t has a special interpretation
in the context of a conditional event study as it measures managers’ private information released at the announcement. Accordingly, it provides an indicator of how investors’
13Indeed, as noted by Chiburis and Lokshin (2007), replacingµ
j=0 andµj+1=∞in equation (7) will yield the familiar inverse Mills’ ratio.
respond to the unexpected portion of the dividend announcement. For example, if both debtholders and equityholders view unanticipated dividend increases as positive signals, then the sign on the estimated coefficient of a regression of cumulative abnormal returns against ˆλidiv,t will be positive for both markets. However, if unforeseen dividend increases
benefit shareholders at the expense of bondholders, then the estimated coefficient will be positive for the stock market and negative in sign for the bond market, indicating a wealth transfer.
Having dealt with the non-randomness of the dividend announcement decision, it is now possible to focus on the joint earnings announcement issue. I define an earnings an-nouncement to have occurred simultaneously with a dividend anan-nouncement if the earnings announcement takes place somewhere in the [-7,+7] event window in dividend event time. I address the secondary announcement problem in two different ways. The first is a rela-tively simple approach following Dutordoir and Hodrick (2012). In their study, the authors examine stock returns following the announcement of either equity, convertible debt, or straight debt financing using a switching regression model which is very similar to the self-selection model discussed above. In their sample, they have a number of contaminated observations (e.g. approximately 39% of the straight debt offerings in the sample are near another material corporate event). To deal with this issue, Dutordoir and Hodrick simply include an indicator variable into their cross-sectional regressions to control for the pres-ence of a secondary event. In a similar manner, I include two indicator variables into my cross-section regression specifications to control for the presence of joint meet-or-beat or missed earnings announcements. As the omitted category is dividend announcements that are made separate from an earnings announcement, the estimated coefficients of the two indicator variables measure the incremental value that a joint earnings announcement adds to the abnormal returns earned following a dividend announcement.
Admittedly, the indicator variable approach is fairly crude since it fails to account for the fact that the decision to jointly announce quarterly earnings is self-selected. Therefore,
my second method of controlling for joint earnings announcements closely follows the design used for modeling the dividend announcement choice. Specifically, I assume that managers’ latent utility with respect to making a joint dividend and earnings announcement (Earn∗i,t) can be thought of as a linear combination of the ex-ante information known to capital market participants (zi,t−1) and managers’ private information (vi,t) such that:
Earn∗i,t =γzi,t−1+vi,t (8)
Just as in the dividend announcement case, managers’ utility with respect to the earnings announcement is unobservable, but nonetheless drives the observable earnings announce-ment decision. Given the large body of evidence in the accounting literature which sug-gests that managers possess a strong preference to either meet-or-beat analysts’ quarterly earnings estimates (e.g. Bartov, Givoly, and Hayn, 2002), I assume that managers will al-ways prefer to meet-or-beat analysts’ expectations rather than miss them. Additionally, as announcing earnings joint with dividends will bring additional attention to the firm, man-agers will prefer to announce jointly when the information they are signaling is good and will avoid announcing joint when it is poor. This creates four potential outcomes which are ordered from most preferred to least: (i.) announce dividends jointly with a meet-or-beat announcement (MBJ), (ii.) announce a meet-or-beat away from the dividend announcement (MBS), (iii.) announce the miss of quarterly earnings targets separately (MS), and (iv.) an-nounce a miss together with a dividend (MJ). Taken in whole, managers are assumed to pursue the following joint announcement strategy set:14
14In unreported results, I tested an alternative specification that treats the joint announcement decision as an independent self-selection decision (i.e. estimates a generalized residual term from a probit model with a dependent variable equal to one if the firm jointly announces and zero otherwise) and interacts the surprise from the joint announcement with the announced earnings surprise. In essence, this specification decouples the joint announcement decision from the sign of the earnings surprise announcement. Ultimately, my results were materially unaffected by this modification.
choose MBJ if Earn∗i,t >µMBS choose MBS if µMS ≤Earn∗i,t ≤µMBS choose MS if µMJ ≤Earn∗i,t ≤µMS choose MJ if Earn∗i,t <µMJ (9)
Similar to the dividend event choice, the following system can be estimated in an or-dered probit regression framework and its generalized residuals computed to form a vari-able (i.e. ˆλiearn,t ) which measures the amount of surprise market participants experience from
a given earnings announcement decision. To control for the fact that the latent dividend and earnings functions described by equations (5) and (8) are subject to common shocks, the order probit equations described by equations (6) and (9) will be jointly estimated.
As discussed in Acharya (1988), given that investors expectations are being captured by the generalized residual terms and assuming that capital markets are informationally efficient, abnormal bond and stock returns should not be affected by ex-ante variables. Therefore, the only variables that should enter into the conditional event study specifica-tions are those that are revealed at the time of the announcement.15 These variables would include the extensive margin dividend decision (i.e. whether to increase, decrease, or leave the dividend untouched, as measured by ˆλidiv,t ), the intensive margin dividend decision (i.e.
the size of the announced dividend change,DivChgi,t), and any information released via the quarterly earnings announcements. Thus, the systems of cross-sectional regression specifi-cations listed in equations (10) and (11) will form the basis of my analysis:
CARbondi,t =β0+β1DivChgi,t+β2λˆidiv,t +β3Meet or Beati,t+β4Missedi,t+εi,t
CARstocki,t =δ0+δ1DivChgi,t+δ2λˆidiv,t +δ3Meet or Beati,t+δ4Missedi,t+νi,t
(10)
whereCARbondi,t andCARstocki,t are the cumulative abnormal returns for the bond and stock market respectively,Meet or Beati,t is an indicator variable which is equal to one if the firm
15However, in some testing situations I do utilize interaction terms between ex-ante variables and those only discovered following the announcement.
announces a joint meet-or-beat earnings announcement and zero otherwise and Missedi,t
is an indicator variable equal to one if the firm announces that they missed their quarterly earnings target near the dividend announcement and zero otherwise. My preferred specifi-cation, due to the fact that it explicitly controls for the joint announcement decision, is:
CARbondi,t =β0+β1DivChgi,t+β2λˆidiv,t +β3λˆiearn,t +εi,t
CARstocki,t =δ0+δ1DivChgi,t+δ2λˆidiv,t +δ3λˆiearn,t +νi,t
(11)
where the variables are the same as defined above.
The standard errors of the estimated coefficients from equations (10) and (11) will be biased due to the presence of generated regressors (e.g. ˆλidiv,t ). As Pagan (1984) notes, the
presence of generated regressors does not bias the parameter estimates, but does render the standard errors of the parameter estimates inconsistent. Therefore to correct my standard errors for the presence of generated regressor bias, I bootstrap the regression standard errors using 1,000 replications (Hill, Adkins, and Bender, 2003).
CHAPTER III
TRADITIONAL EVENT STUDY RESULTS
In the first section, I discuss the event study results for the entire sample. Given the ex-tensive presence of quarterly earnings releases near dividend announcements, in the second section, I partition abnormal bond and stock returns into bins based on the firm’s dividend and earnings announcement choice.
Basic Event Study Results
Table 3 lists the cumulative abnormal returns for the entire sample across several dif-ferent event windows. The results in Panel A show the response of the stock market to dividend announcements. Overall, the results in Panel A appear to be consistent with pre-vious studies documenting the stock market’s reactions to dividend changes. On average, dividend increases are received positively by the stockholders, garnering cumulative ab-normal returns ranging from 50.28 basis points at the [-1,+1] event window to 59.49 bps at the [-4,+4] event window. In economic terms, as the average market value of equity in my sample is approximately $24.30 billion, the mean gain in shareholder wealth from a dividend increase at the [-2,+2] window is nearly $136.13 million. The results in Panel A also show that dividend cuts earn negative abnormal stock returns of -212.69 to -368.38 bps depending on the event window. This is in line with prior studies (e.g. Jensen, Lund-strum, and Miller, 2010) which document a strong negative reaction from shareholders when dividends are reduced.
Comparing the magnitudes of the results in Panel A to prior work, Grullon et al. (2002) find cumulative abnormal returns over a [-1,+1] event window of -371.00 bps for dividend cuts and 134.00 bps for dividend increases. The fact that there is a sizable difference in magnitude between the results presented in Grullon et al. (2002) and Table 2 for dividend


![Table 2: Stability of Joint Dividend and Earnings Announcements Decisions Over Time. The table below lists the proportion of sample firms which choose to jointly an-nounce both dividend and earnings information during the [-7,+7] interval in dividend even](https://thumb-us.123doks.com/thumbv2/123dok_us/10022306.2494551/27.918.141.776.226.324/stability-dividend-earnings-announcements-decisions-proportion-dividend-information.webp)

![Table 4: Stock Event Study Results by Dividend and Earnings Announcement Choice. Event study results from the [-2,+2] event window are presented below](https://thumb-us.123doks.com/thumbv2/123dok_us/10022306.2494551/47.1188.162.1030.312.633/table-results-dividend-earnings-announcement-choice-results-presented.webp)
![Table 5: Bond Event Study Results by Dividend and Earnings Announcement Choice. Event study results from the [-2,+2] event window are presented below](https://thumb-us.123doks.com/thumbv2/123dok_us/10022306.2494551/48.1188.164.1030.312.633/table-results-dividend-earnings-announcement-choice-results-presented.webp)