Cariboni Jessica Hallak Issam Rancan Michela
European Bond Issuers
2017
This publication is a Science for Policy report by the Joint Research Centre (JRC), the European Commission’s science and knowledge service. It aims to provide evidence-based scientific support to the European policymaking process. The scientific output expressed does not imply a policy position of the European Commission. Neither the European Commission nor any person acting on behalf of the Commission is responsible for the use that might be made of this publication.
Contact information Name: Jessica Cariboni
Address: Via Fermi 2749 Ispra Italy Email: jessica.cariboni@eu.europa.ec JRC Science Hub
https://ec.europa.eu/jrc JRC106348
EUR 28924 EN
PDF ISBN 978-92-79-77044-9 ISSN 1831-9424 doi:10.2760/591985
Luxembourg: Publications Office of the European Union, 2017 © European Union, 2017
Reuse is authorised provided the source is acknowledged. The reuse policy of European Commission documents is regulated by Decision 2011/833/EU (OJ L 330, 14.12.2011, p. 39).
For any use or reproduction of photos or other material that is not under the EU copyright, permission must be sought directly from the copyright holders.
How to cite this report: Cariboni, Jessica, Issam Hallak, and Michela Rancan, European Bond Issuers, EUR 28924 EN, Publications Office of the European Union, Luxembourg, 2017, ISBN 978-92-79-77044-9, doi:10.2760/591985, JRC106348
All images © European Union 2017 Title: European Bond Issuers Abstract:
This study investigates the characteristics of the European non-financial corporations (NFC’s) bond issuers in the period 2004-2015. We find that bond issuers are significantly different from non-bond issuers; they are larger and older, and listed firms are more likely to issue bonds. Among listed firms bond issuers are more leveraged, but the difference vanishes as we consider the full sample. Investigating bond terms, we find that larger companies are likely to have more balanced maturity term structures of bonds.
Contents
Executive Summary ... 2 1 Introduction ... 3 2 Data ... 5 2.1 Sample selection ... 5 2.2 Bond characteristics ... 72.3 Bond markets over time ... 10
3 Statistical results ... 14
3.1 Univariate analysis of issuers characteristics ... 14
3.2 Multivariate bond level analysis ... 16
3.2.1 Bond Issuance Amounts ... 17
3.2.2 Bond Maturities ... 19
3.2.3 Bond Yields ... 22
4 Conclusions ... 24
References ... 25
Annex A: Ownership-based rules of selection of firms ... 27
Annex B: Definition of Variables ... 28
Annex C: Sample Description ... 29
List of figures ... 31
1
Authors
Jessica Carboni, Joint Research Centre, Ispra (Italy) Issam Hallak, Joint Research Centre, Ispra (Italy) Michela Rancan, Joint Research Centre, Ispra (Italy)
2
Executive Summary
1The recent financial and sovereign crises emphasised the need to further integrate the European financial system. In particular, the overreliance on bank financing coupled with a segmented financial system affected corporate growth in an uneven fashion across countries, thus widening existing economic gaps. The European Banking Union constitutes a major step towards integration; the construction of the Capital Markets Union comes next in the policy agenda. In 2015, the Juncker Commission launched a vast programme of reforms with the purpose to enhance the European Capital Market Union. The Action Plan on Building a Capital Market Union mentions the easier access to capital markets across Europe as a major objective in the construction,2 and the first of
the three stated objectives of the Capital Market Union is to “broaden the sources of financing in Europe towards nonbank financing by giving a stronger role to capital markets.”3
This study aims at contributing to the Capital Market Union plan by providing an analysis of the European non-financial companies, which issue bonds. Bonds are debt instruments traded in markets, and constitute a traditional alternative to bank loans. The study investigates the characteristics of bond issuers as well as the respective bond terms, in the period 2004-2015. We use the databank of bonds published by Dealogic DCM, that we linked to Bureau van Dijk ORBIS to extract financial information about bond issuers.
Our findings show first that the crisis led to a contraction of the bond amounts issued and to a shortening of the maturities; yet, in the aftermath of the crisis, riskier companies issued larger bond amounts. Second, bond issuers are significantly different from non-bond issuers; for instance, they are larger and older, and listed firms are more likely to issue bonds. Differences are comparable whether we consider the full sample, the sample of large firms, or the sample of listed companies. Yet, leverage is an exception: consistently with previous studies, we do find that among listed firms, bond issuers are more leveraged; the difference vanishes as we consider the full sample. Last, investigating bond terms, we find that larger companies are likely to have more balanced maturity term structures of bonds.
The reports suggest a number of variations among corporations and bond terms over time, which should be subject to further analysis.
1 The content of this report does not reflect the official opinion of the European Union. Responsibility for the information and views expressed therein lies entirely with the authors.
2 Action Plan on Building a Capital Markets Union, COM(2015) 468, Brussels 2015. 3 Commission Staff Working Document, SWD(2015) 183 Final, Brussels, 30.9.2015.
3
1
Introduction
The financing of the European firms has been substantially impacted by the recent financial and sovereign crises. Yet, the adverse effects of the crises were uneven across countries, and a major source of such discrepancies was the persisting fragmentation of the European financial system. In fact, it turned out that among others the heterogeneity in regulatory and supervisory environments at that time substantially contributed to maintaining barriers within the European banking system and across capital markets. While such heterogeneity was initially aimed at adapting general principles to domestic rules of practice, they became a major obstacle to the European economic integration and the conduct of the unified monetary policy; the crises amplified the problem and revealed that reforming the European financial system was imperative. As a result, in the aftermath of the crises, the European Commission has launched two major programmes aiming to reduce financial segmentation within Europe.4 On the one
hand, the European Banking Union has promoted a more homogeneous regulatory and supervisory framework among euro-area member states. Among others, the ECB has taken over the supervision of the 120 significant banks, and a Single Resolution Fund has been created so that the same resolution rules applied to all, with common funds at disposal.5 By creating common rules and resolution procedures, the reforms have
promoted both the transparency and the soundness of the banking system.
In 2014, the Juncker Commission launched the second leg of the programme of reforms of the financial system, this time aimed at integrating the European capital markets. The so-called Capital Markets Union (CMU) Action Plan was enacted in 2015 and proposed a vast programme of consultation. The Commission Staff Working Document 2015.183 states three objectives:
[1] The CMU will broaden the sources of financing in Europe towards nonbank financing by giving a stronger role to capital markets;
[2] The CMU will help deepen the single market for financial services; [3] The CMU will help promote growth and financial stability.
The objective is thus to create a wide common capital market that facilitate access to capital markets to a larger range of firms at lower costs.
4 The European Central Bank has also undertaken unconventional policies that temporarily balance the access to capital markets and reduce financial segmentation, e.g., quantitative easing and asset purchasing programmes.
5 The Bank Recovery and Resolution Directive (BRRD 2014/59/EU), adopted in spring 2014, entered into force on 1 January 2015.
4
By investigating the characteristics of European bond issuers and bond terms (amount, maturity and yield), this report intends to support the understanding of how European financial markets work, thus contributing to the finalization of the Capital Markets Union plan.
The study focuses on non-financial corporates and makes use of micro-level data on bond issuances and firm characteristics in the period 2004-2015. In particular, we aim to answer questions such as: (i) How did bond markets in Europe evolve during the financial and economic crisis? (ii) What are the characteristics of bond issuers and did they vary? (iii) How do bond terms, i.e., amounts, maturities and yields, vary in function of firms characteristics?
Bonds have been widely studied. A first line of research looks at the impact of accessing bond markets on the firms, and the characteristics of the latter. Authors find significant differences between bond and non-bond issuers. Using US data of listed companies, Faulkender and Petersen (2006) show that bond issuers are significantly larger, older, more profitable and leveraged. Bond issuers invest less in R&D, have lower growth prospects – measured with the ratio of market-to-book value of assets – and substantially higher return on equity. Bond issuers contract debt with longer maturity. Larger access to debt reflected by larger leverage ratio relates to transparency and friction costs. Using a similar approach, Harford and Uysal (2014) show that US bond issuers are more inclined to undertake acquisitions than non-bond issuers, and are willing to pay a higher premium, and extract lower returns on acquisitions than non-bond issuers. The findings thus suggest that access to non-bond markets has real effects not only on the ability to undertake investments, but also on the overall profitability of investments.
Another line of empirical research focuses on the timing of bond issuances, especially in relation with macroeconomic business cycles. Among others, Erel, Julio, Kim, Weisbach (2012) develop a multinomial logit decision model. In their model, firms can opt between bonds, bank loans, and equity. The authors find evidence that the firm’s creditworthiness is a significant determinant of bond issuance along business cycles: non-investment grade borrowers’ bond issuances are pro-cyclical, while investment grades are counter-cyclical. Thus, access to bond markets is uneven through business cycles and varies across risk categories of firms. Also, the authors find that bond issuers are older and larger firms, with larger leverage and cash-holding ratios, and growth prospects.
In their analysis, Campolongo, Cariboni, Hallak, and Rancan (2016) question the firms’ characteristics as a determinant of bond issuance, and conjecture that firm characteristics and bond issuance are determined by a common set of risk-related
5
factors. The authors construct a multinomial decision logit model à la Erel et al. (2012), and find the same impacts of firms’ characteristics on bond issuance as Erel et al. (2012). Yet, after endogenizing cash-holding, the latter has a positive impact on bond issuance; holding more cash improves access to bond markets.
Even though bonds vary from banks loans in a number of characteristics, bonds and bank loans may substitute each other. Adrian, Colla, and Shin (2012) find empirical evidence that US firms which had already issued bonds before the 2007-09 crisis decreased bank loan new issuances in favour of bonds.6 Lo Duca, Nicoletti, and Martinez
(2016) show that US quantitative easing has positively impacted the bond issuance volumes measured as the share of GDP. In fact, the total amount of dollar-denominated bonds issued by non-US corporations has increased substantially from $6 trillion to $9 trillion between 2007 and 2015 (e.g., McCauley, McGuire, and Sushko, 2015; Bacchetta and Merrouche, 2015).
Evidence on European firms are limited. Altunbas et al. (2010) investigate the financial characteristics that influence the choice of firms between syndicated loans and bond issues and find that bonds are the preferred source of funding by firms with more growing opportunities. Using a similar empirical framework De Almeida and Masetti (2015) document stronger difficulties to access the bond market for firms located in GIIPS countries (Greece, Ireland, Italy, Portugal, and Spain) than firms located in other euro-area countries.
2
Data
2.1
Sample selection
In order to investigate the characteristics of bond issuers, we combined two datasets. First, we selected all bonds tranches issued by European non-financial companies in the period 2004-2015. We obtained bonds characteristics from Dealogic DCM. Dealogic DCM is the main provider of data about bonds primary markets worldwide. We selected all non-financial corporations (SIC code below 8,000, excluding codes between 6000 and 6999) registered in any of the 28 country members of the European Union. The sample of bonds is made of 10,690 tranches, involving 2,205 unique bond issuing names, and 1,498 unique ultimate parents; ultimate parents in DCM are current ultimate owner of the corporate group. Our sample is at tranche level, which enables us to use bond
6 A similar result had already been reported by Kashyap, Stein and Wilcox (1993) using monetary policies in the period 1960-1989. The authors observe a shift from bank loans to commercial papers in time of monetary policy contractions.
6
tranches characteristics, e.g., amount, maturity, yield, issuance market, subordination, callability and collateralization.
Besides, we obtained firms’ financial data in the period 2004-2015 from ORBIS. ORBIS is a comprehensive dataset of all types of companies worldwide, from micro to very large companies, published by Moody’s Bureau van Dijk.7 The smallest companies in our
sample of bond issuers had total assets above 10 million euros; we thus selected companies with total assets above 10 million euros at least one year in the period 2004-2015. We are indeed aiming at comparing firms in their decision to issue bonds, and size is likely to be an exogenous constraint. Last, we selected non-financial companies in ORBIS (“industrial template”), and dismissed firms with SIC codes equal to or greater than 8000 (non-corporations) and between 6000 and 6999 (financial corporations). We restrained companies in ORBIS to parent companies. ORBIS provides parent companies at the 50% threshold. Yet, some firms held at 50% ownership or higher may still be stand-alone firms, e.g., publicly quoted family firm. We thus used the ownership structure provided by ORBIS and proceeded as follows. First, we dismiss any company owned by another industrial company if ownership is equal or greater than 90%.8 We yet
retained the firm if the owner is a financial corporation since final owners may be a holding company or a fund that reports no financial statements. Besides, multinational companies sometimes register intermediary holding companies, which is in turn owned by a corporation. We control for such structure as follows. We first save the list of owners in our sample classified as Financial Type; we then collect the owners of these financial firms. We dismiss a firm if the owner is a financial company, and the latter is owned by an industrial company with 90% ownership. All details of our ownership-based selection are reported in Appendix B. Our final sample of ORBIS European non-financial companies includes 50,309 companies, and 420,648 firm-year observations (with available total assets).
We manually matched the list of bond issuing firms in Dealogic DCM with ORBIS. Unfortunately, we did not find relevant numerical identifiers for the linking such as a VAT number. Therefore, we first run a name matching routine controlling for names, and then manually checked the automatic matching and completed the name matching manually. In the name matching, we first used the name of the company in ORBIS, then
7 In a recent survey of Orbis, Kalemli-Özcan et al. (2015) provides a detailed survey and quality check of the ORBIS dataset.
8 We did not use Orbis so-called global ultimate owners (GUO) for a number of reasons. First, the GUO controls for direct or total ownership above 50%, which we believe is excessively low. Second, we ensured that the type of the owner is indeed an industrial company, so that we retained companies who are owned by some other types of owners, e.g., “public market” and “family-holding.”
7
the global ultimate owner (GUO). Actually, name matching allowed us to further identify the ownership. We then dismissed bond observations with missing settlement dates or settlement date outside our sample time window 2004-2015, resulting in 7,570 observations for which we could identify an Orbis identifier. The final sample for which accounting information are available includes 5,952 bond issuances, including 529 unique firm names and 1,701 unique firm-year observations.
2.2
Bond characteristics
In this section, we describe the characteristics of bonds issued by European firms. We first look at the distribution of bond tranches by maturity. Figure 1 is split in three panels: the number of issuer observations, number of tranches, and total amounts. In each panel we define four maturity categories: less than 5 years, between 5 and 9 years, between 10 and 19 years and, equal or greater than 20 years. In our sample, the weighted average maturity of bonds – where weight is the bond amount – is about 8 years, and bond maturities vary from less than 12-month to perpetual. 9
Of all maturity buckets, issuers most frequently choose the 5-10 year maturity bucket and the largest number of tranches is also in this maturity bucket (2,371). Last, in face value, 46% of deals have a maturity between five and ten years. Generally speaking, 86% of the deals report maturities below twenty years in face value. Shorter maturity is also frequent in terms of number of tranches (1,829; 30%) but much smaller in terms of amount (19% of the total amount). It seems that some borrowers specialize in this maturity since the share of issuers is also lower. Bond with maturity between 10 and 20 years accounts for a slightly larger percentage (24%) in terms of amounts but a lower number of tranches. Last, bonds with longer maturity are less frequent and account only for 14% of the total amount issued.
Figure 1: Bond Issuance by Maturity.
9 Table C 1 in Annex C provides the distribution of the sample.
0
100
200
300
400
500
0-5 y5-10 y10-20 y20+ y Number of issuers0
500
1,0
00
1,5
00
2,0
00
2,5
00
0-5 y5-10 y10-20 y20+ y Number of tranches 19% 46% 24% 11% Amount issued Bond issuance by maturity8
Notes: Number of issuers, number of deals and share of amount issued by bond maturity class. We consider four maturity classes: less than 5 years, between 5 and 9 years, between 10 and 19 years and equal or greater than 20 years. Source: JRC Calculation based on Dealogic DCM.
Figure 2 reports the distribution of bond tranches by currency of denomination (Panel A) and by issuing market, i.e. the main market place where the bond is sold (Panel B). The majority of bond tranches are denominated in euro, amounting to 64% of the total amount in our sample, followed by the USD dollar (20% of the total amount issued), and the British Pound (10%). Other currencies cover only a residual share (see Figure 2 left panel).
Figure 2: Bond Issuance by Currency of Denomination and Markets.
PANEL A: Currency of Denomination
PANEL B: Market of Issuance
Notes: Number of issuers, number of deals and share of amount issued by currency of denomination (panel A) and market (panel B). The figures report the number of firm-year issuers, number of deals, and total amounts by currency of denomination of the bond tranches (Panel A) and of the market of issuance (Panel B). Market type is a code provided by DCM representing the market where the issue is sold. Source: JRC Calculation based on Dealogic DCM.
Panel B in Figure 2 shows that less than 300 companies in our sample issued bonds in non-domestic markets, suggesting that only a limited number of companies are willing
0
500
1,
00
0
1,
50
0
EURGBPJPYUSDOthers
Number of issuers
0
1,
00
0
2,
00
0
3,
00
0
EURGBPJPYUSDOthers
Number of tranches 64% 10% 1% 20% 5% Amount issued Bond issuance by currency
EUR GBP JPY USD Others
0
500
1,0
00
1,5
00
0 1 2 Number of issuers0
1,0
00
2,0
00
3,0
00
4,0
00
5,0
00
DomesticForeign/GlobalEuro
Number of tranches
3% 13%
84%
Amount issued Bond issuance by market
9
or are able to issue in non-domestic markets (besides the Euro-market). The majority of the bonds have been issued in the so-called “Euromarket” (Panel B).10 Most of the bonds
in our dataset are issued on the public market (80%) while the rest is placed in the private market; this confirms the limited role of private placements in Europe.11
Figure 3 reports the share by sector of activity in ORBIS of the bond issuers. We construct sectoral groups as follows: Agriculture, Forestry, and Fishing; Mining and Construction; Manufacturing; Utilities: Transportation, Communications, Electricity, Gas and Sanitary Services; Trade: Wholesale and Retail; Services. Largest groups are Manufacturing, and Transport, Communications, Electric, Gas and Sanitary Service, which issued, respectively, 40 % and 44% of the total amount. Approximately 200 issuers are classified in the Mining and Construction sectors accounting for 11% of the total amount. Other sectors accounts only for a residual part of the bond market (see Figure 3).
Figure 3: Bond Issuance by Industrial Sector.
Notes: Number of issuers, number of deals and share of amount issued by Industrial sector: Agriculture, Forestry and Fishing (0), Mining and Construction (1), Manufacturing (3), Transportation, Communications, Electric, Gas and Sanitary service (4), Wholesale Trade and Retail Trade (5), and Services (7). Source: JRC Calculation based on Dealogic DCM.
10 Domestic bonds are bonds denominated in the national currency of the issuers, underwritten by domestic banks and sold into the domestic market. Foreign bonds are bonds issued in the domestic currency of the underwriters but the issuer is foreign. For instance, so-called Yankee bonds are bonds issued by non-US firms in US markets. Finally, Eurobonds are bonds structured domestically where at least 25% of the issue is placed outside. Eurobond markets are typically issued in London and traded in Luxembourg. Eurobond markets are over-the-counter markets, typically subject to few regulatory constraints; instead foreign bonds are subject to the same regulatory environment as domestic bonds.
11 Private placements are subject to less stringent regulatory rules compared to public bonds, in particular in terms of information provisions, but also financial contracting and renegotiation. Private placement is a hybrid debt instrument between syndicated loans and public bonds. Because of the less stringent compliance rules, investors are mainly institutional investors such as insurance companies and pension funds, and hardly retail. In the U.S. private placement is a major debt instrument, particularly for smaller and riskier firms (Kwan and Carleton, 2010). The size of the private placement market in Europe is very restrained due to the smaller pool of financial intermediaries and a lack of regulation harmonization across countries. Lately, the European Commission has taken initiatives so to promote private placements within the framework of the European Capital Markets Union Action Plan (European Commission, 2015).
0
200
400
600
800
0 1 3 4 5 7 Number of issuers0
1,0
00
2,0
00
3,0
00
0 1 3 4 5 7 Number of Tranches 0% 11% 40% 44% 4%1% 0 1 3 4 5 7 Amount issued Bond issuance by industrial sector10
In unreported results, we find that about 51% of the tranches include a negative pledge clause. Negative pledge is a clause that disallows bond issuers to pledge current assets for subsequent debt, so that the currently issued debt keeps the seniority on existing assets with respect to subsequently issued debt. About 18% of the bonds are callable; callable bonds are bonds the bond issuer may repay before the maturity date. Finally, less than 5% are collateralized. Issuers indicate as intended use for the capital raised “general corporate purposes” in most of the cases. A limited number of deals is intended for restructuring or refinancing (11%), acquisitions (2.5%) and capital expenditures (1%).
2.3
Bond markets over time
We start our analysis by considering the overall amount issued by firms in Europe in the period 2004-2015. In Figure 4, we plot the ratio of the total amount issued by financial sector and non-financial sector over GDP (at market prices). The graph shows that financial firms rely substantially more on the bond market compared to the non-financial firms. With the financial turmoil, there has been a sharp contraction in the amount issued for both groups, but while most recently the amount issued by non-financial firms have reached or exceeded the pre-crisis level, the amount issued by financial companies has decreased steadily until 2015. The rest of the report focuses on non-financial corporations, and involves bonds for which we could match the issuers in ORBIS.
Figure 4: Total Amount of Bond Issuance Relative to GDP
Notes: This figure reports the share of the total amount of bond issued to the total EU28 GDP, in the period 2004-2014. The short dash line reports the numbers for non-financial companies (NFC, left-hand scale); the long dash line reports the numbers for financial companies (FC, right-hand scale). Source: JRC Calculation based on Dealogic DCM and Eurostat.
.0
5
.1
.1
5
.2
FC
.0
15
.0
2
.0
25
.0
3
.0
35
N
FC
2005 2010 2015 YearNon-financial firms Financial firms
11
Figure 5 reports the time plots of the average amounts issued over firm’s total assets and number of deals of all non-financial firms in our sample. There is an upward trend over time of both the total amount and the number of deals. Yet, there is a contraction in 2008, following the financial crisis. Still, in 2009, there was a noticeable increase both in the total amount issued and in the number of deals, but a new slowdown featured the year 2010. Indeed, new turbulences hit the European financial markets with the collapse of some banking institutions requiring state interventions (e.g. Ireland, Spain, Germany) and the increase in sovereign riskiness in other countries due to the high level of debt (e.g. Italy, Portugal and Greece). Brunnermeir et al. (2011) refer to the negative feedback-loops between banking and sovereign sectors with the term “diabolic loop” to emphasize how the fragilities between the two sectors were mutually reinforcing. The resulting economic recession become deeper in Europe with increased number of corporate defaults and high level of unemployment (see e.g., Bedendo and Colla, 2015; Boeri and Jimeno, 2016).
Figure 5: Total Amount of Bond Issuance in Euro, and number of deals.
Notes: The figure reports the average amount issued over firm total assets (dash-dot line, left-scale) and the total number of deals issued each year (dot line, right scale) by non-financial companies. Source: JRC Calculation based on Dealogic DCM and Moody’s BvD Orbis.
Inspecting further the figure, we can notice that in the years 2012-2014, both variables have increased again.12 One possible explanation for this development is in the fragilities
of the banking sector. Some European banks have extraordinary high-level of non-performing loans (NPLs) and low profitability (European Central Bank, 2016), while at
12 In 2015 the sharp decrease in the number of deals is due to the incompleteness of the financial data of companies, but there has also been a contraction in the amount issued in the complete sample as shown in Figure 4.
0
200
400
600
800
Nu
mb
er
o
f t
ra
nch
es
0
3
6
9
Ave
ra
ge
a
mo
un
t/T
A
(%
)
2005 2010 2015 Year12
the same time facing tightening regulatory environments. Thus, despite the ECB’s unconventional monetary policy interventions (Cour-Thimann and Winkler, 2012), in some member states the supply of new credit to the real economy has contracted and consequently we observe a trend towards further capital market-based financing. This is consistent with Adrian et al. (2012).
Figure 6 reports the yearly weighted average maturity of bonds, where weights are the tranche size. The curve shows that the average bond maturity nearly lost more than a third of its value from around 10 in 2007 to less than 7 years in 2008. The surge in volumes in 2009 is quite impressive (Figure 4), while the maturities are back to pre-crisis levels only in 2013. The figures may suggest that volumes and maturities, to some extent, are determined by similar factors.
The trends in the maturity may reflect the perceived risk in the markets. The sharp drop during the 2008 global financial crisis and the 2011 European second banking and sovereign crises shows that the market not only reduced amounts but also reduced maturities at a time of uncertainty. Many companies may also have waited for clearer skies, i.e., improved market conditions and higher precision in their own operational forecasts. The substantial increase at the end of our sample period is likely to signal positive developments of the debt markets. In fact, longer maturities mitigate roll-over risk for borrowers and also increase the duration risk for investors. The longer maturities might also be due to low interest environments and the demand from the markets for higher interest rates that are more likely in longer terms debt contracts.
Figure 6: Average maturity of Bond Issuance.
Notes: Weighted average maturities bonds issued in the period 2004-2014; maturities are weighted by the face value of the bond. Source: JRC Calculation based on Dealogic DCM.
6
7
8
9
10
11
W
ei
gh
te
d
M
at
uri
ty
2005 2010 2015 Year13
In order to gain further insights, we refine our analysis of bond issuance amounts and maturities by looking at different groups of issuing firms; we split the sample by interest coverage.
Figure 7 reports the average yearly bond issuance amounts to firm’s assets. For each company we sum all bond issuance amounts in a year and divide the sum by the total assets of the company, at the end of the year. Figure 7 reports the historical yearly averages (left figure) and the weighted average yearly maturities (right figure), where weights are the firms’ bond issuance amounts. The figure splits the sample in three terciles of interest coverage. The interest coverage is the ratio of earnings before interests and taxes to interest payments. The interest coverage ratio measures the firms’ capacity to pay interests on financial debts, and thus proxies for firm level of riskiness and financial weakness in the short run (see e.g., Harris and Raviv, 1990). The first tercile 1-pc is the group of firms with the lowest interest coverage ratio (the riskiest) while 3-pc is the group of firms with the highest interest coverage ratio (the least risky). The left panel of Figure 7 shows that in 2008 the riskiest companies experienced a contraction in the relative amount issued but an upward trend later on, markedly for those companies with a riskier profile (i.e., with an interest coverage in the first-percentile of our sample computed at yearly level). Looking at the average maturity in the right panel, we observe that lower interest coverages were associated with longer maturities. In 2006, the average maturity of top tercile issuers were about 9 years, while it was nearly 12 years at the bottom tercile. After the crisis the maturities converged around eight years in 2012. All sub-samples reduced their average maturities down to seven years. Low interest coverages may capture firms which report low returns for some years until they reach equilibrium; they thus need longer maturities.
Figure 7: Newly issued bond average amount issued and maturity by subsample.
PANEL A: Sample split by interest coverage.
Notes: Yearly values of averages of bond issaunces: ratio of bond amount to total assets (left panels), and average maturity weighted by bond deal size (right panels). We split the sample in several subsamples using measures of risk and opacity. We split the sample in three terciles using interest coverage: he first tercile
4 6 8 10 12 % 2005 2010 2015 year
Int. cov. 1-pc Int. cov. 2-pc Int. cov. 3-pc
Average amount issued/TA
6 8 10 12 14 2005 2010 2015 year
Int. cov. 1-pc Int. cov. 2-pc Int. cov. 3-pc
14
group (1-pc) is the group of firms that report the smallest interest coverage, and the third tercile (3-pc) the largest. Source: Bonds details are obtained from Dealogic DCM; firms characteristics are obtained from BvD Orbis.
Overall, the access of European non-financial companies to external debt in the period 2004-2015 has been heavily affected by both the trends in the financial markets and the challenges faced by the domestic banking sector. Central banks have undertaken several policies such as quantitative easing and asset purchasing programs, which have lowered the nominal interest rates to zero and sometimes to negative bounds. The consequent compression of term and risk premium implies an increasing search for yields by investors. At the same time, firms are possibly trying to take advantage of interest rates below historical levels. A further element is the contraction of credit of the banking system that leads firms to use alternative source of funding documented by e.g., Adrian et al. (2012). Importantly, looking at the patterns in bond issuance over time in the last few years under analysis, companies, on average, were able to rely more on the bond market, including those that are riskier.13 This expansion points towards a deeper bond
market, which may allow firms to grow.
3
Statistical results
3.1
Univariate analysis of issuers characteristics
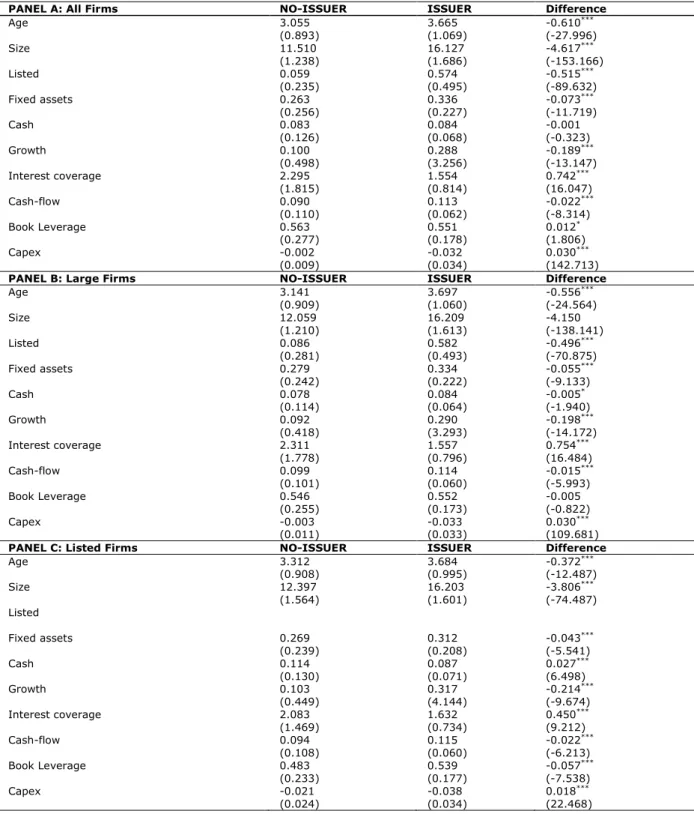
In this section, we investigate which of the characteristics of the firm determine bond issuance. We first report the univariate analysis of firm-year statistics of issuers and non-issuers in Table 1, which shows the differences between non-bond issuing firms and bond issuing firms, retaining medium and large companies only. We set the size lower bound as the lowest asset size of our pool of bond issuers.
Bond-issuing firms are significantly larger and older. The access to bond markets thus seems conditional on establishing a reputation through a track record. Moreover, 60% of bond issuers are listed companies, while 6% of non-issuers only are listed.14 Due to the
regulation of public markets, listed companies are subject to substantial information provision requirements. The share of listed firms among bond issuers exceeds by far the share of listed firms in the whole sample. In terms of performance, bond issuers grow more and invest less. Besides, bond issuers are more profitable (EBIT) but their interest
13 Potential systemic risks and fragilities for the overall system should be limited by the market participants, such as institutional investors, which have well-diversified portfolios and can properly assess financial risks. Moreover, the terms of the contracts – e.g., maturity and collateral requirements – are additional elements, which need to be taken into account so to properly screen firms and differentiate the levels of riskiness.
14 We report listed companies from ORBIS status, and control for initial offering and delisting dates reported separately in ORBIS.
15
coverages are lower. This may explain lower levels of capital expenditure. Regarding the funding structure, issuers are less leveraged than non-issuers.
Table 1: Characteristics of Bond Issuers and Non-Bond Issuers.
PANEL A: All Firms NO-ISSUER ISSUER Difference
Age 3.055 3.665 -0.610*** (0.893) (1.069) (-27.996) Size 11.510 16.127 -4.617*** (1.238) (1.686) (-153.166) Listed 0.059 0.574 -0.515*** (0.235) (0.495) (-89.632) Fixed assets 0.263 0.336 -0.073*** (0.256) (0.227) (-11.719) Cash 0.083 0.084 -0.001 (0.126) (0.068) (-0.323) Growth 0.100 0.288 -0.189*** (0.498) (3.256) (-13.147) Interest coverage 2.295 1.554 0.742*** (1.815) (0.814) (16.047) Cash-flow 0.090 0.113 -0.022*** (0.110) (0.062) (-8.314) Book Leverage 0.563 0.551 0.012* (0.277) (0.178) (1.806) Capex -0.002 -0.032 0.030*** (0.009) (0.034) (142.713)
PANEL B: Large Firms NO-ISSUER ISSUER Difference
Age 3.141 3.697 -0.556*** (0.909) (1.060) (-24.564) Size 12.059 16.209 -4.150 (1.210) (1.613) (-138.141) Listed 0.086 0.582 -0.496*** (0.281) (0.493) (-70.875) Fixed assets 0.279 0.334 -0.055*** (0.242) (0.222) (-9.133) Cash 0.078 0.084 -0.005* (0.114) (0.064) (-1.940) Growth 0.092 0.290 -0.198*** (0.418) (3.293) (-14.172) Interest coverage 2.311 1.557 0.754*** (1.778) (0.796) (16.484) Cash-flow 0.099 0.114 -0.015*** (0.101) (0.060) (-5.993) Book Leverage 0.546 0.552 -0.005 (0.255) (0.173) (-0.822) Capex -0.003 -0.033 0.030*** (0.011) (0.033) (109.681)
PANEL C: Listed Firms NO-ISSUER ISSUER Difference
Age 3.312 3.684 -0.372*** (0.908) (0.995) (-12.487) Size 12.397 16.203 -3.806*** (1.564) (1.601) (-74.487) Listed Fixed assets 0.269 0.312 -0.043*** (0.239) (0.208) (-5.541) Cash 0.114 0.087 0.027*** (0.130) (0.071) (6.498) Growth 0.103 0.317 -0.214*** (0.449) (4.144) (-9.674) Interest coverage 2.083 1.632 0.450*** (1.469) (0.734) (9.212) Cash-flow 0.094 0.115 -0.022*** (0.108) (0.060) (-6.213) Book Leverage 0.483 0.539 -0.057*** (0.233) (0.177) (-7.538) Capex -0.021 -0.038 0.018*** (0.024) (0.034) (22.468)
Notes: Bond issuing firms (ISSUER) are those which issued at least one bond in a given year; no-bond issuing firms (NO-ISSUER) are those which did not issue any bond in a given year. Variables are defined in Annex B. Source: Bonds details are obtained from Dealogic DCM; firms characteristics are obtained from Moody’s BvD Orbis.
16
Panel B of Table 1 focuses on large companies. We define large companies those companies that in each year satisfy the requirements of a large companies according to the EU definition.15 We find similar results. Bond issuers are significantly older and
larger, have higher profitability performance measured by cash-flows, but lower sales growth.
Panel C of Table 1 reports results for listed companies only. Interestingly, the characteristics vary between bond and non-bond issuers in a similar fashion. For instance, bond issuers are older and larger, and report lower interest coverage. Consistent with the previous studies, we find that bond issuers hold less cash. While holding more cash reduces liquidity risk, higher levels of cash also reflects higher financial constraints (see, e.g., Bates, Kahle, Stulz, 2009). This is consistent with the prediction that bond-issuing firms are less financially constrained (e.g., Faulkender and Petersen, 2006; Campolongo et al., 2017). There is yet one noticeable difference with the full sample: consistent with Petersen and Faulkender (2006) the leverage of bond issuing firms is larger.
3.2
Multivariate bond level analysis
In order to analyse the determinants of bond issuance, we construct Model [1], an empirical model of the determinants of bond terms.
Bond Term = Age + Size + Listed + Fixed Assets + Cash-Holding + Growth + error [1]
Bond Term is the dependent variable and is alternatively Amount, Maturity, and Yield. Amount is the share of the total amount of bonds issued by a firm in a year to its total assets. Maturity is a categorical variable of the bond maturity. Yield is the bond yield to maturity of the bond at the date of issuance.
Explanatory variables in the baseline model are as follows. Age is the age of the company in years; we use the incorporation date provided by ORBIS. Size is the total assets. Listed is a dummy variable that takes the value one if the firm is listed in a stock exchange. Fixed Assets is the ratio of fixed asset to total assets. Cash-holding is the ratio of cash held by the firm over total assets. Growth is defined as the year-to-year sales growth. We replace sales growth with total operating revenues whenever sales growth is missing. We run alternative specifications including additional variables to capture firm riskiness. Interest coverage is the operational profits coverage of interest
15 Number of employees greater than 250; and turnover greater than 50mln or total assets greater than 43mln. http://ec.europa.eu/enterprise/policies/sme/facts-figures-analysis/sme-definition/index_en.htm
17
payments. In an alternative model we use two different proxies of firm riskiness, cash-flow and book leverage. Cash-cash-flow is the ratio of operating cash-cash-flow to total assets, where operating cash-flow is defined as the net earnings before extraordinary items, tax and financial expenses, plus depreciation and amortization. Interest coverage is the ratio of earnings before extraordinary items, interests and taxes (EBIT) on interest payments.16 Book leverage is the ratio of total liabilities to total assets. Because we were
afraid of some correlation with other variables, especially cash-flow and growth, we substitute Growth with Capex, defined as the ratio of capital expenditure to total assets. Last, errors are clustered at country level. Annex B reports detailed definitions and Annex C includes summary statistics (Table C 2) of all variables.
3.2.1
Bond Issuance Amounts
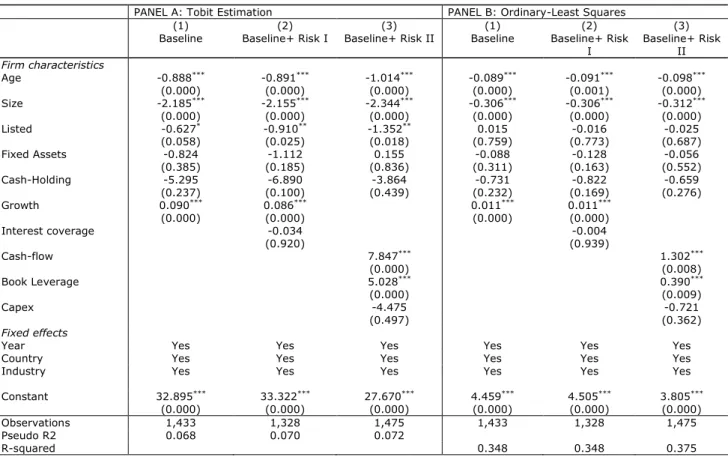
We first estimate Model [1] where the dependent variable is Amount. Because the variable is bounded between zero and one, we run the estimates using the Tobit estimation model. The results are reported in Table 2, Panel A. Panel B of Table 2, reports estimates of the same model using Ordinary-Least Squares (OLS) estimation method (log-normal model). Bonds may yet affect a firm’s characteristics. For instance, issuing bond may result in a larger leverage or a larger size of the company. In order to avoid such impact, we use prior year independent variables. All the models include year, country and industry fixed effects.
The baseline model shows that age and size have a negative impact on bond amounts. Thus, while it is more likely that older and larger companies are bond issuers in a year (see univariate analysis), the overall yearly amounts are relatively lower for these companies. Larger and older firms are likely to issue bonds on a higher frequency basis. Presumably, smaller companies issue relatively larger bonds in fewer occasions, the rationales relating to cost and liquidity management. In fact, each bond issuance has fixed costs regardless of the size; and the fixed costs are relatively higher to smaller firms. Moreover, by increasing the size of individual bonds issuers may be attempting to increase the liquidity of secondary markets (Servaes et al., 2006).
Fixed Assets show negative but insignificant effect on amounts. Listed is also negative with a statistically significant coefficient only in Panel B. Thus, transparency and recovery rates hardly affect yearly amounts. Growth shows a positive and statistically significant coefficient suggesting that higher growth companies are able to raise larger
16 Interest payments are reported in a memo item in ORBIS; we replaced interest payments with financial expenses whenever interest payments are missing. We verified that financial expenses were close to interest payments whenever both were available.
18
amounts in the debt market. In Column (2) we add Interest Coverage, our proxy for firm riskiness. It exhibits a negative coefficient, which is consistent with the univariate analysis of bond issuers characteristics in the previous sections, however it is not statistically significant.
Table 2: Determinants of bond Issuance Amounts.
PANEL A: Tobit Estimation PANEL B: Ordinary-Least Squares
(1) (2) (3) (1) (2) (3)
Baseline Baseline+ Risk I Baseline+ Risk II Baseline Baseline+ Risk
I Baseline+ Risk II Firm characteristics Age -0.888*** -0.891*** -1.014*** -0.089*** -0.091*** -0.098*** (0.000) (0.000) (0.000) (0.000) (0.001) (0.000) Size -2.185*** -2.155*** -2.344*** -0.306*** -0.306*** -0.312*** (0.000) (0.000) (0.000) (0.000) (0.000) (0.000) Listed -0.627* -0.910** -1.352** 0.015 -0.016 -0.025 (0.058) (0.025) (0.018) (0.759) (0.773) (0.687) Fixed Assets -0.824 -1.112 0.155 -0.088 -0.128 -0.056 (0.385) (0.185) (0.836) (0.311) (0.163) (0.552) Cash-Holding -5.295 -6.890 -3.864 -0.731 -0.822 -0.659 (0.237) (0.100) (0.439) (0.232) (0.169) (0.276) Growth 0.090*** 0.086*** 0.011*** 0.011*** (0.000) (0.000) (0.000) (0.000) Interest coverage -0.034 -0.004 (0.920) (0.939) Cash-flow 7.847*** 1.302*** (0.000) (0.008) Book Leverage 5.028*** 0.390*** (0.000) (0.009) Capex -4.475 -0.721 (0.497) (0.362) Fixed effects
Year Yes Yes Yes Yes Yes Yes
Country Yes Yes Yes Yes Yes Yes
Industry Yes Yes Yes Yes Yes Yes
Constant 32.895*** 33.322*** 27.670*** 4.459*** 4.505*** 3.805***
(0.000) (0.000) (0.000) (0.000) (0.000) (0.000) Observations 1,433 1,328 1,475 1,433 1,328 1,475 Pseudo R2 0.068 0.070 0.072
R-squared 0.348 0.348 0.375
Notes: This table reports the univariate estimate of bond terms where the dependent variable is the yearly total bond amount issuance over total assets. Panel A reports the Tobit estimates of the model; Panel B reports the ordinary-least squares estimates. Notice that in Panel B the dependent variable is the natural logarithm of the bond amount ratio (log normal model). All independent variables are lagged one period, definitions are reported in Annex B, p-value in parenthesis. Standard errors are clustered at country level. *, **, and *** denote significance at 10, 5 and 1%, respectively. Source: Bonds details are obtained from Dealogic DCM; firms characteristics are obtained from Moody’s BvD Orbis.
In column (3), we substitute Interest Coverage with Cash-Flow and Leverage. Cash-Flow is the ratio of operating cash-flow (EBIT plus depreciation) to assets; it captures the ability of the firm to generate cash out from operations and higher cash-flow indicates the financial sustainability of the firm. Leverage is a static indicator of the ability of the firm to absorb adverse shocks with no effects for creditors. Also we replace Growth with Capex, the Capital Expenditure; Capex measures the ability of the firm to invest and grow. Adding the three variables hardly alters the previously described effects of other variables. In this specification Capex is insignificant at standard levels both in Panels A and B. Instead, Cash-flow and Leverage have a positive and significant impact in all specifications. Thus, firms with larger leverage and cash-flow ratios, but lower interest coverage, issue larger bond amounts. Bond issuers thus generate larger amounts of cash, access to more debts, and likely due to these larger debt amounts pay more
19
interests (regardless of the interest rate), explaining why coverage ratio is lower. Thus, bond issuers not only have growth potential, but also quite strong repayment capacities. Our results complement those of Faulkender and Petersen (2006) who found that access to bond markets results in larger leverage ratios. In fact, creditworthiness may be a determinant of bond issuance, rather than access to bonds as such. This deserves further investigation.
3.2.2
Bond Maturities
In this section we investigate the determinants of the maturities of bonds issued by European firms. Debt maturity is relevant to our analysis as it captures several factors. On the one hand, maturity is the result of agency and information problems. Creditors require shorter term debt contracts for borrowing firms with little transparency. Yet, excessive short-term debt amounts result in higher risk that debt is not refinanced when comes the maturity debt, the so-called roll-over risk (e.g., Guedes and Opler, 1996; Diamond, 1991; Myers, 1977). As a result, the companies facing market requirements for too short term debt are likely to maintain bank relationships instead, since banks are further capable of screening and monitoring firms. On the other hands, debt maturities may be driven by investors demand and the latter varies over time (e.g., Vayanos and Vila, 2009; and Greenwood and Vayanos, 2010).
In this section we investigate the determinants of the maturities of bonds issued by European firms. We estimate Model [1] with maturity as the dependent variable. Firms usually issue bonds with tranches of different maturities and the relationship between debt maturity and some independent variables can be non-monotonic. Therefore, we estimate the determinants of maturities at the tranche level; in order to control for non-monotonicity, we use a multinomial logit specification in which the dependent variable is a categorical variable that classifies maturities less than 5 years, 5 to 9 years, 10 to 19 years, and 20 years or longer. The model specification is consistent with Guedes and Opler (1996). Explanatory variables are those in the model specification. Estimation results are reported in Table 3. Panel A reports the baseline model of the impact of the bond issuer’s characteristics on the bond tranche maturity. Because we suspect that other terms of the bonds may affect the impact of borrowers’ characteristics, Panel B reports estimates of the bond maturity model including bond terms at the tranche level. For instance, controlling for collateralization is more secured to creditors than the borrower holding fixed assets. Panels C and D report alternative specifications of the baseline model with risk controls. All the models include year, industry and country fixed effects.
20
Panel A in Table 3 shows that the impact of age is positive but insignificant on the likelihood that buckets with maturities longer than 5 years are selected. Size of the firm has a negative and statistically significant impact for issuing bonds in the buckets 5-10 years and 10-20 years, while for longer maturities (+20 years) the coefficient is not significant. The results provide mixed evidence of the asymmetric information hypothesis,17 which would predict that larger and older companies can afford longer
maturities.
Moreover, unlisted companies are less likely to issue in the longer maturity buckets however the result is not statistically significant. Fixed assets, which should capture the amount of assets that debtors may collateralize, has no impact in this model. Companies with larger cash-holding ratios issue at the higher end of maturities (20+ years), suggesting that cash-holding reduces short-term and liquidity risk of the bond issuer. Growth has a negative and highly statistically significant effect on the probability to issue bonds in the buckets 5-10 years and 10-20 years, meaning that higher growth companies have access to the shortest segment of debt. Together, these findings suggest that short-term segments, in which interest rates are lower, are more accessible to larger and growing companies.
Estimates in Panel B includes the following bond terms. Amount is the tranche amount which captures for potential market saturation. Two indicators Acquisition and Restructuring capture two purposes, namely acquisition and restructuring. Bonds aimed at acquisition are likely to bear longer terms maturities because acquisitions require time-lengthy combination of assets and synergies will need time to be effective. Restructuring is typically associated with longer maturities, which provide the debt issuer with longer periods to fix managerial issues. We also include two indicators of the existence of collateral and negative pledges. Collateral reduces the risk associated with bond; the negative pledge clause maintains seniority at par with subsequent debt issuance, and reduces the risk.18 We find that bonds in the mid-range, 5-10 years
maturity bucket, are less likely to be aimed at acquisitions,19 but more likely for
restructuring activities. Collateralized bonds are more likely to have longer maturities while the negative pledge has no impact.
17 The mixed results may also be due to a restricted group of companies issuing a wider range of debt maturities in the attempt to reduce the roll-over risk. This is consistent with the findings by Giannetti (2015). Using survey data of European firms, she studies the level of specialization of debt and finds that small and young firms have a more concentrated debt structure.
18 Negative pledge disallows bond issuers to grant equal or greater seniority on their assets to subsequently issued debt.
21
Table 3: Determinants of bond maturity.
PANEL A: Bond Maturity Model,
Baseline PANEL B: Bond Maturity Model, Baseline + Bond details PANEL C: Bond Maturity Model, Baseline + Bond details + Risk I PANEL D: Bond Maturity Model, Baseline + Bond details + Risk II 5-10
years 10-20 years years 20+ years 5-10 10-20 years years 20+ years 5-10 10-20 years years 20+ 5-10 years 10-20 years 20+ years Firm characteristics Age 0.040 0.047 0.211 0.001 -0.003 0.163 -0.012 -0.004 0.203 -0.027 -0.045 0.181 (0.071) (0.092) (0.231) (0.077) (0.109) (0.207) (0.067) (0.101) (0.171) (0.103) (0.141) (0.161) Size -0.465*** -0.409*** -0.223 -0.575*** -0.500*** -0.285* -0.551*** -0.496*** -0.217 -0.593*** -0.517*** -0.357*** (0.076) (0.121) (0.146) (0.070) (0.127) (0.150) (0.068) (0.119) (0.138) (0.081) (0.116) (0.108) Listed 0.026 -0.097 -0.118 0.014 -0.122 -0.141 -0.049 -0.173 -0.066 -0.106 -0.217 -0.177 (0.144) (0.206) (0.187) (0.160) (0.207) (0.217) (0.162) (0.163) (0.217) (0.197) (0.180) (0.253) Fixed assets -0.459 -0.142 0.954 0.033 0.308 1.368** -0.247 -0.045 0.758 -0.637** -0.294 0.989 (0.306) (0.296) (0.807) (0.313) (0.332) (0.695) (0.319) (0.386) (0.636) (0.315) (0.266) (0.808) Cash-Holding 0.077 0.692 4.532** 0.030 0.660 4.528** -0.290 -0.011 4.229* 0.017 0.381 3.307* (2.305) (1.737) (2.157) (2.537) (1.928) (2.143) (2.971) (2.380) (2.495) (2.111) (2.039) (1.912) Growth -0.021*** -0.024*** -0.336 -0.012*** -0.016** -0.472 -0.011** -0.014** -0.545 (0.006) (0.007) (0.338) (0.004) (0.007) (0.423) (0.005) (0.006) (0.504) Interest coverage -0.237*** -0.284** -0.668*** -0.353 -0.937 -5.785* (0.084) (0.117) (0.171) (1.787) (2.532) (3.069) Cash-flow -1.405*** -1.582*** -0.601 (0.254) (0.540) (0.586) Book Leverage -4.145 -0.033 -1.715 (2.548) (1.612) (4.913) Capex -4.145 -0.033 -1.715 (2.548) (1.612) (4.913) Bond details Amount 0.471*** 0.417*** 0.309*** 0.447*** 0.402*** 0.293*** 0.446*** 0.398*** 0.359*** (0.103) (0.072) (0.084) (0.101) (0.075) (0.085) (0.074) (0.041) (0.060) Acquisitions -0.511** -0.405 0.621 -0.618** -0.389 0.595 -0.168 -0.098 0.678 (0.235) (0.262) (0.470) (0.248) (0.301) (0.550) (0.256) (0.308) (0.475) Restructuring 0.900** 0.611 0.179 0.917** 0.636 0.184 0.792** 0.449 -0.123 (0.403) (0.545) (0.531) (0.455) (0.603) (0.571) (0.313) (0.450) (0.435) Collateralized 1.598** 1.414 1.670* 2.634*** 2.637*** 2.785*** 1.435** 1.293 1.653** (0.807) (0.982) (0.908) (0.881) (0.948) (0.706) (0.620) (0.839) (0.657) Negative pledge -0.049 -0.153 -0.190 -0.018 -0.132 -0.214 -0.098 -0.197 -0.182 (0.079) (0.143) (0.336) (0.093) (0.149) (0.328) (0.113) (0.201) (0.391) Constant 8.976*** 7.659*** 2.315 8.487*** 7.281*** 1.990 8.932*** 8.012*** 2.558 8.881*** 7.777*** 2.223 (1.504) (2.109) (3.217) (1.433) (2.085) (3.091) (1.559) (2.167) (2.645) (1.848) (1.861) (1.896) Observations 5,069 5,069 5,069 5,069 5,069 5,069 4,755 4,755 4,755 5,579 5,579 5,579 Pseudo-R2 0.139 0.139 0.139 0.162 0.162 0.162 0.170 0.170 0.170 0.165 0.165 0.165
Notes: This table reports the multinomial logit regressions predicting the maturity of the bond. Variables are defined in Annex B. All models include year, industry and country fixed effects. The coefficient baseline is for issues which have a maturity of 0-5 years. *, **, and *** denote significance at 10, 5 and 1%, respectively. Standard errors are clustered at country level. Source: Bonds details are obtained from Dealogic DCM; firms characteristics are obtained from Moody’s BvD Orbis.
22
Panels C and D add risk controls to the baseline model with bond details. The interest coverage has a negative and statistically significant impact (Panel C), suggesting that less risky companies are more likely to issue medium and long-term debt. Evidence is similar using alternative variables for risk, but coefficients are not always statistically significant (Panel D). Like growth, capex is negative and the impact is statistically insignificant.
Overall, companies with growth potential and the ability to repay have access to a larger spectrum of maturities, from short to very long-term debt. This is consistent with the previous evidence suggesting that some issuers access the bond market on a relatively frequent basis.
3.2.3
Bond Yields
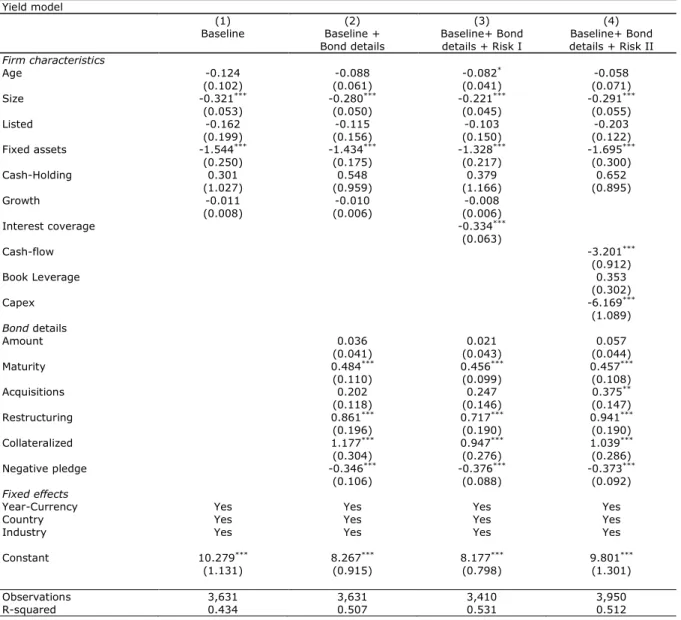
Finally, we use ordinary-least squares estimates to investigate the relationship between borrowing costs and firm characteristics. The results are reported in
Table 4. Column (1) reports the estimates of the baseline specification for Model [1]. Column (2) reports estimates of the baseline, controlling for the characteristics of the deals. Columns (3) and (4) control for risk factors as described in the previous sections. All the models include year-currency, country and industry fixed effects.
The results provide evidence of the relationship between firms’ characteristics and bond yields. First, firm size and the share of fixed assets have a negative impact on bond yields, at the 1% significance level in all four specifications. Age has a negative impact, significant only in column (3), at the 10% level. All three indicators reflect transparency; fixed assets may also capture the size of collateral. This is consistent with standard risk evaluation theories, which predict that the higher the transparency and the recovery rate, the lower the interest rates. The other firm variables have the expected signs but they do not reach statistical significance.
Adding bond characteristics to the Baseline Model (Column 2) does not alter the respective impacts of the firm’s characteristics. Debt Maturity and Restructuring have positive impacts, significant at standard levels. Two bond clauses that control for risk-taking after the bond is signed, namely Collateralized and Negative Pledge have significant impacts on bond yields, respectively positive and negative. Collateral aims at reducing risk but is against manager independence of decision. In fact, collateralized assets cannot be divested. Thus, worthier firms would rather avoid the collateralization of their assets, and collaterals proxy for riskier firms. The results are consistent with the hypothesis that riskier bonds should further remunerate bond-holders. The impacts of the deal characteristics are robust to the inclusion of riskiness indicators (columns 3 and
23
4). Higher Interest Coverage (column 3), and larger Cash Flows (column 4) have a negative impact on yields. The Growth proxy has a negative impact, but only Capex is statistically significant (column 4). The relationship between bond yield and firm characteristics were mostly in line with our expectations.
Table 4: Determinants of Bond Yields.
Yield model
(1) (2) (3) (4)
Baseline Baseline +
Bond details Baseline+ Bond details + Risk I details + Risk II Baseline+ Bond Firm characteristics Age -0.124 -0.088 -0.082* -0.058 (0.102) (0.061) (0.041) (0.071) Size -0.321*** -0.280*** -0.221*** -0.291*** (0.053) (0.050) (0.045) (0.055) Listed -0.162 -0.115 -0.103 -0.203 (0.199) (0.156) (0.150) (0.122) Fixed assets -1.544*** -1.434*** -1.328*** -1.695*** (0.250) (0.175) (0.217) (0.300) Cash-Holding 0.301 0.548 0.379 0.652 (1.027) (0.959) (1.166) (0.895) Growth -0.011 -0.010 -0.008 (0.008) (0.006) (0.006) Interest coverage -0.334*** (0.063) Cash-flow -3.201*** (0.912) Book Leverage 0.353 (0.302) Capex -6.169*** (1.089) Bond details Amount 0.036 0.021 0.057 (0.041) (0.043) (0.044) Maturity 0.484*** 0.456*** 0.457*** (0.110) (0.099) (0.108) Acquisitions 0.202 0.247 0.375** (0.118) (0.146) (0.147) Restructuring 0.861*** 0.717*** 0.941*** (0.196) (0.190) (0.190) Collateralized 1.177*** 0.947*** 1.039*** (0.304) (0.276) (0.286) Negative pledge -0.346*** -0.376*** -0.373*** (0.106) (0.088) (0.092) Fixed effects
Year-Currency Yes Yes Yes Yes
Country Yes Yes Yes Yes
Industry Yes Yes Yes Yes
Constant 10.279*** 8.267*** 8.177*** 9.801***
(1.131) (0.915) (0.798) (1.301)
Observations 3,631 3,631 3,410 3,950
R-squared 0.434 0.507 0.531 0.512
Notes: This table reports the model of bond yield. In all specifications, the dependent variable is the bond yield at issuance. Explanatory variables are defined in Annex B. All specifications include Year-Currency, Industry, and Country fixed effects, and standard errors are clustered at country level. *, **, and *** denote significance at 10, 5 and 1%, respectively. Source: Bonds details are obtained from Dealogic DCM; firms characteristics are obtained from Moody’s BvD Orbis.
24
4
Conclusions
This report investigates the characteristics of the European bond issuing non-financial companies. There are three takeaways.
First, time trend graphics show that the crisis has a significant impact in the bond market leading to a contraction on the amount issued and shortening the bond maturity. After the crisis, the debt markets have shown some positive developments, with even riskier companies issuing large amounts.
Second, the univariate analysis shows that the determinants of bond issuers are significantly similar whether we look at the full sample, the sample of large firms, or the sample of listed firms. A major exception lies in leverage ratios. Access to bond markets is traditionally considered to reduce debt market frictions. Both further information provision and the existence of market prices decrease information asymmetries issues. As a result, previous studies find evidence that bond issuers hold larger leverage ratios. Remarkably, we find the same result in our sample of listed companies, while it is significantly smaller in the full sample of companies. This deserves further investigation. Last, we conduct a multivariate analysis of the determinants of bond terms. We define bond terms alternatively as the total amount of bonds issued in a year to assets, the maturity of the bonds, and the bond yield. The results suggest that some of the features that were determinants of being a bond issuing company, e.g., age and size, have a negative impact on bond amounts. Relationship between firm variables and maturities is non-linear thus larger companies are likely to have more balanced maturity term structures of bonds, which allows them to issue smaller yearly amounts on average. Instead, smaller companies, which face fixed issuing cost that are larger compared to their assets, issue new bonds on a less frequent basis. Unbalanced term structure of debt may trigger major problems in times of financing disruption.
25
References
[1] Adrian, T., Colla, P., and Shin, H. S., (2012). Which Financial Frictions? Parsing the Evidence from the Financial Crisis of 2007-9. National Bureau of Economic Research 2012/8/31.
[2] Altumbas, Y., Kara A., and Marques-Ibanez, D., (2010). Large debt financing: syndicated loans versus corporate bonds. European Journal of Finance, 16, 437-458.
[3] Bacchetta, P., and Merrouche, O., (2015). Global financial crisis and foreign currency borrowing. Swiss Institute Working paper.
[4] Bedendo, M., and Colla, P., (2015). Sovereign and corporate credit risk: Evidence from the Eurozone. Journal of Corporate Finance, 33, 34-52.
[5] Boeri, T., and Jimeno, J. F., (2016). Learning from the Great Divergence in unemployment in Europe during the crisis. Labour Economics, 41, 32-46.
[6] Campolongo, F., Cariboni, J., Hallak, H., and Rancan, M., (2016). Cash-Holding and Debt Issuance. Joint Research Centre Working Paper.
[7] Choi, J., Hackbarth, D., and Zechner, J., (2014). Granularity of Corporate Debt. Boston University Working Paper.
[8] Cour-Thimann, P., and Winkler, B., (2012). The ECB’s non-standard monetary policy measures: the role of institutional factors and financial structure. Oxford Review of Economic Policy, 28, 765-803.
[9] De Almeida, L., and Masetti O., (2015). Corporate Debt Substitutability and the Macroeconomy: Firm-Level Evidence from the Euro Area. Working paper.
[10] Diamond, D. W., (1984). Financial Intermediation and Delegated Monitoring. Review of Economic Studies, 51, 393-414.
[11] Erel, I., Julio, B., Kim, W., and Weisbach, M. S., (2012). Macro-economic Conditions and Capital Raising. Review of Financial Studies, 25, 341-376.
[12] European Central Bank, (2016). Financial Stability Review (November).
[13] European Commission, (2015). Action Plan on Building a Capital Markets Union, Accompanying Document. Staff Working Document 2015.183, Brussels, 30.9.2015. [14] Faulkender, M., and Petersen, M. A., (2006). Does the Source of Capital affect