Institute for Public Policy Research Guy Lodge,
Graeme Henderson and Bill Davies
January 2015 © IPPR North 2015 REPORT
POVERTY
AND
DEVOLUTION
THE ROLE OF
DEVOLVED GOVERNMENTS
IN A STRONG NATIONAL
ABOUT IPPR NORTH
IPPR North is IPPR’s dedicated thinktank for the North of England. With its head office in Manchester and representatives in Newcastle, IPPR North’s research, together with our stimulating and varied events programme, seeks to produce innovative policy ideas for fair,
democratic and sustainable communities across the North of England. IPPR North specialises in regional economics, localism and
community policy. Our approach is collaborative and we benefit from extensive sub-national networks, regional associates, and a strong track record of engaging with policymakers at regional, sub-regional and local levels.
IPPR North
2nd Floor, 3 Hardman Square Spinningfields, Manchester M3 3EB T: +44 (0)161 457 0535
E: [email protected] www.ippr.org/north
Registered charity no. 800065
This paper was first published in January 2015. © 2015
The contents and opinions expressed in this paper are those of the author(s) only.
IDEAS
to
CONTENTS
Summary ...3
1. Introduction ... 12
2. Changing patterns of poverty in the nations and regions of the UK ... 14
2.1 Overall poverty ... 14
2.2 Child poverty ... 16
2.3 Pensioners ... 19
2.4 Key drivers of poverty ... 21
2.5 Summary: a picture of poverty across the UK ... 32
3. Poverty reduction strategies in the devolved nations ... 33
3.1 Wales ... 33
3.2 Northern Ireland ... 38
3.3 Scotland ... 42
4. Devolving welfare ... 46
4.1 The case for greater welfare devolution ... 46
4.2 Devolving specific benefits ... 48
4.3 Devolving housing benefit ... 52
4.4 Devolving employment support and the Work Programme ... 53
4.5 Welfare ‘top-up’ ... 54
5. Conclusions: Devolving welfare functions within a strong national social security system ... 56
ABOUT THE AUTHORS
Guy Lodge is associate director for politics and power at IPPR.
Graeme Henderson was a senior research fellow at IPPR North, at the time this report was
written.
Bill Davies is a research fellow at IPPR North.
ACKNOWLEDGMENTS
This research was carried out as part of a comprehensive programme of evidence-based reviews on poverty in the UK conducted by the Joseph Rowntree Foundation. A summary of all 33 reviews can be found here: http://www.jrf.org.uk/publications/reducing-poverty-in-the-uk-evidence-reviews
The authors would like to thank Katie Schmuecker at the Joseph Rowntree Foundation for her support with this research.
Download
This document is available to download as a free PDF and in other formats at:
http://www.ippr.org/publications/poverty-and-devolution-the-role-of-devolved-governments-in-a-strong-national-social-security-system
Citation
If you are using this document in your own writing, our preferred citation is:
Lodge G, Henderson G and Davies B (2015) Poverty and devolution: The role of devolved governments in a strong national social security system, IPPR North. http://www.ippr.org/
publications/poverty-and-devolution-the-role-of-devolved-governments-in-a-strong-national-social-security-system
Permission to share
This document is published under a creative commons licence: Attribution-NonCommercial-NoDerivs 2.0 UK
http://creativecommons.org/licenses/by-nc-nd/2.0/uk/
For commercial use, please contact [email protected]
SUMMARY
Background
The devolved administrations exercise considerable autonomy when it comes to tackling poverty: for instance, major areas of economic development, education, health and housing policy are the responsibility of the devolved institutions. Moreover, the devolved bodies have complete autonomy over how they allocate their budgets. For these reasons devolution has resulted in some notable policy differences across the nations of the UK and the degree of policy innovation in respect of anti-poverty measures has continued since the Joseph Rowntree Foundation (JRF) published its review in 2010 (McCormick and Harrop 2010). However, in other respects the devolved administrations remain significantly constrained: most obviously social security is not devolved – other than to a limited extent in Northern Ireland – and since welfare policy1 has a significant role in tackling poverty, it is clear that anti-poverty measures in the nations of the UK depend on a mix of UK and devolved policy interventions.
The current division of powers between the devolved institutions and the UK government is in a state of flux. Following the Scottish independence referendum and the subsequent Smith Commission, the powers of the Scottish parliament will be increased considerably. In particular, the parliament’s revenue powers are likely to be strengthened (above and beyond those set out in the Scotland Act 2012) and it will also acquire powers over the ‘redistributive’ aspects of policy with control over certain benefits devolved.
Devolution in Wales is also particularly fluid: the Welsh assembly gained primary legislative powers2 following the 2011 referendum and is set to gain new devolved areas and stronger fiscal powers on the back of the Silk Commission. The
devolution debate in Northern Ireland is less prominent and has focussed on the ability to cut certain taxes to aid the province’s competitiveness but opposition to welfare reform is growing across the assembly divide.
In this context, this report has two broad aims: first, to assess the impact of recent and current anti-poverty strategies pursued by the devolved administrations, including taking account of the interaction between devolved and reserved powers that affect poverty reduction; and second, to highlight whether there is the potential for further empowering the devolved institutions in their efforts to reduce poverty. In particular the report will:
• assess variations in levels of poverty across the UK, focussing particularly on the period since 2010 and the impact of the economic downturn, and on child poverty, pensioner poverty and important cost of living issues
• consider how different approaches to tackling poverty have varied across the UK in recent years and assess the appetite in the various devolved institutions for further devolution to enhance their efforts to reduce poverty
• address the case for the further devolution of a limited number of benefits with a view to strengthening the capacity of the devolved nations to tackle poverty.
1 Both social security payments and wider social assistance provision.
2 This means that the Welsh assembly can now pass laws on all devolved matters without first needing the agreement of the UK parliament.
Patterns of poverty in the nations and regions of the UK
The nations of the UK have seen significant decreases in headline levels of poverty over the past two decades, particularly in the years before the economic downturn. Since 2007, the path of poverty in the nations of the UK has shifted: from a general picture of falling poverty levels, to a more nuanced one. Poverty levels in England have resumed their gradual downward path, while the lowest levels of poverty in the UK, found in Scotland, have stabilised in the last three years. In Wales and Northern Ireland, increases in poverty have been more marked, but in the former they appear to have stabilised, while in the latter they appear to be falling again.
Figure 1
Share of households living below 60 per cent median income (relative poverty), after housing costs 0% 5% 10% 15% 20% 25% 30% 10/11–12/13 09/10–11/12 08/09–10/11 07/08-09/10 06/07–08/09 05/06–07/08 04/05–06/07 03/04–05/06 02/03–04/05 01/02–03/04 00/01–02/03 99/00–01/02 98/99–00/01 97/98–99/00 96/97–98/99 95/96–97/98 94/95–96/97 England Scotland Wales Northern Ireland Source: DWP 2014a
Furthermore, the most recent data shows a return to a degree of convergence between England and Northern Ireland (with 21 per cent and 20 per cent, respectively, of individuals living in households of 60 per cent or below median incomes after housing costs). Meanwhile, the data shows the gap between the highest (Wales at 23 per cent) and lowest rates (Scotland at 18 per cent) had grown to five percentage points – the widest difference since 2006.
These headline figures mask a series of other important characteristics about the nature of poverty in the nations and regions.
There are significant differences between the UK nations before and after housing costs are taken into account. The highest levels of poverty are found in Northern Ireland before housing costs and in Wales after housing costs. Yet, the extent of housing cost-induced poverty is most evident in England, where the share of the population living in poverty increases most once housing costs are taken into account. According to Tunstall et al (2013), the English housing market has typically higher rents and house prices than the other parts of the UK, with England affected the most by housing cost-induced poverty: that is, a six percentage point difference
in poverty levels before and after housing costs are included. The most marked jumps in poverty are evident in the most expensive parts of the housing market, such as in London, while the lowest rises in housing cost-induced poverty are found in the more affordable housing markets of Wales and the North East of England. This is in large part due to a failure of policy in coping with housing demand pressures in England, particularly in London and the South East (Bailey 2014). Child poverty before housing costs has continued to fall across all nations even in the years since the economic downturn, with England and Scotland experiencing the most significant falls. However, after housing costs are taken into account, rates of child poverty have increased in Wales and Northern Ireland since the recession. In Wales, child poverty after housing costs is now at 31 per cent, the same position as it was a decade earlier. Recent research by the Institute of Fiscal Studies (IFS 2014) suggests, however, that child poverty is set to rise across all the nations by 2020 as a result of reductions to social security support.
There have been some dramatic reductions in pensioner poverty both before and after the recession. Unlike other measures of poverty, the poverty levels among pensioners are lower after housing costs than before. This is because people of pensionable age often have very low housing costs: many will own their homes outright, and for those that do not, pensioners represent a significant share of social housing tenants, where rents are much lower than in the private market (which is more likely to be inhabited by younger age-groups). Falls in pensioner poverty have also been more uniform across the nations due in large part to the fact that the state pension remains within the remit of the UK government.
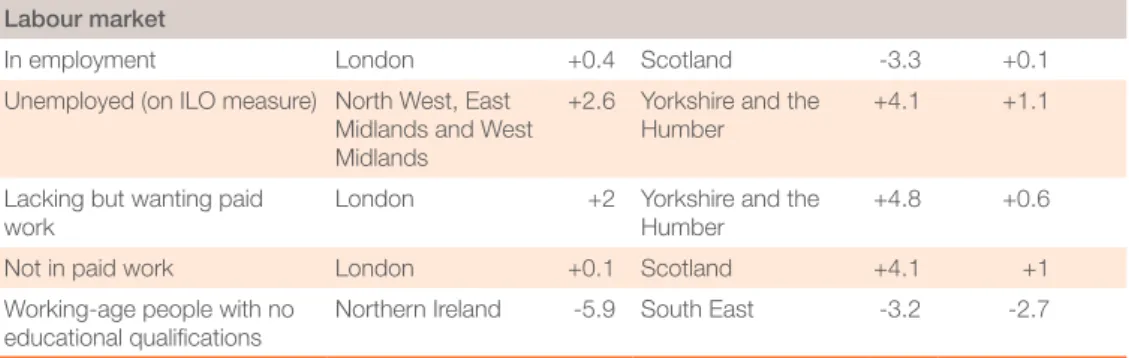
It is also possible to compare changes in the devolved nations with data for the English regions. Table 1 shows those areas that appear to have improved most and least since the recession. It also shows the changing gap between the best and the worst areas.
Table 1
Poverty and exclusion indicators: most/least improved parts of UK and changing gap between best/worst (2008–2013)
Indicator Best Worst
Change in gap between best
and worst, 2008–2013
Poverty
Total living in poverty, before
housing costs North East, North West, East Midlands -4 Northern Ireland 0 -1 Total living in poverty, after
housing costs North East -4 Northern Ireland 1 0
Children in poverty, before
housing costs East Midlands -10 South East -2 -4
Children in poverty, after housing costs
North East and West Midlands
-7 South East, Wales, and Northern Ireland
-1 +1
Pensioners in poverty, before
housing costs North East -10 South East -2 1
Pensioners in poverty, after
housing costs North East -8 West Midlands and South East -1 0 Working-age people in
poverty, before housing costs East Midlands and West Midlands -2 Northern Ireland +3 -1 Working-age people in
Labour market
In employment London +0.4 Scotland -3.3 +0.1
Unemployed (on ILO measure) North West, East Midlands and West Midlands
+2.6 Yorkshire and the Humber
+4.1 +1.1
Lacking but wanting paid work
London +2 Yorkshire and the
Humber
+4.8 +0.6
Not in paid work London +0.1 Scotland +4.1 +1
Working-age people with no
educational qualifications Northern Ireland -5.9 South East -3.2 -2.7 Source: DWP 2014a; Nomis 2014a, 2014b
Drivers of poverty and the costs of living
This report examines the differences between UK nations across a range of drivers of poverty as well as the costs of living.
Workless households have a particularly high risk of poverty. As such, levels of unemployment and economic inactivity are important. Looking first at
unemployment, levels have all increased but have been remarkably similar between nations and track each other quite closely over time.
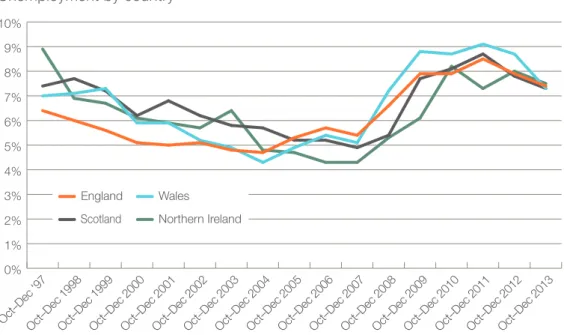
Figure 2 Unemployment by country 0% 1% 2% 3% 4% 5% 6% 7% 8% 9% 10% Oct–Dec 2013 Oct–Dec 2012 Oct–Dec 2011 Oct–Dec 2010 Oct–Dec 2009 Oct–Dec 2008 Oct–Dec 2007 Oct–Dec 2006 Oct–Dec 2005 Oct–Dec 2004 Oct–Dec 2003 Oct–Dec 2002 Oct–Dec 2001 Oct–Dec 2000 Oct–Dec 1999 Oct–Dec 1998 Oct–Dec ‘97 England Scotland Wales Northern Ireland Source: Nomis 2014b
Note: Unemployment is by the ILO measure
That the levels of unemployment in each nation appear so closely synchronised is profoundly important for the devolved nations’ poverty strategies. This similarity suggests that there is a high level of linkage between national and regional economies within the UK and so the ability of devolved nations to control overall
levels of poverty is contingent on the wider macroeconomic context in the UK, as well as the wider international economic context.
The higher median earnings in England compared to Wales and Northern Ireland have remained in place over the past decade. Scotland, by contrast, has improved its relative position and closed the gap with England.
Median household income – which includes benefit entitlements and income from multiple family members in a household – shows a similar divergence between the two pairs of nations of Scotland and England enjoying similar, higher income, and Wales and Northern Ireland following similar, lower paths. However, unlike earnings, it shows a significant downturn for all four nations, particularly since cuts to benefit entitlements and stagnant earnings in the past two to three years. Real household incomes in Northern Ireland are now lower than they have been in a decade. Both earnings and income need to be understood alongside the cost of living in each of the devolved nations, as lower income in an area where the cost of living is lower may be considered less of a challenge. Work by the ONS in Autumn 2010 illustrated the different cost of living pressures in each of the nations, identifying generally higher prices across essential household items where earnings were higher (England and Scotland) and lower prices where earnings were lower (Wales and Northern Ireland) (ONS 2010). The differences between the nations were small, with Northern Ireland costs around 3 per cent less than the UK average, but the regional differences in the basket of goods varied more widely by region, with (not including housing costs) London prices around 10 percentage points higher than in Yorkshire. Further breakdowns across the four nations of the UK illustrate some small, but significant differences across core items of expenditure.
Within this general picture, we considered the constituent parts of household expenditure across a range of different goods and services. Patterns of household expenditure are relatively similar between nations, again reflecting a high degree of homogeneity across the union. There are, however, some important differences: for example, expenditure on transport and food are both highest in Scotland; expenditure on recreation and culture is highest in Wales; and while housing represents a much smaller proportion of outgoings in Northern Ireland than elsewhere, spending on fuel, clothing and shoes is higher, which could be seen to have a greater impact on poorer households.
Housing cost pressures are clearly very important when considering household poverty, although some of their effects can be highly localised and dependent upon tenure. Much of the pressure on the poorest households is currently absorbed through rent subsidies in the form of housing benefit which, more recently, is being squeezed significantly. While the devolved nations have quite distinct housing markets, and substantial policy powers to affect their housing markets, the revenue aspect of government spending on housing, perhaps most able to affect poverty, remains held at Westminster.
Poverty reduction strategies in the devolved nations
Each of the devolved nations has taken different approaches to tackling poverty. These have very often been influenced by political and institutional arrangements. Our analysis has also considered the appetite in each nation for further devolution to enhance efforts to reduce poverty. We discuss the key themes that emerged from this analysis below.
Prevention: Each of the devolved nations is moving towards an increased emphasis on early years action and early intervention within public services. Early years interventions are a particular cornerstone of the Welsh anti-poverty strategy including through its Flying Start programme. By contrast, despite steps in the right
direction through its Delivering Social Change framework, much more remains to be done on this issue in Northern Ireland, especially to better integrate early years and childcare provision.
Economic development: The Scottish government has played a role in driving economic development through successful inward investment initiatives, supporting threatened jobs and building the skills base. Wales’ flagship programme in this area is Jobs Growth Wales. While relatively small, it does appear to be having some success. In Northern Ireland, however, economic and social policy strategies have been less linked, and economic policy prioritised over social policy.
Cost reduction and universalism: Each of the devolved nations has brought in measures to assist with the costs of living. For instance, free prescriptions, some free care for the elderly in Scotland and Northern Ireland, and reduced tuition fees. These policies have the potential to assist the poorest but they are neither well targeted, nor necessarily the most effective use of limited resources. Free prescriptions may be politically popular, but their costs are not a substantial element of the outgoings of many low-income people.
In recognition of high levels of fuel poverty, the Northern Ireland administration gave more than 250,000 people a one-off fuel allowance payment at the start of 2012 following one of the severest winters in recent years. Neither Wales nor Scotland would have been able to introduce a similar measure.
Mitigation: The Northern Irish and Scottish governments have made significant attempts to mitigate the welfare reforms enacted by Westminster. In Scotland this included establishing a £20 million emergency fund to mitigate the problems associated with the so-called bedroom tax. The Northern Ireland government, meanwhile, has secured agreement from the Treasury allowing it to deviate from the rest of the UK by waiving the benefit reductions for existing tenants imposed by the bedroom tax – though it still applies to new tenants. One of the main drivers behind the deal was that Northern Ireland does not have enough smaller dwellings to meet demand. Scotland has been envious of Northern Ireland’s ability to negotiate over the bedroom tax. Both Scotland and Wales have also maintained a full council tax rebate for low-income families, meeting the costs from their block grant.
Institutional approaches to tackling poverty: Compared to the other devolved nations of the UK, and the Westminster government, Wales arguably has the strongest and most explicit institutional commitment to tackling poverty, including leadership at the highest level and a coordinated, cross-government action plan. The Welsh and Scottish administrations and Whitehall have also each appointed a set of external experts to support and critique their anti-poverty strategies.
Disconnect between reserved and devolved powers
There was evidence of a number of disconnects, and even clashes, between devolved and reserved powers. For instance, Scotland’s decision to spend some of its block grant on mitigating the impacts of the bedroom tax because it was powerless to not implement it. This means less funding for other priorities. A more fundamental clash has arisen due to a legal interpretation of European social funding rules, with Work Programme participants being unable to participate in certain devolved employment support programmes due to double-funding issues. Another example is that while the devolved nations have quite distinct housing markets, and substantial policy powers to affect their housing markets, the revenue aspect of government spending on housing, perhaps most able to affect poverty, remains held at Westminster.
Devolving welfare
There is, however, one key dimension of poverty alleviation where, at present, powers are largely held in Westminster, but where there might be more scope for greater devolution: the social security system. Exceptionally, Northern Ireland has power over social security although it has to meet additional costs resulting from deviation from the rest of the UK and there has been little variation to date. While there is a strong case for devolving control of distributive public services because the devolved institutions are best placed to ensure these services most effectively reflect local preferences and meet local conditions, it is normally held that redistributive functions – which entail the transfer of resources from one section of the people to another – are best exercised at the UK level.
The UK government can draw on a wider tax base than can the individual nations to fund redistribution, and social security in this sense is a form of risk pooling. There is a clear economic logic for the nations of the UK coming together to pool risks and share financial resources across the largest possible area as possible. Economic shocks tend to be asymmetric, affecting individuals and places in different ways and at different times, and sharing resources reduces exposure to such risks. Equally, different parts of the country vary demographically, which creates different pressures over time on welfare benefits – Scotland, for instance, is ageing more quickly than other parts of the UK. For these reasons social security is seen as one of the major automatic stabilisers used to manage macroeconomic risk and federal and decentralised systems around the world have similar arrangements.
However, this is not to suggest that there is no role for the devolved governments in social security. In Canada, for example, employment insurance is a Canada-wide scheme, though its rules vary regionally (allowing for seasonal patterns of employment in Atlantic Canada). Examples from overseas also illustrate how policy innovations which emerge in one unit of government are then taken up more widely. This has been the case in Canada, particularly, where childcare, healthcare and pension policies all started as initiatives in one province (Saskatchewan (health) and Quebec (childcare and pensions)) before becoming much more widely adopted and supported by the federal government. As Béland and Lecours (2007) point out, the positive example of a policy innovation by one government can affect others, and so can create a different sort of policy competition; in effect, it can drive a race to the top rather than to the bottom. For this reason, it can be argued that some aspects of welfare devolution would strengthen the ability of different policies adopted by devolved governments to act as examples for the UK as a whole.
In order to assess which benefits might be best transferred to devolved
governments, a number of criteria were developed, against which different benefits could be considered. Criteria included whether a benefit was cyclical in nature; how it might relate to, or overlap with, existing devolved functions; how far it might be ‘place-related’; and whether it is particularly redistributive or contributory in nature. These criteria ruled out a large number of benefits, including old-age pensions and national insurance due to their contributory nature, and jobseeker’s allowance and working tax credits which are largely cyclical in nature. However, there is a more compelling case for devolving the following three dimensions of the welfare system.
1. Attendance allowance: A benefit paid to those over-65s with a disability in order to help them at home and in their community. This overlaps with devolved health and social care functions and attempts to ensure older people with a disability are not living in poverty.
2. Housing benefit: Poverty data shows that housing costs are a key
component of household expenditure and could have a significant bearing on tackling household poverty. Housing benefit is self-evidently a place-related benefit and already varies by place to take account of local market conditions as well as being locally administered. And yet devolved governments cannot control how these rent subsidies are prioritised or applied to address local housing conditions. If housing benefit was devolved, it is argued that devolved administrations could better plan and target investment in affordable housing. Over the long run this could increase the supply of affordable housing and reduce government expenditure on subsidising private rented accommodation. It would, however, require housing benefit to be removed from universal credit.
3. Employment support: Although not a ‘benefit’ as such, active labour market programmes form a key part of the social security system and call for the joining up of a range of areas of government action. In recent times, the Work Programme has been a key plank of government policy to move people from reliance on welfare payments and into paid employment, but this has been administered from the centre through private sector ‘black-box’ contracts, which has led to the devolved administrations substituting it with their own more bespoke approaches. The Work Programme has had some significant problems in most places but the fact that getting people back to work – especially those furthest from the labour market – requires a joined-up approach across agencies necessitates that it should now be devolved. An alternative approach to devolving individual benefits would be to enable devolved governments to supplement UK benefits in those instances where they see a case for doing so (for instance, where local circumstances make it beneficial to do so). Any top-up would have to be funded exclusively from devolved budgets. In this approach the level of benefits set by the UK government would serve as a floor, but not a ceiling, for devolved welfare. The UK government’s tax bases would serve to cover the financial heavy lifting of providing the bulk of welfare benefits in a way that remained common to all parts of the UK. The upshot would be that devolved governments would be able, within the overall framework of UK policy, to choose their own distinct approach to social policy, using cash benefits as well as other policy levers, provided they bore the burden of paying for their decisions.
Conclusion
Headline levels of poverty across all four UK nations fell significantly until the economic downturn, but since then a more mixed picture has emerged, particularly in Wales and Northern Ireland. In addition, households have seen their costs of living rising while incomes have been hit hard by low wages, suppressed wage increases and reductions in social security benefits. Different costs affect different nations in different ways with higher prices generally in England and Scotland than in Wales and Northern Ireland, but higher incomes as well. These overall trends have much to do with prevailing national and international economic conditions and insofar as they can be influenced at all, the devolved nations have many powers over economic development within their immediate control. But each of the devolved nations has also taken its own steps to target particular dimensions of poverty and develop anti-poverty strategies that address their own needs. While it is clear that policies in recent years have gone some way to mitigating certain impacts of welfare reform – and benefit reductions in particular – it is not clear how far these plans can be seen to have mitigated poverty in general. In part, this is because some of the key factors in poverty alleviation still sit at the centre, not least social security matters.
There is a clear case for retaining a strong welfare state. The redistributive functions of government require pooling risk across the largest possible area to
insure against the asymmetrical impact of economic shocks. And so for many aspects of the social security system – particularly for cyclical and contributory benefits – the role of central government will remain paramount. But this is not to say that there is no role for the devolved governments in social security. On the contrary, for the place-related housing benefit, for active labour market programmes, and for certain social care payments, there is a strong case for further devolution as a means of giving devolved nations more tools to tackle the tide of poverty which is slowly rising again.
1.
INTRODUCTION
The devolved administrations exercise considerable autonomy when it comes to tackling poverty: for instance, major areas of economic development, education, health and housing policy are the responsibility of the devolved institutions. Moreover, the devolved bodies have complete autonomy over how they allocate their budgets. For these reasons devolution has resulted in some notable policy differences across the nations of the UK. The degree of policy innovation in respect of anti-poverty measures has continued since the Joseph Rowntree Foundation (JRF) published its review in 2010, the year in which for the first time since devolution different political parties have been in power in London, Edinburgh, Cardiff and Belfast.
However, in certain respects the devolved administrations remain significantly constrained: most obviously social security is not devolved (other than to a limited extent in Northern Ireland). Since welfare policy has a significant role in tackling poverty, it is clear that anti-poverty measures in the nations of the UK depend on a mix of UK and devolved policy interventions. For instance, the devolved governments are responsible for most aspects of policy relating to children and elderly people, but the cash benefits that cover these groups are determined and set by the UK government. Housing policy is devolved but control over housing benefit – a major policy lever – is reserved.
The current division of powers between the devolved institutions and the UK government is in a state of flux. Following the Scottish independence referendum and the subsequent Smith Commission, the Scottish parliament’s revenue powers are likely to be strengthened (above and beyond those set out in the Scotland Act 2012) and it will also acquire powers over the ‘redistributive’ aspects of policy with control over certain benefits devolved.
Devolution in Wales is also particularly fluid: the Welsh assembly gained primary legislative powers3 following the 2011 referendum. It has also gained new devolved areas and stronger fiscal powers on the back of the Silk Commission whose proposals have recently been incorporated in the Wales Act 2014. The devolution debate in Northern Ireland is less prominent and has focussed on the ability to cut certain taxes to aid the province’s competitiveness.
In this context, this report has two broad aims: first, to assess the impact of recent and current anti-poverty strategies pursued by the devolved administrations, including taking account of the interaction between devolved and reserved powers that affect poverty reduction; and second, to highlight whether there is the potential for further empowering the devolved institutions in their efforts to reduce poverty. Chapter 2 assesses variations in levels of poverty across the UK, focussing on the period since 2010 and the impact of the economic downturn, and on child poverty, pensioner poverty and important cost of living issues.
Chapter 3 considers how different approaches to tackling poverty have varied across the UK in recent years and assesses the appetite in the various devolved institutions for further devolution to enhance their efforts to reduce poverty. This is based on desk-based research and a dozen semi-structured interviews in each of
3 This means that the Welsh assembly can now pass laws on all devolved matters without first needing the agreement of the UK parliament.
the devolved nations with senior civil servants, academics and other local experts including within the voluntary and community sector.
Chapter 4 places particular focus on welfare benefits and presents the case for the further devolution of a limited number of benefits with a view to strengthening the capacity of the devolved nations to tackle poverty, summarised in chapter 5.
2.
CHANGING PATTERNS OF
POVERTY IN THE NATIONS AND
REGIONS OF THE UK
This chapter considers some of the most recently available data concerning indicators of poverty in the UK and the changing patterns of poverty between the four nations, particularly since the economic recession in 2007/8. It goes on to look at some of the main drivers of these patterns, including employment and unemployment rates, earnings and incomes, and housing and other costs of living.
2.1 Overall poverty
Levels of poverty in the nations of the UK are most commonly measured using the households below average income (HBAI) data within the Family Resources Survey. These are illustrated in regular accounts of poverty and devolution by the Joseph Rowntree Foundation, and are used to monitor progress against UK child poverty objectives.
The HBAI data depicts a range of variables, including household types, age and location. The most common measure of poverty used in the UK is the proportion of whole population in households where the income is at 60 per cent or below the median income. Figure 2.1 shows the breakdown, by nation, of the whole population living in households with an income below 60 per cent of the median. Figure 2.1
Percentage of individuals living in households with less than 60 per cent of median household income by country, before and after housing costs
Before housing costs After housing costs 0% 5% 10% 15% 20% 25% Northern Ireland Scotland Wales England Source: DWP 2014a
Before housing costs are taken into account, the data reveals substantial variance between the individual nations. Perhaps predictably given the longstanding difficulties with the Northern Irish economy, the highest levels of poverty are found in Northern Ireland, where 20 per cent of the population are classified as living in poverty. The lowest rates of poverty are to be found in England and Scotland, where before housing is taken into account 15 per cent of the population live in poverty. Given that housing is a core part of household expenditure, the bars on the right of figure 2.1 show poverty levels once housing costs are taken into account. The impact is to shift poverty levels significantly upwards.4 The addition of housing costs changes the depiction of poverty in the nations of the UK, where the higher housing costs of England and Wales push poverty levels in both cases higher than in
Northern Ireland. Rents are a substantial push factor, where households in England and Wales pay more in rent than their Northern Irish and Scottish compatriots (ONS 2013). The relative scale of the costs of housing to English households, through both higher rents and higher mortgage interest payments helps to explain the larger impact of the after housing costs (AHC) calculation on them than on the other nations of the UK.
Looking at change over time, figure 2.2 shows that overall poverty levels (measured as below 60 per cent median income, after housing costs) fell significantly in the years before the economic downturn. Since 2007, the path of poverty in the nations of the UK has shifted. Poverty levels in England have resumed their gradual downward path, while the lowest levels of poverty in the UK, found in Scotland, have stabilised in the last three years. In Wales and Northern Ireland, increases in poverty have been more marked. In the former they appear to have stabilised, and in the latter they appear to be falling again.
Figure 2.2
Share of households living below 60 per cent median income (relative poverty), after housing costs 15% 17% 19% 21% 23% 25% 27% 29% 10/11 –12/1 3 09/10 –11/1 2 08/09 –10/1 1 07/08 –09/1 0 06/07 –08/0 9 05/06 –07/0 8 04/05 –06/0 7 03/04 –05/0 6 02/03 –04/0 5 01/02 –03/0 4 00/01 –02/0 3 99/00 –01/0 2 98/99 –00/0 1 97/98 –99/0 0 96/97 –98/9 9 95/96 –97/9 8 94/95 –96/9 7 England Scotland Wales Northern Ireland Source: DWP 2014a
4 The additional impoverishment caused by housing costs is referred to as housing cost-induced poverty (Tunstall et al 2012).
Furthermore, the most recent data shows a return to a degree of convergence between England and Northern Ireland (with 21 per cent and 20 per cent, respectively, of individuals living in households of 60 per cent or below median comes after housing costs), while the gap between the highest (Wales at 23 per cent) and lowest rates (Scotland at 18 per cent) has grown to five percentage points – the widest difference since 2006.
Variations also exist within each of the nations. Looking at the regions of England, predictable patterns emerge.
Figure 2.3
Percentage of population in poverty, by English region (2013)
0% 5% 10% 15% 20% 25% 30% South W est South East London East of England W est Midlands East Midlands Y orkshir e & the Humber North W est North East
Before housing costs After housing costs
18% 21% 17% 22% 19% 22% 16% 20% 18% 23% 13% 18% 16% 28% 12% 18% 14% 19% Source: DWP 2014a
The figures show some of the highest levels of poverty (before housing costs (BHC)) are evident in the post-industrial regions of the north and the West Midlands. After housing costs, the pressures of the London housing market are particularly pronounced, in large part due to a failure of policy in coping with housing demand pressures (Bailey 2014). While poverty in London is equivalent to the national average when housing is not taken into account, once housing costs are included, London has the highest levels of poverty – not only of the regions, but of the devolved nations too. Such forces are also evident to a lesser extent in the high-value housing markets of southern England.
2.2 Child poverty
Addressing child poverty was, and to a certain extent remains, one of the central social policy objectives of the Westminster government. The most commonly used calculation of child poverty takes the proportion of children living in households falling into the main definition of poverty. Using time series data, we can not only observe the differences in scale of child poverty, but also how patterns of poverty have changed over time. The data depicts the proportion of children living in families where the income is 60 per cent or less of the median (not including housing costs).
Figure 2.4
Child poverty, before housing costs
0% 5% 10% 15% 20% 25% 30% 35% 40% 10/1 1–12 /13 09/1 0–11 /12 08/0 9–10 /11 07/0 8–09 /10 06/0 7–08 /09 05/0 6–07 /08 04/0 5–06 /07 03/0 4–05 /06 02/0 3–04 /05 01/0 2–03 /04 00/0 1–02 /03 99/0 0–01 /02 98/9 9–00 /01 97/9 8–99 /00 96/9 7–98 /99 95/9 6–97 /98 94/9 5–96 /97 England Scotland Wales Northern Ireland Source: DWP 2014a
The general picture of the UK is of a significant fall in child poverty (around five percentage points) between the middle of the 1990s and the middle of the 2000s (DWP 2014a). This occurred during a lengthy period of economic growth and a range of social policies designed to tackle child poverty, many of which remain in place today. Underneath the headline figures are differing performances for the nations of the UK. Notably in Scotland, child poverty fell from 29 per cent between 1994 and 1997 to 17 per cent by 2013.5 Looking at the figures for individual nations since the recession, shifts have been more volatile in Wales and Northern Ireland, but both appear to be returning to downward trajectories. However, this masks the impact of rising housing costs on levels of child deprivation, as shown in figure 2.5. Figure 2.5
Child poverty, after housing costs
0% 5% 10% 15% 20% 25% 30% 35% 40% 10/1 1–12 /13 09/1 0–11 /12 08/0 9–10 /11 07/0 8–09 /10 06/0 7–08 /09 05/0 6–07 /08 04/0 5–06 /07 03/0 4–05 /06 02/0 3–04 /05 01/0 2–03 /04 00/0 1–02 /03 99/0 0–01 /02 98/9 9–00 /01 97/9 8–99 /00 96/9 7–98 /99 95/9 6–97 /98 94/9 5–96 /97 England Scotland Wales Northern Ireland Source: DWP 2014a
5 The HBAI data is expressed in three-year rolling averages to mitigate margins of error in the data; however, it will not eliminate this entirely. There is also the issue that when wages fall, as does the 60th percentile used to calculate poverty. Falls in poverty do not therefore necessarily mean that families have higher incomes.
Taking housing costs into account adjusts the picture. Figure 2.5 shows that the progress in recent years on child poverty is largely continuing in Wales and Northern Ireland, but with housing costs accounted for, the patterns appear more volatile in England and Scotland.
Table 2.1 shows that since the recession child poverty has fallen in all regions of the UK before and after housing costs are accounted for. The post-recession figures should be treated with a degree of caution given the recent deterioration in median incomes, which reduces the nominal threshold households fall below in order to be classified as in poverty. Indeed, UK data on absolute poverty both before and after housing costs supports this, showing that the share of the population living in absolute poverty is up two percentage points (after housing costs) since 2008/09. The section below on earnings provides further detail on this point.
Table 2.1
Percentage point change of children living in poverty (2008–2013)
BHC AHC
England -5 -4
North East -7 -7
North West -5 -3
Yorkshire and the Humber -4 -3
East Midlands -10 -5 West Midlands -8 -7 East of England -3 -3 London -5 -3 South East -2 -4 South West -3 -1 Wales -4 -1 Scotland -4 -4 Northern Ireland -2 -1 Source: DWP 2014a
Table 2.1 also shows that England and Scotland are making the strongest progress, while the Welsh and Northern Irish positions appear to be following a slower path. In contrast to previous research by McCormick and Harrop (2010), according to which the East Midlands had been the least improved of the English regions, the new post-recession evidence appears to show the East Midlands experiencing the steepest falls in the child poverty rate before housing costs are taken into account. Despite progress in most regions, the data shows that housing is having a large impact on levels of poverty. Figure 2.5 shows child poverty in Wales was at its lowest level since 1994. However, on the post-housing cost measure, child deprivation is returning to levels seen in 2004. The reforms to housing benefit, including freezing of entitlements at 1 per cent and the spare-room subsidy/ bedroom tax make higher levels of housing cost-induced poverty across all of the nations a risk. In future, therefore, the data may show higher levels of after housing cost poverty levels than the current indicators illustrate, in particular as a consequence of freezing housing benefit entitlements and the capping of local housing allowance (LHA). However, the effects of recent rounds of welfare reform on AHC poverty levels are likely to be partially offset in Scotland and Wales, which both have partial measures to mitigate the impact of the spare-room subsidy or ‘bedroom tax’.
Looking to the future, the Institute for Fiscal Studies (IFS) has recently reported a series of projections on levels of poverty in the constituent parts of the UK up to 2020. Unfortunately, the IFS study combines the figures for England and Wales, but there are separate figures for Scotland and Northern Ireland. Figure 2.6 shows the most current child poverty data, and for 2020.
Figure 2.6
Child poverty (before housing costs)
0% 5% 10% 15% 20% 25% 30% 35% Northern Ireland Scotland
England & Wales 2013 2020 20% 23.4% 17% 22.7% 21% 29.7%
Source: IFS 2013a
The IFS model projects that child poverty will rise significantly in both Scotland and Wales. At 29 per cent of children in poverty before housing is accounted for, Northern Ireland is predicted to return to the position it was in in 1998; and at 23 per cent (BHC) Scotland would be back to its position a decade earlier in 2003. The IFS suggests that the main reason behind these rises in child poverty is that future earnings are expected to grow faster than benefit entitlements, meaning there will be a widening gap between those on low incomes needing social security support, and those who don’t receive such benefits (IFS 2013a).
2.3 Pensioners
Pensioner poverty has been considered to be of particular importance because, as most pensioners have exited the labour market, they are unable to dramatically change their income and economic circumstances, while at the same time the value of their income is closely tied to the performance of their pensions.
Figures 2.7 and 2.8 show the proportion of pensioners living at or below 60 per cent of median incomes, before and after housing costs respectively.
The before housing costs data shows a large fall in levels of pensioner poverty across all of the four nations of the UK. The most substantial falls are evident in Scotland, while Northern Ireland continues to have the worst levels of pensioner poverty in the UK. The latest NPI review into poverty in Northern Ireland nonetheless concluded that while other groups, such as 16–29-year-olds, had seen marked rises in post-recession poverty, the decline in pensioner poverty levels continued through 2012, largely uninterrupted by the recession, and certainly consistent with the Great Britain average (NPI 2014). There also appears to be less uniformity to falls in pensioner poverty in the run-up to and after the recession, with Northern Ireland seeing generally slower progress in recent years.
Figure 2.7
Pensioner poverty, before housing costs
0% 5% 10% 15% 20% 25% 30% 35% 10/1 1–12 /13 09/1 0–11 /12 08/0 9–10 /11 07/0 8–09 /10 06/0 7–08 /09 05/0 6–07 /08 04/0 5–06 /07 03/0 4–05 /06 02/0 3–04 /05 01/0 2–03 /04 00/0 1–02 /03 99/0 0–01 /02 98/9 9–00 /01 97/9 8–99 /00 96/9 7–98 /99 95/9 6–97 /98 94/9 5–96 /97 England Scotland Wales Northern Ireland Source: DWP 2014a Figure 2.8
Pensioner poverty after housing costs
0% 5% 10% 15% 20% 25% 30% 35% 10/1 1–12 /13 09/1 0–11 /12 08/0 9–10 /11 07/0 8–09 /10 06/0 7–08 /09 05/0 6–07 /08 04/0 5–06 /07 03/0 4–05 /06 02/0 3–04 /05 01/0 2–03 /04 00/0 1–02 /03 99/0 0–01 /02 98/9 9–00 /01 97/9 8–99 /00 96/9 7–98 /99 95/9 6–97 /98 94/9 5–96 /97 England Scotland Wales Northern Ireland Source: DWP 2014
After housing costs are accounted for, the fall in pensioner poverty is even greater and differences between nations even less pronounced than the BHC measure. At the start of the devolution process, as much as 42 per cent of Scottish pensioners were living in poverty, whereas by 2013 this had fallen to 12 per cent. The other nations in the UK made equally impressive progress. Figure 1.8 also illustrates that progress in Scotland, Wales and England may be weakening, though from a three-year average this could be too early to illustrate any trends.
The impact of housing cost-induced poverty on pensioners is more constrained than on other groups. This is because people of pensionable age often have very low housing costs, as many will own their homes outright, while for those that do not, pensioners represent a significant share of social housing tenants where rents are much lower than in the private market (which are more likely to be inhabited by younger age-groups).
Table 2.2
Changes in pensioner poverty (2007/8–2011/3)
BHC AHC
England -5 -4
North East -10 -8
North West -7 -5
Yorkshire and the Humber -8 -5
East Midlands -9 -6 West Midlands -4 -1 East of England -5 -4 London -5 -4 South East -2 -1 South West -6 -5 Wales -6 -4 Scotland -4 -2 Northern Ireland -6 -5 Source: DWP 2014a
The data shows that since the recession, pensioner poverty appears to have declined at a faster rate than child poverty over the period 2008–13; however, once housing costs are taken into account, the post-recession decline of
pensioner poverty was marginally weaker. The post-recession data partly reflects the pre-recession findings of McCormick and Harrop (2010), showing that the North East is still ahead of the national trend in falling BHC pensioner poverty. The East Midlands, which had been one of the least improved areas of the UK, has since the recession seen some of the most substantial declines in pensioner poverty at -9 per cent BHC and -6 per cent AHC, compared to the England average of -5 and -4 per cent respectively.
The dramatic and more uniform falls in pensioner poverty can be explained by the direct efforts of central government to reduce pensioner poverty (through pension credit and specific benefits such as free TV licences, bus passes and winter fuel payments, and so on). More importantly, the uniformity is more likely accounted for by the fact that pensions remain a UK government remit, and therefore in order to deliver substantial reductions in pensioner poverty, governments can use instruments, such as the ‘triple lock’, to ensure that the state pension not only helps people move above the 60 per cent poverty threshold, but through linking to earnings, inflation or 2.5 per cent, can ensure that pensioners do not temporarily fall back into poverty. In addition, as most pensioners receiving the state pension are retired, they are less subject to the fluctuations in real wages.
It is worthwhile pointing out that the state pension is a much clearer guarantor of minimum incomes than the other welfare benefits and tax credits that have been targeted at child poverty, hence the different paths the two groups have taken. The uniformity of state pension provision therefore helps to explain the very limited divergence between the devolved nations, with the housing market accounting for the minor divergences evident in the post-housing cost calculations.
2.4 Key drivers of poverty
Unemployment and economic activity
Levels of unemployment are a strong signal of poverty, and workless households face a particularly high risk of poverty. Unemployment figures show that as the recession bit in 2008, levels of unemployment rose quickly in each nation. Levels of unemployment are remarkably similar between nations and track each other quite
closely over time: in 2005 all nations had unemployment around 5 per cent, and in 2013 all had unemployment levels of around 8 per cent. Wales would appear to have fared worse through the recession and Northern Ireland best, albeit from a stronger starting point, but in recent times there appears to have been a remarkable convergence in unemployment rates at just over 7 per cent in all UK nations.
Figure 2.9 Unemployment by country 0% 1% 2% 3% 4% 5% 6% 7% 8% 9% 10% Oct–D ec 20 13 Oct–D ec 20 12 Oct–D ec 20 11 Oct–D ec 20 10 Oct–D ec 20 09 Oct–D ec 20 08 Oct–D ec 20 07 Oct–D ec 20 06 Oct–D ec 20 05 Oct–D ec 20 04 Oct–D ec 20 03 Oct–D ec 20 02 Oct–D ec 20 01 Oct–D ec 20 00 Oct–D ec 19 99 Oct–D ec 19 98 Oct–D ec ‘9 7 England Scotland Wales Northern Ireland Source: Nomis 2014b
Note: Unemployment is by the ILO measure.
That the levels of unemployment in each nation appear so closely synchronised is profoundly important for the devolved nations’ poverty strategies. This similarity suggests that there is a high level of linkage between national and regional economies within the UK and so the ability of devolved nations to control overall levels of poverty is contingent on the wider macroeconomic context in the UK, as well as the wider international economic context.
The fact that the Welsh have both the highest levels of child poverty and the highest levels of unemployment could also suggest a link between the two; however, the position of Northern Ireland is the reverse, which had both high BHC and AHC poverty, and child poverty levels, and yet has lower levels of unemployment. This is likely explained by the fact that there is a higher proportion of economically inactive people in Northern Ireland. Economic inactivity is particularly high among over-45s in Northern Ireland which is in part due to disability and mental health issues resulting from the Troubles.
Figure 2.10 illustrates employment rates in the different nations of the UK. Employment rates would appear to be closely related to overall poverty levels. The employment rates of both Wales and Northern Ireland for example align with their respective positions on the whole population poverty measure. Scotland, by contrast, had higher levels of employment in 2012 and correspondingly lower levels of poverty. Considering the most recent data which shows that in 2012 England’s employment rate increased while Scotland’s fell, one might expect that this will feed into future national poverty trends.
Figure 2.10
Working-age employment rate by country
Oct–D ec 20 13 Oct–D ec 20 12 Oct–D ec 20 11 Oct–D ec 20 10 Oct–D ec 20 09 Oct–D ec 20 08 Oct–D ec 20 07 Oct–D ec 20 06 Oct–D ec 20 05 Oct–D ec 20 04 Oct–D ec 20 03 Oct–D ec 20 02 Oct–D ec 20 01 Oct–D ec 20 00 Oct–D ec 19 99 Oct–D ec 19 98 Oct–D ec ‘9 7 60% 62% 64% 66% 68% 70% 72% 74% 76% England Scotland Wales Northern Ireland
Source: Nomis 2014a
Earnings and incomes
The central determinant of poverty levels is household income, used both to measure absolute and relative poverty in the UK. Household income, for the purposes of measuring poverty is calculated using both household earnings from employment (or self-employment) and their income from other sources, most obviously pensions, investments and social security payments. Understanding the dynamics of these elements is essential to understanding the changing patterns of poverty in the devolved nations.
Figure 2.11
Median full-time earnings
£0 £5,000 £10,000 £15,000 £20,000 £25,000 £30,000 1999 2000 2001 2002 2003 2004 2005 2006 2006 2007 2008 2009 2010 2011 2012 England Scotland Wales Northern Ireland Source: Nomis 2014c
Figure 2.11 shows that the lowest median earnings are evident in Northern Ireland and Wales. The HBAI data shows that poverty calculated before housing costs are highest in these nations (DWP 2014a). The earnings data also shows that despite a fairly tight relationship between earnings at the turn of the century, over the past decade earnings in Scotland appear to have shifted paths, moving apart from Wales and Northern Ireland, and more closely tracking English earnings patterns. It is difficult to read any clear impact on earnings that resulted from the recession that began in 2008.
However, it is troubling to observe the apparent slippage of earnings in Wales, falling marginally behind Northern Ireland, which may in part explain the more marked weakening in the Welsh position in spite of recent improvements in the other labour market measures. As the New Policy Institute (NPI) highlights, the deteriorating position of Welsh earnings relative to other parts of the UK is reflected in the fact that working age, and working people, constitute an increasing share of Welsh people in poverty (NPI 2013), while the position of pensioners, mostly outside the labour market, continues to improve. It is too early to tell whether the improving labour market outcomes of each of the nations will deliver improved levels of earnings growth, which could have more marked impacts on poverty levels than improvements in employment per se.
In any case, perhaps a better measure of household resilience is median income, which takes into account sources of income beyond that derived from employment such as social security support and income from multiple family members.
Figure 2.12
Median household income, before housing costs (2011/12 prices)
£300 £320 £340 £360 £380 £400 £420 £440 £460 £480 10/11–12/13 09/10–11/12 08/09–10/11 07/08–09/10 06/07–08/09 05/06–07/08 04/05–06/07 03/04–05/06 02/03–04/05 01/02–03/04 00/01–02/03 99/00–01/02 98/99–00/01 97/98–99/00 96/97–98/99 95/96–97/98 94/95–96/97 England Scotland Wales Northern Ireland Source: DWP 2014a
Figure 2.12 shows that real incomes in three of the four nations of the UK rose substantially during a long period of labour market expansion and this lasted even into the recession. However, the real household incomes across all four devolved nations have deteriorated in the past two to three years, and in Northern Ireland
they are lowest on this set of records. With benefit entitlements currently being subjected to substantial fiscal tightening, those living in poverty, and out of the labour market, are likely to see their positions deteriorate further. For instance, the freezing of a range of benefit entitlements will ensure that benefits do not keep pace with the cost of living, pushing more families – both in work and particularly those out of work – into deeper poverty.
Cost of living
It is increasingly apparent that both earnings and incomes need to be understood alongside the cost of living in each of the devolved nations. The current
measurement of median disposable incomes adopted by the statistical calculations of poverty do not take most regional variations of living costs into account. The exception is housing costs, where rents, mortgage payments, buildings insurance, ground rent, water rates and other core associated housing expenditure are combined to generate the after housing cost measures of poverty as illustrated above. Housing takes up a significant proportion of income, but there are other substantial elements of family spending where the cost of the household goods differ by nation, and the demand for them more necessary in some areas than others. These differences create different cost pressures for UK residents, stretching disposable incomes more in some areas than others. Although they won’t show up in official poverty measures, which focus on income only, they are important to consider as it is important for people’s lived experience of low income.
The data on the regional cost of living is of mixed quality. The cost of living, and changes thereof, measured by inflation is calculated on a state-wide basis for each quarter by the Office for National Statistics (ONS). As part of their duties as members of the European Union, UK statisticians every six years are expected to develop an index on the regional cost of living, known as the Relative Regional Consumer Price Levels (RRCLPs) of goods and services. The latest edition was produced by the ONS in 2010, and is based on 12,000 observations across regions of the UK from 168 items of expenditure.
Figure 2.13
Regional price level relative to national price level (index UK = 100)
92% 94% 96% 98% 100% 102% 104% 106% 108% Northern Ireland Wales Scotland England (ex. London) UK London 106.7% 100.0% 99.8% 99.8% 97.6% 97.1% Source: ONS 2010
Figure 2.13, which excludes core housing costs, is valuable as it indicates that, while earnings in the more deprived nations of the UK are lower, prices in the poorer devolved nations seem to reflect this. The IFS has previously shown that taking into account regional price differences dramatically alters the picture of living standards and poverty across different parts of the UK (IFS 2010).
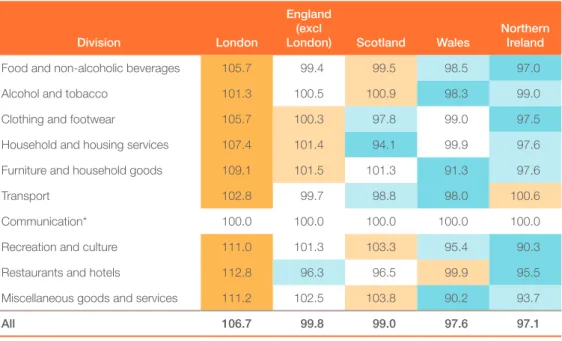
Table 2.3
Regional Price Index factors, 2010
Division London
England (excl
London) Scotland Wales Northern Ireland
Food and non-alcoholic beverages 105.7 99.4 99.5 98.5 97.0
Alcohol and tobacco 101.3 100.5 100.9 98.3 99.0
Clothing and footwear 105.7 100.3 97.8 99.0 97.5
Household and housing services 107.4 101.4 94.1 99.9 97.6
Furniture and household goods 109.1 101.5 101.3 91.3 97.6
Transport 102.8 99.7 98.8 98.0 100.6
Communication* 100.0 100.0 100.0 100.0 100.0
Recreation and culture 111.0 101.3 103.3 95.4 90.3
Restaurants and hotels 112.8 96.3 96.5 99.9 95.5
Miscellaneous goods and services 111.2 102.5 103.8 90.2 93.7
All 106.7 99.8 99.0 97.6 97.1
Source ONS 2010
* According to the ONS, 'there is no observed regional variation in price levels' for communications costs.
Table 2.3 illustrates a range of factors determining the relative costs of goods purchased in the UK (where UK = 100). Unsurprisingly, it shows that in autumn of 2010, London was the most expensive part of the UK, while prices in Northern Ireland were generally lowest, particularly among essentials such as food, clothing and footwear. The price data generally reflects the ranks of each country relative to their earnings positions explored earlier, with England earning and costing the most, and Northern Ireland earning and costing the least.
On specific areas of household items, the report notes small differences in areas such as alcohol and tobacco, where major retailers would typically apply regionally blind pricing policies. However, the report also finds:
‘Greater price dispersion exists in the divisions that include services, including restaurants and hotels, recreation and culture, and miscellaneous goods and services. This reflects the variance in labour expenses in the regions which make up a large proportion of the total costs in the service industry and also the variability in the cost of renting/leasing outlets across the regions. Durable goods such as furniture and household goods are also demonstrating high price dispersion with clothing and footwear and food and non-alcoholic beverages showing moderate price dispersion from the UK average.’
ONS 2010
Beyond this irregular exercise by the ONS, regional cost of living assessments are not available. We can only glean insight from household expenditure data, which
for all of its merits also inevitably includes consumer tastes as well as spending pressures, and some other data sources that are regionally accessible.
The following information sourced from the ONS highlights the nations where spending on individual elements of expenditure is highest and lowest. Figure 2.14
Household expenditure by type (%)
Food & non-alcoholic drinks Alcoholic drinks, tobacco & narcotics Clothing & footwear
Housing (net), fuel & power
Household goods & services Health
Transport Communication
Recreation & culture Education
Restaurants & hotels Miscellaneous goods & services 0% 10% 20% 30% 40% 50% 60% 70% 80% 90% 100% UK Northern Ireland Scotland Wales England Source: ONS 2013
The average household expenditure on different groups of items across the regions is fairly similar, and the differences small, reflecting broad homogeneity in household spending patterns across the regions. It also highlights the major expenditure items for the UK, with food, recreation, housing (including fuel costs) and transport dominating household spending. Some differences are wide enough for note – for instance, housing expenditure appears higher in England than other parts of the UK, and lowest in Northern Ireland. Some of the most interesting differences are between Northern Ireland and the rest of the UK: housing represents a much smaller proportion of outgoings in Northern Ireland, reflecting lower house prices and the distinct system for taxing housing. In Northern Ireland the costs of water are 50 pence per week compared to the UK average of £8.20 per week. This reflects the fact that water costs are traditionally absorbed in the Northern Irish equivalent of council tax, known as rates. However, expenditure on petrol is some 50 per cent higher than the UK average, and fuel to heat Northern Irish homes is also equally more expensive than the UK average.6 Also, spending on clothes and footwear is highest in Northern Ireland, most likely as a result of larger family sizes.
6 This is significant because poverty mitigation strategies need to understand the cost pressures experienced every day by families on low incomes; a logical element of any Northern Irish poverty strategy would look at the costs of fuel and heating the home.
Within the English regional data, presented in table 2.4, the most apparent differences in costs are rent and mortgages. The table shows the largest itemised elements of household expenditure by English region, where the darker shades indicate proportionally high-expenditure items.
Table 2.4
Items of family expenditure as percentage of total household spending, by region
NE NW Y&H EM WM EE LDN SE SW Eng
Income tax, payments less refunds
14.5 17.0 15.7 17.1 16.0 19.2 24.0 21.1 17.8 18.9
Food 10.6 10.5 10.6 10.8 10.8 10.5 9.4 9.8 10.6 10.3
Mortgage interest payments and council tax
8.8 9.5 8.8 9.5 8.9 10.2 10.0 10.3 10.2 9.7
Purchase or alteration of dwellings, mortgages
7.8 9.0 7.2 10.1 7.8 9.5 9.0 9.8 10.9 9.2
Gross rent 10.3 8.7 8.9 7.0 8.1 7.1 15.6 7.4 6.7 9.1
Restaurants and hotels 8.1 8.1 8.7 7.4 8.4 7.9 9.3 7.6 8.1 8.2
Operation of personal transport 7.3 6.9 7.4 8.0 7.9 8.2 4.9 7.7 8.3 7.3 National insurance contributions 5.3 5.9 5.7 5.7 5.8 6.1 6.1 5.5 4.9 5.7
Clothing and footwear 5.6 4.8 4.8 4.2 4.4 4.1 4.8 4.3 4.5 4.5
Electricity, gas and other fuels
4.9 4.6 4.9 4.9 5.0 4.5 3.7 4.1 4.4 4.4
Source: ONS 2013
Again, many of the differences in expenditure are limited, for instance across spending on food, on mortgage payments, or on restaurants and hotels, but there remain some notable features. Average household expenditure on rent, for instance, is highest in London and lowest in the East Midlands. The use of personal transport in London is also noticeably lower in London than elsewhere, reflecting lower levels of car ownership.
However, we cannot assume that the spending patterns of the average family within the different countries and regions of the UK are uniform across the income spectrum. For instance, the poorest households often spend more money on essential items due to consumer habits and tariff structures: the poorest families will often be on the more expensive ‘pay as you go’ energy meters, for example. To account for this, table 2.5 breaks down expenditure by income decile to reveal the distinctive spending patterns of low-income households in comparison to the average.
The revealing feature of this data is that the poorest households spend substantially more of their total outgoings on such essentials as housing, heating and food than the average household across the UK. Correspondingly, expenditure among the poorest households is lower for categories such as recreation and culture than higher-income groups.
Unfortunately, the data does not break down by both income group and country simultaneously, and therefore makes analysis of the cost of living challenges among low-income households in different countries problematic. In simple terms though, the higher cost pressures in different parts of the country will affect those on low incomes in different ways. As we have already highlighted, however, a critical aspect of cost of living is housing costs.
Table 2.5
Items of family expenditure as percentage of total household spending, by income decile
Bottom 10% All
Food and non-alcoholic drinks 15 12
Alcoholic drinks, tobacco and narcotics 4 3
Clothing and footwear 4 5
Housing (net), fuel and power 25 14
Household goods and services 7 6
Health 1 1
Transport 8 13
Communication 3 3
Recreation and culture 9 13
Education 2 1
Restaurants and hotels 7 8
Miscellaneous goods and services 7 8
All expenditure groups 91 86
Other expenditure items 9 14
Source: ONS 2013, Table A5
Housing costs
As we have shown in the analysis above, housing costs are a key determinant of the cost of living for many parts of the UK. Figure 2.15 shows household expenditure on housing costs.
Figure 2.15
Weekly expenditure on housing costs
Rent by renters Mortgage by mortgage-holders £0 £20 £40 £60 £80 £100 £120 £140 £160 UK Northern Ireland Scotland Wales England Source: ONS 2013
The data does not show whether it is cheaper to buy a house or rent in each nation. Rather, it shows the average expenditure on housing costs by either mortgage holders or renters. What the data does clearly illustrate is that more is spent per week in absolute terms on housing in England, irrespective of tenure, than anywhere else. This is true by some margin, especially the difference between
English rent expenditure and the other nations of the UK. The average expenditure per week on rent in Northern Ireland is the lowest for the UK, while mortgage-holders in Wales spend the least per week on servicing the debt on their assets relative to other UK nations.
While illustrative perhaps of relative cost pressures for all households, in order to understand the costs of housing for those in poverty it is also helpful to look at housing benefit data, given that people on low incomes are likely to need rent subsidy to support the costs of renting. Figure 2.16 illustrates the average weekly award of housing benefit in each nation of Great Britain (comparable data for Northern Ireland is not available).
Figure 2.16
Average weekly housing benefit award by tenure
£0 £20 £40 £60 £80 £100 £120 Scotland Wales England Great Britain
Social rent Private rent
Source: DWP 2014c
Housing benefit data is illustrative of the relative costs of providing accommodation for those on low incomes and, by proxy, the rents of those on low incomes. That housing cost-induced poverty is higher in Wales than in Scotland (though the average weekly award for private rented sector (PRS) benefit claimants is lower) appears to be explained by the fact that there is a relatively smaller share of the Scottish caseload living in PRS property. DWP (2014a) data shows that while 34 per cent of Welsh claimants live in the private rented sector, only 20 per cent of claimants do in Scotland. More households living in more expensive private rented sector property (relative to social rented sector property) applies more cost pressures to families. Although the exact housing cost pressures are highly localised, figure 2.16 offers an illustration of the costs of renting within each tenure, and shows that those living in private housing will face higher rents and, all other variables held constant, the most challenging work incentives. The cost gap between renting in the private or social sector are at their widest in England, but the figures are distorted by the costs of the London housing market. Private renting is generally most costly in England, and least in Wales, while for social tenants England is the most costly country, while Scotland is the least.
Linking this back to poverty, it is important to note that housing benefit is not available to everyone – for instance, it is not available to mortgage holders, who may find themselves with little financial support until a time threshold is reached to become eligible for government mortgage support.