ISSN 1682-8356 DOI: 10.3923/ijps.2019.214.222
Research Article
Technical Efficiency of Battery Cage and Deep Litter Systems in
Poultry Production
B.O. Ajiboye, O.M. Bamiro, A.G. Adeyonu and S.A. Faseyi
Department of Agricultural Economics, Landmark University, Omu-Aran, Kwara State, Nigeria
Abstract
Background and Objective: The importance of the poultry industry to the national economy cannot be overemphasized. Approximately 10% of the Nigerian population is engaged in poultry production, mostly on subsistence and small or medium-sized farms. However, the output level still remains low compared to the input. The aim of this study was to examine the technical efficiency of the battery cage and deep litter systems of poultry production in Nigeria. Materials and Methods: A multi-stage sampling technique was used to select 120 battery cage farmers and 120 deep litter farmers. A well-structured questionnaire was used to collect information on the farmers and the farm characteristics. The data collected were analysed using descriptive and inferential statistics. Results: The budgetary analysis showed that the net profit for one bird for the battery cage farmer stood at x587, whereas that of the deep litter farmer was x635. Stochastic frontier modelling showed a higher inefficiency in the deep litter system of poultry production compared with the battery cage system. The efficiencies were 79 and 60% for the battery cage and deep litter farms, respectively. Additionally, labour and flock size contributed to the inefficiencies of both the battery and deep systems of poultry production. The Chow test (Fcal = 0.45 and Ftab = 2.3) showed that there was no structural difference in the production of the battery cage and deep litter systems in the study area.
Conclusion: The results show that even though the two systems are profitable but the battery cage system is more profitable than the deep litter system.
Key word: Battery cage, chow test, deep litter, economic analysis, poultry production, stochastic production frontier
Received: April 12, 2018 Accepted: December 25, 2018 Published: April 15, 2019
Citation: B.O. Ajiboye, O.M. Bamiro, A.G. Adeyonu and S.A. Faseyi, 2019. Technical efficiency of battery cage and deep litter systems in poultry production. Int. J. Poult. Sci., 18: 214-222.
Corresponding Author: B.O. Ajiboye, Department of Agricultural Economics, Landmark University, Omu-Aran, Kwara State, Nigeria
Copyright: © 2019 B.O. Ajiboye et al. This is an open access article distributed under the terms of the creative commons attribution License, which permits unrestricted use, distribution and reproduction in any medium, provided the original author and source are credited.
Competing Interest: The authors have declared that no competing interest exists.
Int. J. Poult. Sci., 18 (5): 214-222, 2019 INTRODUCTION
Agriculture in Nigeria has remained the largest sector, contributing nearly 39% to the Gross Domestic Product and employing nearly 60% of the country s workforce for the past two decades. More than 80% of the Nigerian rural population is directly or indirectly dependent on agriculture for its livelihood1. The agricultural sub-sectors comprises crops, fishery, livestock and forestry. The most prominent of these sub-sectors is the crop sector, followed by the livestock, in which the poultry enterprise is most dominant. The importance of poultry to the national economy cannot be overemphasised, as it has become popular industry for the smallholder farmers who contribute to the economy. The industry has assumed greater importance in improving the employment opportunity and annual food and protein production in Nigeria2. A report shows that approximately 10% of the Nigerian population is engaged in poultry production, mostly on subsistence and small or medium-sized farms3,4. The industry or sub-sector is characterized by farmers keeping a small number of birds usually for special occasions under a free-range or scavenging system of management, which is mostly common in the greater part of Africa. In view of this, the output level remains low compared to the input committed. More importantly, poultry production remains grossly inadequate, as the supply is much lower than the demand5,6. The poultry industry in Nigeria falls short of its aim of self-sufficiency in animal protein consumption in the country-estimated at 5 g/capita per day - which is a far cry from the F.A.O-recommended level of 35 g/capita per day6. As a result of the above, widespread hunger, malnutrition and under nutrition are evident in the country. The need therefore exists to increase the production of poultry and poultry products through the adoption of technically efficient modes of production. This study therefore examines the technical efficiency of battery cage and deep litter systems of poultry production.
MATERIALS AND METHODS
To enable the study to gain insight into the appropriate way of reflecting production system in the general Cobb-Douglas production, a Chow test of structural differences in the production function of deep litter systems and battery cage systems on poultry farms was conducted. The production deferential is analysed by estimating the production function equation for deep litter system and
battery cage system of poultry farms and estimating the pooled regression with an intercept shifter dummy variable (D) introduced as shown in Eq. 15,6:
lnQ = $0+$1+D1+$1 lnX1i+$2 lnX2i+...$4 lnX4+eI (1) The underlying null hypothesis for the test for structural change is stated below.
Ho : No structural difference exists between the production functions of a deep litter poultry farm production system and a battery cage poultry farm production system
The test consisted of the following three stages:
C Test for structural change: This is an overall test of
significant differences in the structural parameters (intercepts and slopes) of the production function of the two categories of farms. The tests statistic is F1-α/2, v1, v2, whereas the calculated F, (Fc) was obtained as:
(2) 2 2 2 e3 ei e2 c 3 1 2 F K K K
2 2 e1 e2 1 2 + K +K
Where3e32 = The error sum of the square for the pooled data without a dummy variable
3e12 = The error sum of the square for the battery cage system of poultry farm production function 3e22 = The error sum of the square for the deep litter
system of poultry farm production function K3 = The degree of freedom for the pooled data K1 = The degree of freedom for the battery cage system
of poultry farm s regression
K2 = The degree of freedom for the deep litter system of poultry farm s regression
The calculated F statistics was compared against the tabulated F-value, Ft = Fo.95, V1, V2 and we rejected the null hypothesis of no structural difference in the production of poultry farms if Fc>Ft; otherwise, we failed to reject the null hypothesis.
Test for homogeneity of slopes: When the first test revealed
that some structural differences exist in the production functions of the two sub-systems, further investigation was 215
necessary on the nature of the structural differences. The first of this was the test for homogeneity of slope. The test statistics were F1-α/2, v1, Fo.95, V1 and V2, whereas the calculated F, (Fc) was calculated and defined as follows:
2 2 2 e3 ei e2 c 3 1 2 F K K K
(3) 2 2 e1 e2 1 2 + K +K
Where,3e22,3e12, K1 and K2 are as previously defined
3e42 = The error sum of square for the pooled regression with an intercept dummy variable
K4 = The degree of freedom for the pooled regression with an intercept dummy variable
This statistic was compared against the tabulated F-value, Ft = Fo.95, V1, V2 and we rejected the null hypothesis that no differences existed in the slope parameters if Fc>Ft; otherwise, we failed to reject the null hypothesis.
Test for differences in intercepts: The final stage of the test
for structural differences in production function of the two poultry production sub-systems is the test for differences in intercepts of the production functions. The tests statistics is F1-α/2, v1, V2, whereas the calculated F (Fc) is defined as follows:
(4) 2 2 e3 e4 3 4 Fc = K K
2 e4 4 K
where, 3e32, 3e42, K3 and K4 are as previously defined This statistic was compared with the tabulated F-value, Ft = Fo.95, v1, v2 and we rejected the null hypothesis of no difference in the intercept production functions of the deep litter system and battery cage system farms if Fc > Ft; otherwise, we failed to reject the null hypothesis.
The result of the Chow test is crucial at this stage. If those results suggest significant structural differences in the two production systems, the dummy variable form of the Cobb-Douglas production function needs to be introduced. Therefore, Eq. 5, which reflects the nature of the difference becomes the following:
In Qi = βo+λo D1+β1 In X1i+λo D1
In X2i+ --- β4 In X4i+λ4 Di InX4 +ei (5)
where, Di is a dummy variable that takes on the value of I if the Ith farm is deep litter production system and 0 if otherwise. λK (K = 0, 1, ..., 4) is the change in the parameter of the Kth variable for deep litter poultry production system farm;
All other variables and parameters are as earlier defined.
Stochastic production frontier and technical efficiency
assessment: One of the widely used methods for assessing
technical efficiency differences across production units is the stochastic production frontier approach. The stochastic frontier production function builds hypothesized efficiency determinants into the inefficiency error component so that one can identify focal points for action to bring efficiency to higher levels7.
A stochastic production frontier, may be defined as Coelli7:
Q = f(Xi, β)exp(V-U) (6)
Where
Qi = The output of the ith farm
Pi = Vector of inputs
b = Vector of parameters to be estimated
f(x) = Suitable functional form, such as the Cobb-Douglas or Translog
V = Symmetric random error that is assumed to account for measurement error and other factors not under the control of the farmer
ui = Non-negative error component that accounts for technical inefficiency in production
exp = Stands for exponential function
In this application of the Cobb-Douglas stochastic production frontiers of poultry (eggs), the production is specified as follow:
lnQi = β0+λ0Di+βi ln X1i+λiDi ln X1i...β4
ln X4i+λ4Di lnX4i+νi = νi (7)
The vis are the random variables associated with disturbances in production and the uis are the non-negative random variables associated with technical efficiency of the ith farmer and are obtained by truncation at (zero) of the normal distribution mean ui and variance δ2 ui such that the following can be performed:
Int. J. Poult. Sci., 18 (5): 214-222, 2019 (8) i 0 i i z i Z
where, δi is a vector of the parameters of the inefficiency model to be estimated and the zi, z = 1,2 …, 7 are the farm and farmer-specific socio-economic variables, as well as the forms of integration and the level of integration hypothesized to influence the efficiency model, which is presented in Eq. 9:
µi = δ0+δ1 lnAge+δ2 lnEdu+δ3 lnExp
+δ4 Fls+δ5 D1+δ6 D2+(VA/S) (9)
Where
Age = Age of the farmers or decision makers measured in years
Edu = Level of education of the decision maker of the poultry enterprise measured as years of formal education
Exp = Experience of the decision maker of the poultry enterprise measured in years
Fls = Flock size of the poultry farms measured in numbers D1 = Dummy variable that takes on the value of 1 if the farm privately produces the feed used in the farm and 0 if otherwise
D1 = Dummy variable that takes on the value of 1 if the poultry farm owns a feed mill and 0 if otherwise VA/S = Value-added-sales ratio, a proxy for the extent of the
production system. The parameters of model and associated technical inefficiency terms for each farm were estimated by the stochastic production frontier procedure in the computer program7
METHODOLOGY: The study was conducted in the southwest
geopolitical zone of Nigeria where most of the poultry farms in the country are located. The zone comprises six states: Lagos, Ogun, Oyo, Osun, Ondo and Ekiti. A multi-stage sampling technique was used to select the respondents. The first stage involved the purposeful selection of Oyo and Ogun states from the six states in the zone. The two states were selected because they had the highest number of poultry farms in the zone in the year 20128. The second stage of the sampling involved a purposive selection of two Local Government Areas (LGAs) in each of the six states where battery cage and deep litter poultry farmers are predominant. The LGAs selected were identified to have the highest number of poultry farms in the respective states. In the third stage, four communities from each of the selected LGAs were randomly selected to give a total of 48 communities.
The number of poultry farmers that used battery cage and deep litter system of poultry production in each communities were used in the fourth stage, where four or five respondents were randomly selected from each of the selected communities, yielding a total of 240 respondents.
Method of data analysis: The technical efficiency estimation
is as follows9:
In Q = In βo+β1 In X1+β2 In X2+β3 In X3 +β4 In X4+ β5In X5 (10)
Where
Q = The value of the output (crate) X1 = The quantity of feed per farm (kg) X2 = The labour in man days
X3 = The veterinary costs per farm (x)
X4 = The other expenses (electricity, transportation, water supply etc.) (x)
X5 = The farm size (number of birds)
RESULTS AND DISCUSSION
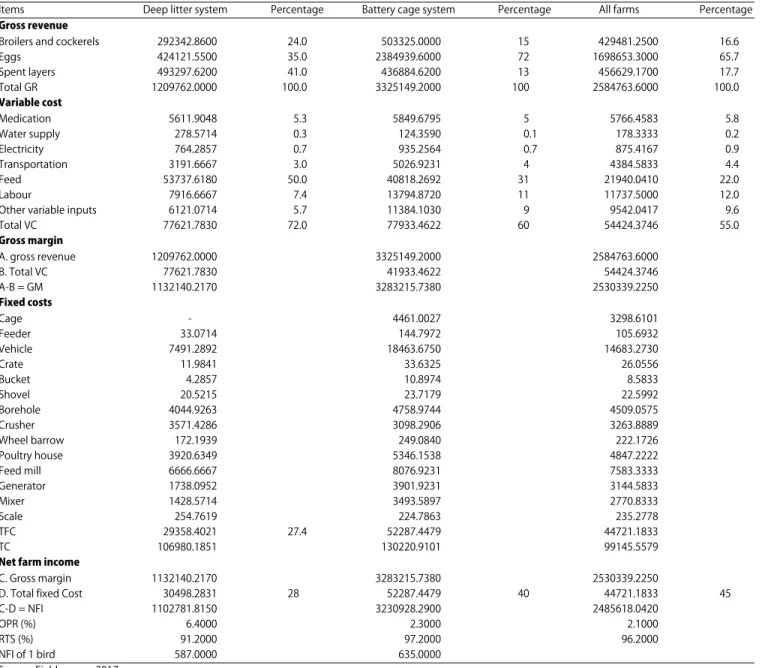
The results of the budgetary analysis are presented in Table 1. The analysis shows that the variable cost incurred by farmers of both systems, i.e., the battery cage and deep litter system of poultry production, includes the medication, water supply, electricity, transportation, feed, labour and other inputs. The results indicate that the feed cost was the highest cost incurred in both systems of production: 50% in the deep litter and 31% in the battery cage systems. The table indicates that the feed cost was high in the deep litter system poultry farming (x53, 737.618) compared to the cost to farmers practicing the battery cage system (x40, 818.269).
Although, the feed cost incurred in both systems of production is high, this simply confirms that feed is a major ingredient in any system of poultry production. Notably, the values for feed obtained in the study were far lower than those obtained in some previous studies10.
Furthermore, various substitutes are becoming available to the farmers for feed formulation, leading to the substitution of costly feed ingredients with less costly ones. In that case, the overall cost of feed is rapidly declining but much more in the battery cage than in the deep litter system. Other costs incurred include those for labour, which was observed to account for 7.4% in the deep litter and 11% in the battery cage systems, with the cost of medication being approximately 5.2 and 4.5% of the total cost of the deep 217
Table 1: Average costs and returns in x per system for poultry farms
Items Deep litter system Percentage Battery cage system Percentage All farms Percentage
Gross revenue
Broilers and cockerels 292342.8600 24.0 503325.0000 15 429481.2500 16.6
Eggs 424121.5500 35.0 2384939.6000 72 1698653.3000 65.7 Spent layers 493297.6200 41.0 436884.6200 13 456629.1700 17.7 Total GR 1209762.0000 100.0 3325149.2000 100 2584763.6000 100.0 Variable cost Medication 5611.9048 5.3 5849.6795 5 5766.4583 5.8 Water supply 278.5714 0.3 124.3590 0.1 178.3333 0.2 Electricity 764.2857 0.7 935.2564 0.7 875.4167 0.9 Transportation 3191.6667 3.0 5026.9231 4 4384.5833 4.4 Feed 53737.6180 50.0 40818.2692 31 21940.0410 22.0 Labour 7916.6667 7.4 13794.8720 11 11737.5000 12.0
Other variable inputs 6121.0714 5.7 11384.1030 9 9542.0417 9.6
Total VC 77621.7830 72.0 77933.4622 60 54424.3746 55.0 Gross margin A. gross revenue 1209762.0000 3325149.2000 2584763.6000 B. Total VC 77621.7830 41933.4622 54424.3746 A-B = GM 1132140.2170 3283215.7380 2530339.2250 Fixed costs Cage - 4461.0027 3298.6101 Feeder 33.0714 144.7972 105.6932 Vehicle 7491.2892 18463.6750 14683.2730 Crate 11.9841 33.6325 26.0556 Bucket 4.2857 10.8974 8.5833 Shovel 20.5215 23.7179 22.5992 Borehole 4044.9263 4758.9744 4509.0575 Crusher 3571.4286 3098.2906 3263.8889 Wheel barrow 172.1939 249.0840 222.1726 Poultry house 3920.6349 5346.1538 4847.2222 Feed mill 6666.6667 8076.9231 7583.3333 Generator 1738.0952 3901.9231 3144.5833 Mixer 1428.5714 3493.5897 2770.8333 Scale 254.7619 224.7863 235.2778 TFC 29358.4021 27.4 52287.4479 44721.1833 TC 106980.1851 130220.9101 99145.5579
Net farm income
C. Gross margin 1132140.2170 3283215.7380 2530339.2250
D. Total fixed Cost 30498.2831 28 52287.4479 40 44721.1833 45
C-D = NFI 1102781.8150 3230928.2900 2485618.0420
OPR (%) 6.4000 2.3000 2.1000
RTS (%) 91.2000 97.2000 96.2000
NFI of 1 bird 587.0000 635.0000
Source: Field survey, 2017
litter and battery cage systems, respectively. Furthermore, the water cost was the least variable cost (0.3 and 0.1%, respectively) in both systems.
The low values observed for medication is not an indication that this resource is less important. If the appropriate medical care is not taken, a 90% loss in the farm can occur11. The indication however, is that more attention to medication is needed on the farms, as this can help prevent disease and reduce mortality.
The fixed cost figure, however, reveals that the capital expenditure on fixed assets with respect to poultry farms practicing the battery cage system is higher (approximately 40%) than that of the deep litter system farmers. This is
because of the huge investment made by this group of farmers on capital equipment such as battery cages.
Gross revenues for both groups of poultry farms are observed to have come from the sales of broilers and cockerels, eggs and spent layers. Importantly, certain factors, such as the laying rate of birds, flock size and type of production system, normally affects the gross farm revenue. Those revenues reveal that poultry farms with battery cage system of production have higher gross revenue than poultry farmers using the deep litter system of production. This is as a result of the income realized from the sales of eggs, which is lower in farms practicing deep litter system with the battery cage farms. Similarly, the gross margin and gross revenue of
Int. J. Poult. Sci., 18 (5): 214-222, 2019
Table 2: Maximum likelihood estimate, ordinary least squares and inefficiency function of the battery cage poultry production system
Explanatory variables Parameters OLS MLE
General model Constant β0 12.375* (8.980) 12.084* (11.009) Quantity of feed β1 0.008 (0.337) 0.012 (0.749) Labour β2 0.120 (0.713) 0.352** (2.057) Veterinary cost β3 -0.003 (- 0.020) 0.021 (0.179) Other expenses β4 -0.369** (- 2.276) -0.253*** (-1.780) Flock size β5 0.565* (5.141) 0.418* (3.768) Inefficiency equation Constant δ0 0 0.832 (0.836) Age δ1 0 -0.026 (- 0.722) Education δ2 0 -0.399* (-2.615) Farming experience δ3 0 0.357* (2.582) Flock size δ4 0 -0.000 (-1.189)
Poultry farm privately producing feed δ5 0 1.048 (0.977)
Poultry farm owns a feed mill δ6 0 1.048 (0.977)
Diagnostic statistics
Sigma square E 1.420 2.437* (3.630)
Gamma ' 0.670* (5.231)
Log likelihood function LIF -121.220 -112.121
Log likelihood test LR 18.198
Source: Field Survey, 2017, Figures in parenthesis are T-values *significant at 1%, **Significant at 5%, ***Significant at 10%, Mean Efficiency: 0.650 Minimum: 0.008, Maximum: 0.888, MLE: Maximum likelihood estimate, OLS: Ordinary least squares
poultry farms using the deep litter system was lower than for the farms using battery cage and lower than the average gross margin with gross revenue of all farms. The deep litter system is known to accommodate fewer birds compared to the battery cage system; consequently, the fewer eggs are yielded under this system.
Furthermore, as shown in the table, the net farm income of the deep litter poultry farmers was lower than the average net income (x2485618) of all farms and that of the battery cage farmers. The net farm income of farmers using battery cage system is approximately 2.9 and 1.3 times the net income of farmers using deep litter system and all farms, respectively9. Additionally, the net farm income of one bird for the deep litter poultry farmers (x587) is lower than that of the battery cage poultry farmers (x635).
Table 1 also reveals that deep litter system farmers incurred higher costs of operation than their battery cage counterparts. The higher operating ratio (6.4%) experienced by deep litter system farmers may be due to the large expenses on feed and low sales on eggs. Similarly, the ratio on returns to scale for deep litter farmers was also lower (91%) than that of the battery cage counterparts, which was approximately 97%.
Furthermore, the operating margin of the deep litter system farmers was low, requiring a need for greater sales and a reduction in feed wastage to allow adequate returns on investment by these farmers.
Conclusively, both systems of poultry production were assessed to be profitable. However, the battery cage poultry farmers make more profit than the deep litter system farms in the study area.
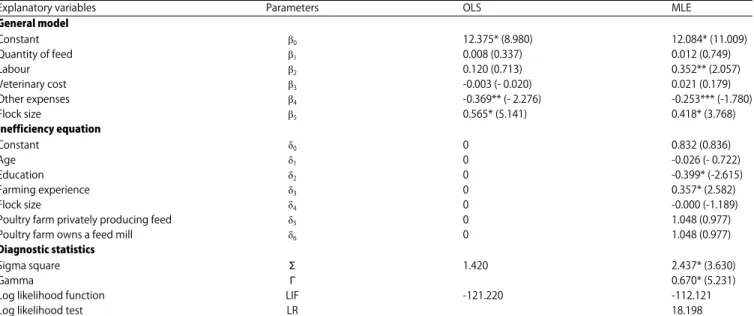
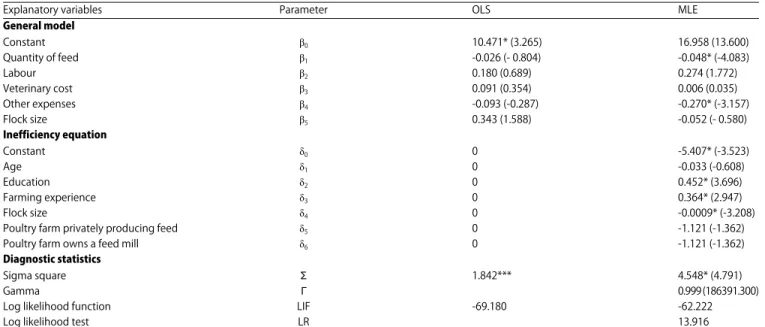
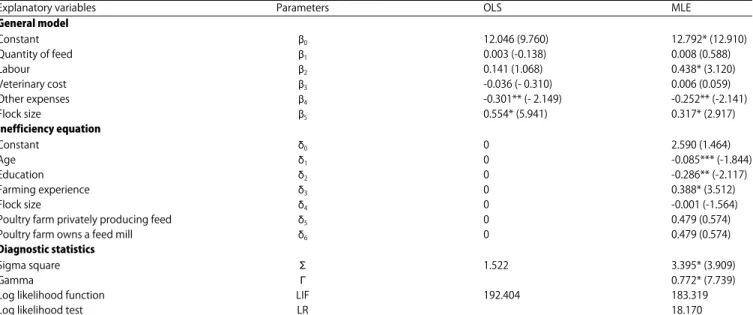
As shown in table 2 and 3, both the battery cage and deep litter systems of production, education and farming experience have significant effects on efficiency. While education reduces inefficiency in the battery cage system, it accounted for inefficiency in the deep litter system. The inefficiency-reducing effect of education in the battery cage system might be connected with the technicalities associated with the battery cage system of poultry production. In both systems, farming experience enhances inefficiency. In addition to the significant variables that are common to both systems, flock size has a negative and significant effect on the inefficiency modelled for the deep litter system. This implies that flock size has an efficiency-increasing effect. Age, education level and other expenses are the explanatory variables that exert a significant effect on the efficiency of the farmers in the results of the inefficiency model for all farms. The coefficients of age and education are negative, signifying that both variables have an inefficiency-reducing effect.
Table 3 reveals that flock size, labour and other expenses are the explanatory variables that significantly influence poultry production in the battery cage system. Both coefficients of flock size and labour are significant at the 1% probability level. On the other hand, other expenses have a negative and significant effect on poultry production and it is significant at the 10% probability level. A 1% increase in these variables will have effects that correspond to the respective values of their individual coefficient.
Table 3: Maximum likelihood estimate, ordinary least squares and inefficiency function of deep litter poultry production system
Explanatory variables Parameter OLS MLE
General model Constant β0 10.471* (3.265) 16.958 (13.600) Quantity of feed β1 -0.026 (- 0.804) -0.048* (-4.083) Labour β2 0.180 (0.689) 0.274 (1.772) Veterinary cost β3 0.091 (0.354) 0.006 (0.035) Other expenses β4 -0.093 (-0.287) -0.270* (-3.157) Flock size β5 0.343 (1.588) -0.052 (- 0.580) Inefficiency equation Constant δ0 0 -5.407* (-3.523) Age δ1 0 -0.033 (-0.608) Education δ2 0 0.452* (3.696) Farming experience δ3 0 0.364* (2.947) Flock size δ4 0 -0.0009* (-3.208)
Poultry farm privately producing feed δ5 0 -1.121 (-1.362)
Poultry farm owns a feed mill δ6 0 -1.121 (-1.362)
Diagnostic statistics
Sigma square E 1.842*** 4.548* (4.791)
Gamma ' 0.999 (186391.300)
Log likelihood function LIF -69.180 -62.222
Log likelihood test LR 13.916
Source: Field Survey, 2017, Figures in parenthesis are T-values *significant at 1%, **Significant at 5%, ***Significant at 10%, Mean efficiency: 0.294, Minimum: 0.002, Maximum: 0.999, MLE: Maximum likelihood estimate,
The production function of the deep litter system shows that feed and other expenses have a negative and significant effect on poultry production (Table 2). This implies that an increase in each of these variables will have a reduction effect on the output. The reduction effect of feed on output is contrary to expectation especially in the battery cage system. In a deep litter system, the quantity of feed is not measured but poured for the birds indiscriminately; some of this feed will neither be converted to flesh or extra eggs, as it will simply be passed as waste.
The production function estimate of all farms indicates that labour and flock size have positive and significant effects on poultry production (Table 3). They are both significant at the 1% probability level5,9,12. All the significant explanatory variables have an output-increasing effect.
The pooled results in Table 4 are plausible and in accordance with a priori expectations5,12. On the other hand, years of poultry farming experience, contrary to expectation, has an efficiency-reducing effect. This might be due to overdependence on acquired experiences at the expense of new innovation.
Chow s test of significance difference in production function
Test for structural (technical) changes or differences in the production function of battery cage and deep litter systems:
2 2 2 e3 e1 e2 e 3 1 2 F K K K
2 2 e1 e2 1 2 K K
3e32 = 171.6737, 3e12 = 100.2297, 3e22 = 67.2532 K1 = 72, K2 = 36, K3 = 114 c (171.6737-100.2297-67.2532)/(114 -72-36) F = (100.2297+67.2532)/(72+36) 4.1908 / 6 = 167.7829.108 0.6985 0.4504 1.5508 Ftab = F1-x, V1, V2 = F1-0.05, K-1, N-k Where X = 0.05 K = 6-no of visible N = 120 Therefore: Ftab = F0.05, 5,114 Ftab = 2.3Since Ft>Fc hence, we fail to reject the null hypothesis of no structural difference.
Int. J. Poult. Sci., 18 (5): 214-222, 2019
Table 4: Maximum likelihood estimate, ordinary least squares and inefficiency function of all farms
Explanatory variables Parameters OLS MLE
General model Constant $0 12.046 (9.760) 12.792* (12.910) Quantity of feed $1 0.003 (-0.138) 0.008 (0.588) Labour $2 0.141 (1.068) 0.438* (3.120) Veterinary cost $3 -0.036 (- 0.310) 0.006 (0.059) Other expenses $4 -0.301** (- 2.149) -0.252** (-2.141) Flock size $5 0.554* (5.941) 0.317* (2.917) Inefficiency equation Constant *0 0 2.590 (1.464) Age *1 0 -0.085*** (-1.844) Education *2 0 -0.286** (-2.117) Farming experience *3 0 0.388* (3.512) Flock size *4 0 -0.001 (-1.564)
Poultry farm privately producing feed *5 0 0.479 (0.574)
Poultry farm owns a feed mill *6 0 0.479 (0.574)
Diagnostic statistics
Sigma square E 1.522 3.395* (3.909)
Gamma ' 0.772* (7.739)
Log likelihood function LIF 192.404 183.319
Log likelihood test LR 18.170
Source: Field survey, 2017, Figures in parenthesis are T-values *Significant at 1%, **Significant at 5%, ***Significant at 10%, MLE: Maximum likelihood estimate, OLS: Ordinary least squares
Test for homogeneity of slope
2 2 2 2 2 2 4 1 2 1 2 e4 e1 e2 e2 e2 c 4 e4 / K K K / K K F 169.2353, K 113
c (169.2353 100.2297 67.2532) / (113 72 36) F 1.5508 1.7524 / 5 1.5508 0.3505 0.8708 1.5508 Here k = 7, N = 120 Ftab = F0.95, 6, 103 = 2.19Since Ft>Fc, we fail to reject the null hypothesis of no differences in the slope parameters.
Test for differences in intercepts
2 2 2 2 3 4 e3 e4 c e3 e4 / K K F
[171.6737 169.2353] / [114.113] 169.233 / 113 (2.4384) / 1 1.4977 = 1.6281 Ftab = F0.95, K-1, N-K F0.95, 1, 118 = 3.92Since Ft>Fcal, we fail to reject the null hypothesis of no difference in the
intercepts production of deep litter and battery cage farming systems.
Technical efficiency in poultry farms: The result of the
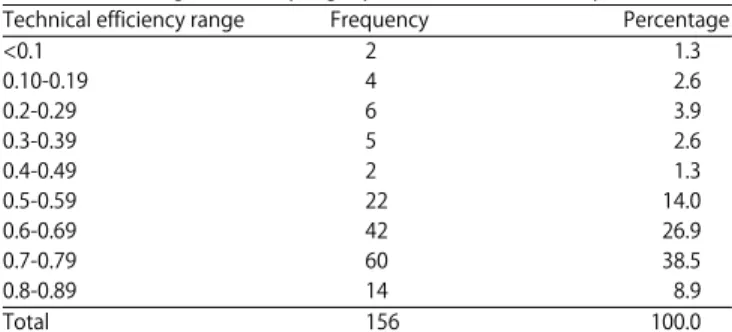
technical efficiency analysis of the battery cage system, deep litter and all forms of poultry production are presented in Table 5. The mean technical efficiency (0.29) of the deep litter system is lower than that of the battery cage system (0.65), which in turn, is lower than that of all farms that have technical efficiency of 0.86. This implies that the battery cage system is more efficient than the deep litter system. However, the result proves that combination of both battery cage and deep litter systems will enhance efficiency.
The technical efficiency of the battery cage and deep litter systems varies from 0.008-0.89 and 0.002-0.99, respectively (Table 6), while that of all farms ranges from 0.005-0.86 (Table 7). The frequency distributions of the technical efficiency of battery cage system shows that most of the farms are within 70 and 79% levels of efficiency, whereas approximately 60% of the deep litter farms have technical efficiency as low as 2% and no greater than 19%. The pooled data, however, show a better picture in that the majority (approximately 70 percent) have technical efficiency that ranges from 50-70%.
Table 5: Decile range for battery cage system technical efficiency
Technical efficiency range Frequency Percentage
<0.1 2 1.3 0.10-0.19 4 2.6 0.2-0.29 6 3.9 0.3-0.39 5 2.6 0.4-0.49 2 1.3 0.5-0.59 22 14.0 0.6-0.69 42 26.9 0.7-0.79 60 38.5 0.8-0.89 14 8.9 Total 156 100.0
Source: Field survey, 2017, Mean efficiency: 0.6502
Table 6: Decile range for deep litter system technical efficiency
Technical efficiency range Frequency Percentage
<0.1 28 33.3 0.10-0.19 22 26.2 0.2-0.29 6 7.2 0.4-0.49 5 11.9 0.5-0.59 4 4.8 0.6-0.69 2 2.4 0.8-0.89 6 7.1 0.9-0.99 6 7.1 Total 84 100.0
Source: Field survey, 2017, Mean efficiency: 0.294
Table 7: Decile range for all farms technical efficiency
Technical efficiency range Frequency Percentage
<0.1 6 2.5 0.10-0.19 16 6.7 0.2-0.29 6 2.5 0.3-0.39 14 5.8 0.4-0.49 26 10.8 0.5-0.59 50 20.8 0.6-0.69 62 25.8 0.7-0.79 52 21.7 0.8-0.89 8 3.3 Total 240 100.0
Source: Field survey, 2017, Mean efficiency: 0.55, Minimum: 0.005 Maximum: 0.863
CONCLUSION
This study has advanced the frontier of knowledge about the efficiency of the battery cage and deep litter modes of poultry production. The results indicate that the battery cage system is more efficient than the deep litter mode of production. While most farmers operating with the battery cage are within 70-79% efficiency, those in the deep litters system are approximately 60% efficient. Therefore, the need exists for better extension activities to encourage farmers adoption of the battery cage system as part of an overall desire to improve the livelihood of smallholder poultry farmers in Nigeria.
SIGNIFICANCE STATEMENT
This study determined that the battery cage system is more technically efficient than the deep litter or scavenging
mode of poultry production in terms of structural differences, the homogeneity of the slope and differences in intercepts; that is, this study confirmed that the production function of the battery cage is superior to that of the deep litter system. For instance, while most farmers using the battery cage achieve a 70-79% technical efficiency, those using deep litter are worse off, with an approximately 60% efficiency. Therefore, the need exists for policies and interventions to encourage the adoption of the battery cage system.
REFERENCES
1. CBN., 2004. Annual report and statement of accounts. Central Bank of Nigeria, Abuja, Nigeria.
2. Adebayo, O.O. and R.G. Adeola, 2005. Socio-economic factors affecting poultry farmers in Ejigbo Local Govt. Area of Osun State. J. Human Ecol., 18: 39-41.
3. Okonkwo, W.I. and C.O. Akubuo, 2001. Thermal analysis and evaluation of heat requirement of a passive solar energy poultry chick brooder in Nigeria. J. Renewal Energy, 9: 2-7. 4. Adeyonu, A., B. Ajiboye, S. Isitor and S. Faseyi, 2017. An
analysis of the factors influencing access to credit by poultry farmers in Abuja, Nigeria. Agric. Conspectus Scient., 82: 55-62.
5. Ajibefun, I.A. and A.C. Daramola, 1999. Measurement and sources of technical inefficiency in poultry egg production in Ondo State, Nigeria. J. Econ. Rural Dev., 13: 85-94.
6. Ojo, S.O., 2003. Productivity and technical efficiency of poultry egg production in Nigeria. Int. J. Poult. Sci., 2: 459-464. 7. Coelli, T., 1995. Estimators and hypothesis tests for a
stochastic frontier function: A Monte Carlo analysis. J. Prod. Anal., 6: 247-268.
8. Bamgbose, A.M., R.M. Sani, M. Sanusi and U.S. Rurun, 1998. Major constraints of poultry production in Bauchi metropolis. Proceedings of the 3rd Annual Conference of Animal Science Association of Nigeria, September 22-24, 1998, Lagos Airport Hotel, Ikeja Lagos, pp: 259-261.
9. Bamiro, O.M., D.O.A. Phillip and S. Momoh, 2006. Vertical integration and technical efficiency in poultry (Egg) industry in Ogun and Oyo states, Nigeria. Int. J. Poult. Sci., 5: 1164-1171.
10. Gueye, E.F., 1998. Village egg and fowl meat production in Africa. Word Poult. Sci. J., 54: 73-86.
11. Alam, J., 1997. Impact of smallholder livestock development project in some selected areas of rural Bangladesh. Livest. Res. Rural Dev., Vol. 9, No. 3.
12. Hill, J., C. Asby and I. Sturgess, 1997. The costs of production in systems which differ in their perceived effects on animal welfare. 1. Eggs and broilers. Outlook Agric., 26: 165-171.