Exploration of the extent and circumstances surrounding
housebreaking/burglary and home robbery 2010–2011
Crime Statistics Series Volume I
Exploration of the extent and circumstances surrounding
housebreaking/burglary and home robbery
In-depth analysis of the Victims of Crime Survey data
2010–2011
Statistics South Africa
Report No. 03-40-02 (2010–2011)
Pali Lehohla
Statistician-General
Crime Statistics Series Volume I
Exploration of the extent and circumstances surrounding housebreaking and home robbery in South Africa based on the Victims of Crime Survey data (In-depth analysis of Victims of Crime data: 2010–2011) / Statistics South Africa
Published by Statistics South Africa, Private Bag X44, Pretoria 0001 © Statistics South Africa, 2014
Users may apply or process this data, provided Statistics South Africa (Stats SA) is acknowledged as the original source of the data; that it is specified that the application and/or analysis is the result of the user's independent processing of the data; and that neither the basic data nor any reprocessed version or application thereof may be sold or offered for sale in any form whatsoever without prior permission from Stats SA.
Stats SA Library Cataloguing-in-Publication (CIP) Data
Exploration of the extent and circumstances surrounding housebreaking and home robbery in South Africa based on the Victims of Crime Survey data (In-depth analysis of Victims of Crime data (2010–2011))/ Statistics South Africa. Pretoria: Statistics South Africa, 2014
Report No. 03-40-02 (2010–2011) 95 pp
ISBN 978-0-621-41564-3
A complete set of Stats SA publications is available at Stats SA Library and the following libraries: National Library of South Africa, Pretoria Division
National Library of South Africa, Cape Town Division Library of Parliament, Cape Town
Bloemfontein Public Library
Natal Society Library, Pietermaritzburg Johannesburg Public Library
Eastern Cape Library Services, King William’s Town Central Regional Library, Polokwane
Central Reference Library, Nelspruit Central Reference Collection, Kimberley Central Reference Library, Mmabatho
This report is available on the Stats SA website: www.statssa.gov.za
Copies are obtainable from: Printing and Distribution, Statistics South Africa Tel: (012) 310 8619
(012) 310 8093 Email: [email protected]
Preface
The Constitution of the Republic of South Africa recognises the importance of freedom and security of every individual within the country’s borders. As a result, safety and security remains a central theme of the Government’s strategies, such as the National Development Plan, which highlights safety as a core human right. It is evident that crime instils fear amongst households and it may hinder their ability to engage in their day-to-day activities. In order to fully understand the multi-faceted dynamics of crime and the extent that it affects the society, there is a need for empirical information that will facilitate evidence based decision making. As a statistical agency, Stats SA is not directly responsible for crime prevention, but it has a mandate to provide information on the nature of crime and victimisation in South Africa.
Crime statistics are mainly produced through administrative data sources within the South African Police Service (SAPS), which are useful in quantifying crime, as well as identifying crime hotspots. However, this data does not always contain information necessary to measure the full extent of crime and relevant demographic and socio-economic indicators related to crime and victimisation. Survey data, from the perspective of the victims, has been used to complement existing administrative data.
Despite the measures that exist to combat crime, it continues to be a challenge for the victims and those responsible for crime prevention. An estimated 730 000 households in South Africa experienced housebreaking/ burglary in 2011 and a further 200 000 households were victims of home robbery, making these crimes the most prevalent household crimes. Although these two crimes are also most feared by households, they remain largely unreported to the police, thus distorting the true magnitude of crime in the country.
This report, the first in a series of thematic crime reports, examined the extent of housebreaking/burglary and home robbery in the country; circumstances around which these crimes occurred, including the time of day, mode of entry, property lost and identity of perpetrator. Consequences of the victimisation experience were also discussed detailing precautionary measures taken to protect the household following the victimisation experience, injury related to resisting robbery and the characteristics of households that are likely to experience victimisation. It is envisaged that the findings presented in this report will provide meaningful information that can assist in assessing the crime situation in South Africa and further aid in expanding the statistical information base in order to strengthen policy formulation.
Mr. Pali Lehohla
Crime Statistics Series Volume I
Content
List of Tables ... vii
List of Maps ... viii
Glossary of abbreviations ... ix
Concepts and definitions ... x
1. Introduction ... 1
1.1 General overview of the safety and security sector ... 1
1.1.1 Legislative framework ... 1
1.1.2 National Development Plan ... 3
1.1.3 Medium Term Strategic Framework and Criminal Justice System ... 4
1.2 Objectives ... 4
1.3 Organisation and presentation of the report ... 5
2. Methodology and limitations ... 6
2.1 Methodology ... 6
2.2 Data analysis ... 6
2.3 Limitations of the study ... 7
3. Findings ... 9
3.1 Extent of housebreaking/burglary and home robbery ... 9
3.1.1 Introduction ... 9
3.1.2 Incidence of victimisation ... 9
3.1.3 Repeat housebreaking/burglary and home robbery victimisation ... 15
3.1.4 Multiple victimisation for housebreaking/burglary and home robbery ... 16
3.2 The circumstances surrounding housebreaking/burglary and home robbery ... 17
3.2.1 Introduction ... 17
3.2.2 Time when housebreaking/burglary occurred ... 17
3.2.3 Mode of entry during housebreaking/burglary ... 18
3.2.4 Type of property commonly lost through housebreaking/burglary or home robbery ... 19
3.2.5 Identity of the perpetrators ... 20
3.3 The consequences of victimisation ... 21
3.3.1 Resistance to home robbery and the likelihood of injury ... 21
3.3.2 Precautionary measures taken by victims to protect their homes after victimisation ... 25
3.4 Reporting of housebreaking and home robbery to the Police ... 27
3.4.1 Reporting trends ... 27
3.4.2 The reasons why victims of housebreaking/burglary and home robbery choose to not report to the police. ... 30
3.4.3 Arrests and convictions related to reporting housebreaking and home robbery ... 31
3.5 Characteristics of household heads of households that were victims of housebreaking/burglary or home robbery and repeat victimisation ... 32
3.6 Neighbourhood characteristics ... 37
3.7 Geographical location characteristics ... 39
3.8 Cluster and outlier analysis for housebreaking and home robbery ... 40
3.8.1 Introduction ... 40 3.8.2 North West ... 41 3.8.3 Limpopo ... 42 3.8.4 Mpumalanga ... 45 3.8.5 Free State ... 47 3.8.6 Gauteng ... 49 3.8.7 Eastern Cape ... 51 3.8.8 Northern Cape ... 53 3.8.9 Western Cape ... 55 3.8.10 KwaZulu-Natal ... 57
4. Conclusions and recommendations ... 59
4.1 Conclusion ... 59
4.2 Recommendations ... 60
5. References ... 62
Crime Statistics Series Volume I
List of Figures
Figure 1: The Chain of events in the criminal justice system ... 2
Figure 2: Change in incidence of household crime between the 1998, 2003, 2007, 2010 and 2011 VOCS ... 10
Figure 3: Type of victimisation as a percentage of total household victimisation in 2011, VOCS 2012 ... 11
Figure 4: Comparison of housebreaking/burglary and home robbery incidents (VOCS 2012 and SAPS 2011/2012) ... 12
Figure 5: Housebreaking/burglary trends for VOCS and police recorded statistics: 2010–2012 (Number in thousands) ... 13
Figure 6: Home robbery incidents by province, 2010–2012 (Number in thousands) ... 14
Figure 7: Monthly distribution of repeat victimisation by crime type in 2011, VOCS 2012 ... 16
Figure 8: Percentage distribution of the period of the day when housebreaking/burglary occurred 2010–2011 ... 18
Figure 9: Percentage distribution common entry methods when housebreaking was committed in 2011, VOCS 2012 ... 19
Figure 10: Percentage distribution of those who knew the perpetrators of crime, by province in 2011, VOCS 2012 ... 20
Figure 11: Percentage distribution of victims who knew the perpetrators by how they knew them in 2011, VOCS 2012 ... 21
Figure 12: Household resistance to home robbery by number of perpetrator in 2011, VOCS 2012 ... 23
Figure 13: Relationship of victim resistance to use of physical force by robbers in 2011, VOCS 2012 ... 23
Figure 14: Percentage of households who changed behaviour after housebreaking/burglary and home robbery by province in 2011, VOCS 2012 ... 25
Figure 15: Percentage distribution of measures taken by citizens to protect themselves against housebreaking/burglary and home robbery in 2011, VOCS 2012 ... 26
Figure 16: Percentage of victimised households feeling safe after taking measures to protect themselves in 2011, VOCS 2012 ... 26
Figure 17: Percentage of incidents of crime reported by households to the police, 2010–2011 ... 27
Figure 18: Percentage of victimised households who were satisfied with police in 2011, VOCS 2012 ... 30
Figure 19: Percentage distribution of the reasons why victims of housebreaking and home robbery chose not to report to the Police in 2011, VOCS 2012 ... 31
Figure 20: Percentage of arrests and convictions related to reporting housebreaking and home robbery in 2011, VOCS 2012 ... 32
Figure 21: Classification tree diagram for VOCS 2011 – housebreaking/burglary ... 34
Figure 22: Classification tree diagram for VOCS 2011-home robbery ... 36
Figure 23: Percentage distribution of neighbourhood Living Standard Measures amongst household that were victims of housebreaking and home robbery in 2011, VOCS 2012 ... 38
Figure 24: Percentage distribution of neighbourhood Living Standard Measures amongst households who had been victimised once and more than once in 2011, VOCS 2012 ... 38
Figure 25: Percentage distribution of housebreaking/burglary and home robbery prevalence by type of police station, VOCS 2011 ... 40
List of Tables
Table 1: Incidence of housebreaking/burglary and home robbery (attempted and successful), VOCS 2012 ... 12
Table 2: Frequency of repeat victimisation for housebreaking/burglary and home robbery in 2011, VOCS 2012 ... 15
Table 3: Percentage of other crime experienced for the households who were victims of housebreaking/burglary or home robbery (multiple victimisation) in 2011, VOCS 2012 ... 16
Table 4: Type of property commonly lost in housebreaking and home robberies, VOCS 2012 ... 20
Table 5: Predictor model for injuries sustained in home robbery ... 22
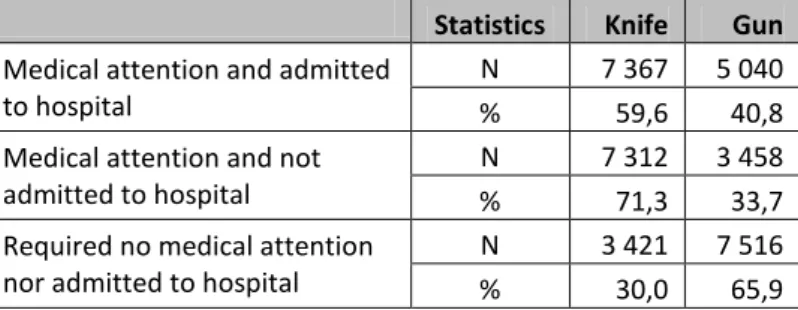
Table 6: Resistance and injury of victims of home robbery by type of weapons used during, 2010-2011 ... 24
Table 7: Household members who needed medical attention and were admitted to hospital when a gun/knife was used, VOCS 2012 ... 24
Table 8: Comparable subset of crimes for VOCS 2011 and SAPS 2011/2012 estimates (numbers in thousands) ... 28
Table 9: Characteristics of the heads of households that were victims of housebreaking and home robbery, 2011 ... 33
Table 10: Parameter estimates from the logistic regression model to predict housebreaking/burglary ... 35
Table 11: Parameter estimates from the logistic regression model to predict home robbery ... 37
Table 12: Percentage distribution of households that were victims of housebreaking/burglary and home robbery by settlement type, 2011 ... 39
Table 13: Percentage distribution of households that were victims of housebreaking/burglary and home robbery by metropolitan municipalities, 2011 ... 39
Crime Statistics Series Volume I
List of Maps
Map 1: Distribution of housebreaking/burglary by province, VOCS 2012 ... 13
Map 2: Distribution of home robbery by province, VOCS 2012 ... 14
Map 3: Percentage distribution of reported housebreaking incidents and satisfaction with the police in 2011, VOCS 2012 .... 28
Map 4: Percentage distribution of reported home robbery incidents in 2011, VOCS 2012 ... 29
Map 5: Cluster and outlier analysis of home robbery in North West, SAPS 2012/2013 ... 41
Map 6: Cluster and outlier analysis of housebreaking in North West, SAPS 2012/2013 ... 42
Map 7: Cluster and outlier analysis of home robbery in Limpopo, SAPS 2012/2013... 43
Map 8: Cluster and outlier analysis of housebreaking in Limpopo, SAPS 2012/2013 ... 44
Map 9: Cluster and outlier analysis of home robbery in Mpumalanga, SAPS 2012/2013 ... 45
Map 10: Cluster and outlier analysis of housebreaking in Mpumalanga, SAPS 2012/2013 ... 46
Map 11: Cluster and outlier analysis of home robbery in Free State, SAPS 2012/2013 ... 47
Map 12: Cluster and outlier analysis of housebreaking in Free State, SAPS 2012/2013 ... 48
Map 13: Cluster and outlier analysis of home robbery in Gauteng, SAPS 2012/2013 ... 49
Map 14: Cluster and outlier analysis of housebreaking in Gauteng, SAPS 2012/2013 ... 50
Map 15: Cluster and outlier analysis of home robbery in Eastern Cape, SAPS 2012/2013 ... 51
Map 16: Cluster and outlier analysis of housebreaking in Eastern Cape, SAPS 2012/2013 ... 52
Map 17: Cluster and outlier analysis of home robbery in Northern Cape, SAPS 2012/2013 ... 53
Map 18: Cluster and outlier analysis of housebreaking in Northern Cape, SAPS 2012/2013 ... 54
Map 19: Cluster and outlier analysis of home robbery in Western Cape, SAPS 2012/2013 ... 55
Map 20: Cluster and outlier analysis of housebreaking in Western Cape, SAPS 2012/2013 ... 56
Map 21: Cluster and outlier analysis of home robbery in KwaZulu-Natal, SAPS 2012/2013 ... 57
Glossary of abbreviations
CAS Case Administration System
CSVR Centre for the Study of Violence and Reconciliation DCS Department of Correctional Services
DME Department of Minerals and Energy
DoJ & CD Department of Justice and Constitutional Development DPME Department of Performance Monitoring and Evaluation DTS Domestic Tourism Survey
DU Dwelling Unit EA Enumeration Area EC Eastern Cape FS Free State
GHS General Household Survey GP Gauteng
JCPS Justice, Crime Prevention and Security KZN KwaZulu-Natal
LP Limpopo
LSM Living Standard Measure MDG Millennium Development Goals MP Mpumalanga
MS Master Sample NC Northern Cape
NDP National Development Plan NPA National Prosecuting Authority NSA National Statistical Agency PSU Primary Sampling Unit
QLFS Quarterly Labour Force Survey RSA Republic of South Africa SA South Africa
SAPS South Africa Police Service
SASQAF South African Statistical Quality Assessment Framework SG Statistician-General
Stats SA Statistics South Africa
UNODC United Nations Office of Drug and Crime VOCS Victims of Crime Survey
Crime Statistics Series Volume I
Concepts and definitions
Absolute measure of the extent of crime (Incidence): The number of crime events occurring during a given time period (i.e. a year) within a specified population. For example, number of home robberies
Assault – attack, physical beating or threat to attack without taking anything from the victim. Note: Includes domestic violence.
Home robbery – unlawful and intentional forceful removal and appropriation of tangible property from residential premises while there is someone at home.
Housebreaking/burglary – unlawful and intentional breaking into a building or similar structure, used for human habitation, and entering or penetrating it with part of the body or with an instrument, with the intention to control something on the premises, intending to commit a crime on the premises, while there is nobody in the dwelling.
Household – a group of persons who live together and provide themselves jointly with food and/or other essentials for living, or a single person who lives alone.
Note: The persons occupy a common dwelling unit (or part of it) for at least four nights in a week on average during the past four weeks prior to the survey interview, sharing resources as a unit. Other explanatory phrases can be 'eating from the same pot' and 'cook and eat together'.
Household head – the main decision-maker, or the person who owns or rents the dwelling, or the person who is the main breadwinner.
Individual crime – crime affecting a single person rather than an entire household.
Living Standard Measure: A Living Standard Measure(LSM) groups people and households into ten distinct groups based on criteria such as their level of urbanisation, ownership of vehicles and major electrical appliances. The measurement is classified from LSM 1 to LSM 10. For the purposes of this report, these categories are combined as follows:
Low LSM: comprising LSM 1 to LSM 4
Intermediate LSM: comprising LSM 5 to LSM 7 High LSM: comprising LSM 8 to LSM 10.
Malicious damage to property – unlawful and intentional damaging of property belonging to another. Note: Excludes forced removals.
Multiple victimisation: Refers to when a household or individual experiences more than one incident of different crime types within a specified reference period.
Perpetrator – person (s) who committed the crime.
Personal property – something belonging to an individual rather than a group of persons.
Physical force – bodily power, strength, energy or might.
Note: In the context of this survey, physical force includes actions where the human body is used to compel/force someone to do something or to hurt or kill someone. It can include actions such as pushing, pressing, shoving, hitting, kicking, throttling, etc.
Prevalence: The percentage or proportion of the specified population (of persons or households) experiencing crime during a given time period.
Property crime – taking something from a person by the use of force or the threat of force, for example, pointing a knife at someone.
Repeat victimisation: Refers to when a household or individual experiences more than one incident of the same crime within a specified reference period.
Robbery involving force – refers to all crimes where a person's property was threatened but not his person such as theft of property, burglary, etc.
Theft – Stealing of property belonging to someone else while they are not aware.
Vandalism – deliberate damage to property belonging to someone else.
Violent crime – crime where a person was threatened, injured, or killed.
Weapon – an instrument used to cause harm or death to human beings or other living creatures.
Crime Statistics Series Volume I
1.
Introduction
The threat of crime creates a climate of fear and anxiety in society and often prevents people from engaging in their day to day activities. South Africans from all walks of life are dissatisfied with their personal safety (Moller, 1995). Levels of crime continue to be of concern in South Africa (SA) in spite of the guarantees of the Constitution of South Africa (Act No. 108 of 1996) that everyone should be protected from all forms of violence, whether from public or private origin.
Incidents of violence emerge from the interaction of different factors, such as family history, social context, environmental factors and/or economic factors. In order to fight crime effectively, comprehensive statistics on patterns of crime and victimisation should be available. During the past two decades a number of studies have been done to provide insight into the nature, and the level of crime in the country, including several victimisation surveys related to crime, crime victims and users of services. Furthermore government departments in the safety and security cluster collected crime related data in accordance with their respective acts. Administrative data collected by the South African Police Service (SAPS) remains one of the main sources of crime statistics. However, questions about under reporting rates have always been a topic of public debate. Some crimes go unreported, and for this reason, neither the victimisation survey results nor the police crime statistics can produce an accurate count of total crime. Integrated information systems that enable evidenced based decision making will go a long way to respond to the South African government’s commitment of providing “a better life for all”1. In addition to direct measures to improve safety and security, the Government’s social development program may also indirectly impact on the levels of crime. For example, one of the primary commitments made by the government is the provision of, and improved access to, permanent housing that provides secure tenure and protection against elements as described in the Housing Act 1997 (Act No. 107 of 1997). The General Household Survey (GHS) (2012) found that there has been a significant improvement in the nature of dwellings in which people live, access to various basic services and facilities and a significant increase in the number of individuals and households who benefit from social grants. All of these provide an important indication of the well-being of household members.
Even though it debatable whether poor living conditions lead to crime, shelter satisfies a basic human need for physical security and comfort. Quality of life is affected by the levels of crime and the fear of crime has an impact on people’s wellbeing.
1.1
General overview of the safety and security sector
1.1.1 Legislative framework
South Africa has a legislative framework in place to address challenges regarding crime in the country, (but programmes initiated to mitigate these legislative objectives should be based on credible information).
The Bill of Rights (Section 12), under the chapter: Freedom and security of the person provides that: “Everyone has the right to freedom and security of the person, which includes the right—
a) Not to be deprived of freedom arbitrarily or without just cause; b) Not to be detained without trial;
c) To be free from all forms of violence from either public or private sources; d) Not to be tortured in any way; and
e) Not to be treated or punished in a cruel, inhuman or degrading way”
Figure 1 demonstrates the chain of events in the criminal justice system. Various departments play a role during this process, but the main role players are:
1. South Africa Police Service
2. Department of Justice and Constitutional Development 3. National Prosecuting Authority
4. Department of Correctional Services
Figure 1: The Chain of events in the criminal justice system2
Even though there are several Government departments active in the safety and security cluster, the primary agency responsible for law and order is the South African Police Service (SAPS). The Constitution of the Republic of South Africa (1996) stipulates that “the South African Police Service has a responsibility to prevent, combat and investigate crime, maintain public order, protect and secure the inhabitants of the Republic and their property, uphold and enforce the law, create a safe and secure environment for all people in South Africa, prevent anything that may threaten the safety or security of any community, investigate any crimes that threaten the safety or security of any community, ensure criminals are brought to justice and participate in efforts to address the causes of crime.”3
Crime Statistics Series Volume I
The SAPS derives its mandate from Section 205 of the Constitution, 1996 (Act No. 108 of 1996). The objectives of policing are to:
o prevent, combat and investigate crime
o maintain public order
o protect and secure the inhabitants of the Republic and their property
o uphold and enforce the law.
Other departments that play a direct role in safety and security include: the National Prosecution authority (NPA) whose primary role is to prepare cases for prosecution on behalf of the state, the Department of Justice and Constitutional Development (DoJ & CD) which is responsible for the administration of justice through the court system and the Department of Correctional Services (DCS).
A single NPA was created in Section 179 of the Constitution of the Republic of South Africa, 1996 (Act No. 108 of 1996), and it has the power to:
a) Institute and conduct criminal proceedings on behalf of the State.
b) Carry out any necessary functions incidental to instituting and conducting such criminal proceedings (this includes investigation).
c) Discontinue criminal proceedings.
The DoJ & CD administer the justice function through a tiered court system which includes: the Constitutional Court; the Supreme Court of Appeal in Bloemfontein; the High Courts with fourteen provincial divisions; Circuit Courts which are also part of the High Court; Special Income Tax Courts which sit within provincial divisions of the High Court; Labour Courts and Labour Appeal Courts; Land Claims Court; the Water Tribunal; the Truth and Reconciliation Commission (TRC); the Magistrates’ Courts which deal with the less serious criminal and civil cases; the Small Claims Courts; the Community Courts; Equality Courts; Child Justice Courts and Maintenance Courts; Sexual Offences Courts; Children’s Courts and Courts for Chiefs and Headmen. The latter have jurisdiction to hear certain matters on the level of magistrate’s courts and primarily deal with issues related to customary law. Finally the vision of the Department of Correctional Services (DCS) is to ‘contribute to a just, peaceful and safer South Africa through effective and humane incarceration of inmates, rehabilitation and social reintegration of offenders’.4 The DCS has three strategic goals:
Goal 1: Effective criminal justice through the effective management of remand processes
Goal 2: Society is protected through incarcerated offenders being secure and rehabilitated
Goal 3: Society is protected by offenders being reintegrated into the community as law abiding citizens
1.1.2 National Development Plan
The government has recognised the need for an intervention; and safety and security has been identified as one of the strategic priorities of the government in both the National Development Plan 2030 and the Medium Term Strategic Framework. In its introduction, the National Development Plan (NDP) 2030 highlights that safety is a core human right and a necessary condition for human development and improving productivity. The NDP therefore proposes, as one of its strategic priorities, that crime be reduced through strengthening the criminal justice system and improving community environments. It is further stated in the plan that by 2030, “people
4
living in South Africa should have no fear of crime. Women, children and those who are vulnerable should feel protected.”
1.1.3 Medium Term Strategic Framework and Criminal Justice System
One of the broad strategic frameworks of the MTSF (2009-2014) is that all people: “All People in South Africa Are, and Feel Safe”.
As part of this process, the Justice and Crime Prevention and Security (JCPS) Cluster in partnership with the DPME have developed an outcome-based monitoring and evaluation framework for the priorities as contained in the Medium-term Strategic Framework for the period 2009 to 2014. For the priority, “Intensify the fight against crime and corruption”, a broad outcome for the JCPS was developed, namely “Ensure that all South Africans are and feel safe”5
Among other things the strategy focuses on:
Mobilising the population in the fight against crime;
Accelerating efforts to reduce all serious crimes by the set target of 7–10% per annum (the January 2010 Cabinet Lekgotla changed the target to 4–7% over the period 2009-2013);
Intensifying efforts to combat crimes against women and children and the promotion of the empowerment of victims of crime; and
Combating corruption in the public and private sector
Data collected by Stats SA and other agencies should be used to assist in this regard as a complementary source of crime statistics to the statistics already provided within the JCPS cluster.
1.2
Objectives
This report is the first in a series of Victims of Crime Survey (VOCS) thematic reports aimed at providing an in-depth understanding of victimisation phenomena. This report primarily focuses on housebreaking/burglary and home robbery. The main objective of this study is to use the historical VOCS data to provide statistical measures of trends and conditions about housebreaking/burglary and home robbery in South Africa between 2010 and 2011. More specific questions that were addressed include:
1. What was the status of housebreaking/burglary and home robbery in SA in 2011?
2. What do the indicators on housebreaking/burglary and home robbery reveal about the likelihood of households being victimised?
3. Are there specific household characteristics that can explain why households were victimised? 4. What measures are to be taken by victims to avoid injury during home robbery?
5. What were the precautionary measures taken by victims to protect homes and property after the victimisation experience?
Victimisation surveys aim to provide information about the dynamics of crime from the perspective of households and the victims of crime. The results complement administrative data collected by the SAPS who release figures of crime that were reported to them, as well as crime that they detected. Victimisation surveys and police administrative crime data provide complimentary information on the crime situation in South Africa. The results
Crime Statistics Series Volume I
of this report could be used for the development of policies and strategies, as well as crime prevention and public education programmes.
Details about the methodology and limitations of the study can be found in Section 2.
1.3
Organisation and presentation of the report
This report has four main sections. In Section 1 the general overview of the Safety and Security sector and the objectives of the report are provided. Section 2 outlines the methodology and data analysis techniques used in the report and points out some of its limitations. The third section provides a detailed exposition of the findings of the report, while the conclusions and recommendations can be found in Section 4.
2.
Methodology and limitations
2.1
Methodology
This study used the Victims of Crime Survey (VOCS) data series (2010–2011) as indicated in the objectives. VOCS is based on a random sample of approximately 30 000 dwelling units (DU) drawn from 3 080 Primary Sampling Units (PSUs) across the country. By drawing on a representative sample of the population and systematically covering a range of crime types, the survey provides statistically representative data across a specified geographic area that fills the gaps in administrative data due to under-reporting.
The sample design for the VOCS 2012 used the Stats SA Master Sample (MS). The MS design is based on information collected during the 2001 Population Census conducted by Stats SA. The MS has been developed as a general-purpose household survey frame that can be used by all household-based surveys irrespective of the sample size requirement of the survey. The VOCS 2012 used a MS of primary sampling units (PSUs) which comprise census enumeration areas (EAs) drawn from across the country. The sample was designed to be representative at provincial level.
A questionnaire with a standardised set of questions was used during data collection. The questionnaire is administered using face-to-face interviews by trained survey officers. The VOCS 2012 interviews were conducted from January 2012 to March 2012 and they referred to crime that occurred in the previous calendar year, i.e. from January 2011 to December 2011. The VOCS 2012 sample was weighted using population estimates for mid-November 2011. The final weights were benchmarked to the known population estimates of 5-year age groups by population groups and gender at national level, and broad age groups at provincial level. The VOCS had an additional selection process where one person, aged 16 years or older, was randomly sampled in each household to complete sections on the individual experience of crime. The individual weights were benchmarked to an estimated national population of persons aged 16 and older as of mid-November 2011. The final survey weights were used to obtain the estimates for various domains of interest at household level, for example, victimisation level in South Africa and South African perceptions of crime levels in the country. More details related to the sampling and fieldwork methodology can be found in the VOCS (2011) and VOCS (2012) reports.
2.2
Data analysis
The statistical analysis programs SAS 9.3 and SAS Enterprise Guide 4.3 were used for statistical analysis and ArcMap 10 for spatial data analysis.
Missing and unknown values were excluded from totals used as denominators for the calculation of percentages, unless otherwise specified. Frequency values have been rounded off to the nearest thousand. In addition to the use of basic descriptive statistics, multivariate techniques such as multinomial logistic regression and Chi-squared Automatic Interaction Detection (CHAID) tests were also used for selected indicators. CHAID is a type of decision tree technique, based upon adjusted significance testing and can be used for prediction classification, and for detection of interaction between variables.
Several composite data sets were constructed during the analysis process. These included:
Living Standards Measure (LSM) Data from the Domestic Tourism Survey (DTS) were merged with the Victims of Crimes Survey (VOCS) in order to attribute LSM feature to the PSUs sampled in VOCS based on the assumption that neighbourhoods have relatively uniform LSM characteristics. This was made possible
Crime Statistics Series Volume I
by the fact that the two surveys were drawn from the same master sample and even though different dwelling units were visited most PSUs were shared by the two surveys.
The VOCS and South African Police Services (SAPS) data was merged spatially to analyse crime by rural-urban police station boundaries in order to look at the victimisation survey data within the context of the two types of policing areas. In cases were the police station geographical boundaries differed from Census 2001 enumeration areas (EA’s) the nearest neighbour profile was analysed and data was allocated according the (80/20)% decision rule. This means that all the polygons with areas greater or equal to 80% or less or equal to 20% were to remain with the policing area greater or equal to 80%. Areas between 20 and 80 were manually investigated and the link was assigned based on dwelling unit distribution and the size of the policing area. The following decision rules were used during this process:
o The PSU with the most dwellings was assigned to the policing area.
o In the case of the same number of dwellings, than the PSU area/size was used (the biggest PSU got the policing area ID).
South African Police Services (SAPS) boundaries were merged with Census 2011 data. This was done in order to superimpose the administrative records of reported crimes onto the Census 2011 data frame to firstly determine crime hotspots and thereafter conduct spatial regression analysis. Similar decision rules as described in the preceding paragraph were used during this process.
Thematic maps of crime in each province were created so as to see the general pattern of crime and where in the country it occurs. A spatial autocorrelation (Moran I), was performed to establish if a relationship exists in the data, as well as to investigate the possibility of clustering. The spatial autocorrelation determines whether or not the analysis needs to be done. Without clustering it is fruitless to do any analyses which are based on the clusters such as hot spot analysis. Once the spatial autocorrelation has confirmed clustering within an area under study, a hot spot analysis (Getis-Ord GI*) is conducted. The hot spot analysis is performed to show in which areas the clusters of crime are found and if the clusters are high value clusters (hot spot) or low value clusters (cold spots). Once this is done, a cluster and outlier analysis (Anselin Local Moran’s I) is done to identify statistically significant hot spots, cold spots and spatial outliers. These three processes were done for the provinces as well as for metropolitan areas to get a more in-depth understanding of the patterns of crime.
2.3
Limitations of the study
It should be noted that the data from VOCS 2011 and 2012 were collected between January and March, and survey data is based on respondent recall, while the police records covered incidents that were reported as they happened from April to March of each financial year.
Victimisation surveys are likely to produce higher crime estimates than police-recorded administrative data. This is due to the fact that many crimes are not reported to the police. Victim surveys deal with incidents which may not necessarily match the legal definitions of crime. Although data from crime victim surveys are likely to elicit better disclosure of criminal incidents than data from police records, they can also be subject to undercounting, as some victims may be reluctant to disclose information, particularly for incidents of a sensitive nature, such as sexual assault. The accuracy of statistics in victimisation surveys is influenced by the ability of people to recall past victimisations. The longer the elapsed time period, the less likely it is that an incident will be recalled accurately. Surveys are also subject to sampling and non-sampling errors. Stats SA has since however changed its data
collection methodology to a continuous data collection methodology, the results of which will be published in 2014.
Comparisons between the SAPS administrative data and the VOCS data deal with slightly different reference periods. In the report the VOCS data for 2010 refer to the reference period January to December 2010, whilst the police data would refer to the period April 2010 to March 2011. The same is true for the VOCS 2012 with reference period January to December 2011 which was then compared to the police administrative data for the period April 2011 to March 2012.
It should be noted that due to a printing error in the questionnaire used for VOCS 2011 (recall period 2010) there was a vague delimitation between housebreaking/burglary and home robbery which may influence the comparison of the incidences of these two crimes between 2010 and 2011.
Crime Statistics Series Volume I
3.
Findings
3.1
Extent of housebreaking/burglary and home robbery
3.1.1 Introduction
Key objectives of this report are to provide an in-depth understanding of housebreaking/burglary and home robbery in South Africa. Although there may be similarities between home robberies and housebreaking/burglary, the distinct characteristic that differentiates home robbery from housebreaking/burglary is that there is contact between the victim and the perpetrator during a home robbery, whereas there is no direct contact between the victim and perpetrator during housebreaking/burglary. Crimes that occur at residential premises, especially housebreaking/burglary and home robbery have a potential to violate basic human needs for physical security and comfort. Unlawful entry into someone’s property, regardless whether they are present or not, can be traumatic to those affected and may also lead to individuals and households becoming victims of multiple crimes (multiple victimisation is discussed in Section 3.1.4).
This section focuses on the incidence of victimisation, including repeat and multiple victimisations. A distinction should however be drawn between repeat victimisation and multiple victimisations. Repeat victimisation refers to when a household experiences more than one incident of the same crime within a specified reference period, while multiple victimisations refer to a household experiencing different crime types once or more often within a specified reference period.
As indicated in Section 2, Stats SA’s Victims of Crime Survey is used to provide statistical measures of trends and conditions about housebreaking/burglary and home robbery in South Africa. Most of the figures and tables refer to the 2010 and 2011 calendar years. Sometimes there are references to the VOCS 2011 and VOCS 2012 and it is important to note as indicated in section 2, that the VOCS 2011 measured crimes that occurred between January 2010 and December 2010, whilst VOCS 2012 measured crimes that occurred between January 2011 and December 2011. In some, albeit limited instances, it was possible to refer to older victimisation surveys that were conducted in 1997 and 2004 respectively. Where data from these surveys are included it will be indicated as such. Data from SAPS was used as a complimentary source to aid the exploration of the extent of victimisation. Where SAPS data was used, the periods under review are the 2010/2011 and 2011/2012 financial years. It will further highlight results relating to the prevalence of housebreaking/burglary or home robbery.
3.1.2 Incidence of victimisation
Crime is a topic commonly discussed among households and frequently features in the media. The Victims of Crime survey included questions that asked about household crimes experienced by South African households.
Figure 2 shows trends shared by different crime types. The results indicate that incidents of household crime have remained fairly stable over the years, where crime rates showed a general decline since 1998. Figure 2 reflects the percentage of households that have been victimised at least once between 1998 and 2011. In 2010, 4,5% of households had been the victims of housebreaking/burglary in the preceding 12-month period, compared to 5,4% in 2011. While the rate of most crime types has decreased since 1998, housebreaking/burglary has increased by 0,9% point in 2011.
Figure 2: Change in incidence of household crime between the 1998, 2003, 2007, 2010 and 2011 VOCS 1998 2003 2007 2010 2011 Car theft 1,2 1,0 1,3 0,7 0,5 Housebreaking/burglary 7,2 7,5 7,2 4,5 5,4 Home robbery 2,6 1,5 Theft of livestock 4,9 2,5 1,8 1,4 1,3 Theft of crops 0,7 0,1 0,3 0,3 Murder 0,5 0,2 0,4 0,1 0,1
Theft from car 2,5 2,5 1,9 1,3 1,2
Deliberate damaging of
dwellings 1,1 0,9 0,4 0,4 0,4
Motor vehicle vandalism 1,3 1,3 0,7 0,6 0,4
0,0 1,0 2,0 3,0 4,0 5,0 6,0 7,0 8,0 P er ce n ta ge
Note: A question on home robbery was not included in VOCS 1998-2007
The results presented in Figure 3 provide estimates of all household crimes as measured in the 2012 survey. Housebreaking/burglary was the most common category and it constituted about 49% of household crimes, while home robbery was the second most experienced household crime, where it constituted about 13% of household crimes. Theft of livestock (12%) was the third most experienced household crime in 2011. Housebreaking/ burglary and home robbery accounted for more than sixty per cent of the measured household crimes.
Crime Statistics Series Volume I
Figure 3: Type of victimisation as a percentage of total household victimisation in 2011, VOCS 2012
As discussed in Section 1, VOCS alone cannot provide a comprehensive picture of crime committed against households in South Africa as it is based on a sample survey. The results obtained from other sources, more particularly the SAPS will be used as complementary sources,primarily for trends in relation to the levels of crime. For any set of statistics to be meaningful, it is important to look at trends and make comparisons over time. When the data are not organised using consistent underlying principles, it can be difficult to make such comparisons. The VOCS determines the level of crime perpetrated against households in South Africa. When the victimisation survey is compared to police statistics, the victimisation survey tends to provide more in-depth information on the risk profile of the victim (Centre for the Study of democracy, 2005), as well as information on unreported crimes. Police statistics on the other hand provide more accurate information on reported crime as there is a shorter time lapse between the incident and the time of reporting.
The VOCS included a question that asked the respondent about the crime they had experienced in the last five years prior to the survey. Table 1 shows that about 1 870 250 million households in South Africa were victims of housebreaking/burglary from 2007 to 2011. From about 830 000 attempted incidents of housebreaking/burglary in 2011, an estimated 730 000 were successful. SAPS however recorded about 246 000 incidents of housebreaking/burglary in 2011 (Figure 4).
South Africa experienced an estimated 2,1 million cases of serious crimes in the 2011/2012 financial year. About 29,9% of these serious crimes were from a category of contact or violent crimes (SAPS, 2012).SAPS 2011/12 indicated that home robbery, as a subcategory of robberies, accounted for about 16,5% of aggravated robberies. This was the second largest contributor in the broader category of robbery with aggravating circumstances, which include street robbery, carjacking and robbery at business premises, amongst others. The SAPS crime statistics for the 2011/2012 financial year show that there were 16 766 cases of home robbery that were reported to the police. The latest results from SAPS indicated that about 17 950 000 households in South Africa were victims of home robbery in the 2012/2013 financial year.
VOCS 2012 found that about 600 499 households were the victims of home robbery between 2007 and 2011. More than 246 000 attempted counts of home robbery were recorded in 2011 and about 200 000 of them were successful. The large gap between the numbers of victimisation experienced based on VOCS 2011-2012 and the number of housebreaking/burglary and home robbery incidents recorded in the police stations can be attributed to under-reporting to the police. The reasons for not reporting victimisation to the Police are discussed in Section 3.4.
Approximately nine out of ten attempted housebreaking/burglary and eight out of ten attempted home robbery incidents were successful in 2011. The large number of incidents of attempted criminal activity raises serious social issues in terms of the well-being and security of households and requires the strengthening of crime prevention measures such as neighbourhood watches, increased police visibility and other community cohesion activities.
Table 1: Incidence of housebreaking/burglary and home robbery (attempted and successful), VOCS 2012 Type of crime
Experienced between
2007 and 2011 Attempted in 2011 Successful in 2011
Housebreaking/burglary 1 870 250 831 105 730 077
Home robbery 600 499 246 128 199 387
Figure 4: Comparison of housebreaking/burglary and home robbery incidents (VOCS 2012 and SAPS 2011/2012)
Figure 5 reflects the provincial distribution of housebreaking/burglary in 2011. The 2011/2012 police records revealed that the highest incidence of housebreaking/burglary incidents were in Gauteng (65 000), Western Cape (45 000) and KwaZulu-Natal (41 000), while Northern Cape, North West, Free State and Limpopo recorded the least. Gauteng, Western Cape and KwaZulu-Natal were also the provinces that recorded high incidents as indicated by VOCS 2012. The results of VOCS 2012 and SAPS also show similar trends in relation to provinces with the least incidents of housebreaking/burglary. Provinces with metropolitan municipalities experienced relatively high incidents of housebreaking/burglary when compared to provinces with non-metropolitan municipalities.
Crime Statistics Series Volume I
Figure 5: Housebreaking/burglary trends for VOCS and police recorded statistics: 2010–2012 (Number in thousands)
Housebreaking/burglary was the most prevalent crime in 2011, experienced at least once by 5,4% of South African households. Even though the more populous provinces such as Gauteng and KwaZulu-Natal have high incidences of crime, the relative incidence can best be determined as the percentage of the population affected by that crime. Map 1 below shows housebreaking/burglary prevalence rates in South Africa. The VOCS 2012 highlighted that housebreaking/burglary was mostly prevalent in Western Cape (6,5%), followed by Mpumalanga (6,4%) and KwaZulu-Natal (5,8%), while it was least prevalent in Limpopo (4,2%) and Northern Cape (4,5%).
Figure 6 shows incidents of home robbery in residential areas, as recorded by SAPS and in VOCS. SAPS recorded statistics showed similar trends across provinces between 2010/11 and 2011/12, with Gauteng and KwaZulu-Natal contributing more than other provinces in this type of crime. The results of the VOCS show a similar trend, with Northern Cape being the province with the least incidence of home robbery in 2011.
Figure 6: Home robbery incidents by province, 2010–2012 (Number in thousands)
* SAPS Northern Cape estimates were less than thousands
Home robbery was experienced at least once by 1,5% of South African households in 2011. Map 2 below represents home robbery prevalence rates within the provinces. VOCS 2012 revealed that home robbery was mostly prevalent in Mpumalanga (2,1%), followed by Limpopo (1,7%), while it was least prevalent in Northern Cape (0,7%) and Free State (0,9%).
Crime Statistics Series Volume I
3.1.3 Repeat housebreaking/burglary and home robbery victimisation
Understanding the nature of repeat victimisation will allow for the more efficient allocation of crime prevention efforts and resources. Farrell, Chenery and Pease, (1998) identified several factors which are related to repeat victimisation, for example living in a bad area and living a vulnerable lifestyle. Morgan (2001) attributed the likelihood of future burglary experiences to the occurrence of previous victimisations. Although this may have little to do with the characteristics of an individual household, Morgan (2001) was of the view that the experience of repeat burglary was influenced by the attractiveness and accessibility of the neighbourhood to potential burglaries. This repeat victimisation, where an individual or household experiences the same crime more than once, is not limited to housebreaking/burglary, but may occur for a range of other crimes.
The results from previous sections provide a total volume of victimisation, but give no insight into how victimisation is distributed. The VOCS has a question that asks the respondents who experienced a particular crime, how many were successful during the 12 months prior to the survey collection period. Table 2 below presents the frequency of housebreaking/burglary and home robbery victimisation. About five per cent (4,8%) of households experienced housebreaking/burglary during that period. Among households that were victims of housebreaking/burglary, 88,6% were burgled once, 7,8% were victimised twice and 3,5% three or more times. The results also show that about 1,5% of households had experienced at least one incident of home robbery in 2011. Among households that were victims of home robbery, 89,8% were robbed once, 8,0% twice and 2,2% experienced it three or more times.
About 11,3 % of those who had experienced housebreaking/burglary in 2011 experienced it more than once, while an estimated 10,2% victims of home robbery experienced it more than once. Although the differences are marginal between repeat housebreaking/burglary and home robbery victimisation, victims of housebreaking/burglary tended to be more likely to be victimised repeatedly. The results of the VOCS 2012 indicated that it is possible for a household to be victimised more than once for the same crime type, although the survey data is limited in that it does not identify whether other types of crimes that were reported occur simultaneously with housebreaking/burglary or home robbery.
Table 2: Frequency of repeat victimisation for housebreaking/burglary and home robbery in 2011, VOCS 2012
Frequency of victimisation
Housebreaking/burglary Home robbery
Prevalence Percentage of those victimised Prevalence Percentage of those victimised Once 4,8 88,6 1,3 89,8 Twice 0,4 7,8 0,1 8,0
Three times or more 0,2 3,5 0,0 2,2
Prevalence 5,4 N/A 1,5 N/A
Figure 7 presents the results of the frequency of victimisation for housebreaking/burglary and home robbery respectively. Repeat housebreaking/burglary occurred mostly in the months of June (13,8%), November (13,7%) and December (13,1%). Overall, the findings suggest that households are most likely to be victimised during winter seasons as well as during the festive season. About 17,1% of repeat home robbery victimisation occurred in July 2011, followed by November (15,3%) and December (13,4%).
Figure 7: Monthly distribution of repeat victimisation by crime type in 2011, VOCS 2012
3.1.4 Multiple victimisation for housebreaking/burglary and home robbery
This report also analyses the phenomenon of multiple victimisation, which refers to when the same person or household suffered from more than one criminal incident over the twelve months preceding the survey. Table 3 shows other victimisation experiences that victims of housebreaking/burglary and home robbery had during 2011. Victims of housebreaking/burglary who were also victims of other crimes in 2011 were mostly affected by vehicle related criminality (theft from a car (2,3%), car theft (1,6%) and motor vehicle vandalism (1,9%)). The results also show that theft from a car (2,4%) frequently occurred amongst victims of home robbery followed by theft of crops (2,1%) and theft of livestock (2,0%).
Table 3: Percentage of other crime experienced for the households who were victims of housebreaking/burglary or home robbery (multiple victimisation) in 2011, VOCS 2012
Crime type
Housebreaking/burglary Home robbery
Crime experienced No crime experienced Crime experienced No crime experienced Car theft 1,6 98,4 0,6 99,4 Theft of livestock 1,0 99,0 2,0 98,0 Theft of crops 0,2 99,8 2,1 97,9
Theft from car 2,3 97,7 2,4 97,6
Deliberate damage of property 1,1 98,9 0,5 99,5
Motor vehicle vandalism 1,9 98,1 1,5 98,5
Crime Statistics Series Volume I
3.2
The circumstances surrounding housebreaking/burglary and home robbery
3.2.1 Introduction
This section describes the circumstances under which housebreaking/burglary or home robbery took place, that is, period of the day when housebreaking/burglary occurred, how the burglar gained entry, mode of entry, property lost and victim relationship to the offender.
3.2.2 Time when housebreaking/burglary occurred6
Housebreaking/burglary can occur at any time of the day, although there are times when citizens are more vulnerable to victimisation. The time of day usually gives an indication of visibility; morning hours are associated with light whilst night hours are associated with darkness.
Nee (2003) found that burglars were often more knowledgeable than their victim(s), and were both systematic and rational in their approach towards targeting their potential victim(s). After carefully evaluating the potential risks and rewards associated with it, Coupe and Blake (2006) further asserted that to commit housebreaking/burglary was a rational decision by the offender. A perpetrator of housebreaking/burglary was likely to target residential premises that would minimise the risk of being seen, although there are factors such as the accessibility of the target house and the routine activities of victims which create burglary opportunities. In the Victims of Crime Survey, respondents were asked to indicate the time of the day when housebreaking/burglary occurred in order to determine the conditions under which housebreaking/burglary was likely to take place. Figure 8 represents the distribution of the timing of housebreaking/burglary incidents in South Africa, as reported by the Victims of Crime Survey. In 2010, about 30,4% of housebreaking/burglary incidents occurred at night, the period associated with darkness, followed by afternoon (22,0%) and morning (15,9%) hours. About 12% of housebreaking/burglary incidents in 2010 took place in the evening hours, while the least (2,9%) happened at dawn. A similar pattern of incidents was observed in 2011, where most incidents (27,5%) occurred at night and the least (4,6%) at dawn, (VOCS, 2012).
Changes in daylight and darkness influence the likelihood of housebreaking/burglary. The results presented in Figure 8, suggest that darker hours heighten the likelihood of housebreaking/burglary incidents, hence incidents that occur in the evening tend to be lower than incidents that occur late at night. This may be attributed to households’ activity around their residence, which is expected to be higher in the evening hours than in the late hours of the night and it is possible that higher levels of activity during evening hours may be a deterrent to potential burglaries which per definition takes place without physical contact between the victim and perpetrator.
6 The question relating to the period of the day when home robbery occurred was not asked in the VOCS 2012, therefore no analysis can be performed on the period of the day when home robbery occurred
Figure 8: Percentage distribution of the period of the day when housebreaking/burglary occurred 2010–2011
3.2.3 Mode of entry during housebreaking/burglary7
There are various ways in which intruders can unlawfully gain entry into a residence. Such unlawful entry violates the households’ privacy and may potentially harm the household members. Figure 9 depicts common entry methods used when housebreaking was committed in 2011. The Victims of Crime Survey revealed that forced entry was popular in burglaries that were committed in 2011; where in about 44% of the burglaries, doors were smashed in order to gain access to the residence. Window entry occurred in 34,7% of the burglaries that took place in 2011. Other methods of entry such as entry through the roof or where the door was left open, collectively accounted for 8,5% of entry methods used when housebreaking was committed. VOCS (2012) indicated that entry through the garage (4,2%) or by using duplicate keys (4,5%) were the least common.
The most popular method of entry used by perpetrator(s) during housebreaking/burglary was through a door, followed by through a window. The perpetrator may also have smashed the door or found the window unlocked or broke it. It is important to note that households may have left the house unlocked without anyone available. Furthermore the VOCS is limited by the fact that it does not ask whether the perpetrator(s) smashed the window or the window was open.
Crime Statistics Series Volume I
Figure 9: Percentage distribution common entry methods when housebreaking was committed in 2011, VOCS 2012
Note: The question on how the burglar gained entry into the house was not asked for home robbery, therefore no information is available
3.2.4 Type of property commonly lost through housebreaking/burglary or home robbery
A variety of items can be stolen in a housebreaking/burglary or home robbery. Table 4 depicts the distribution of the categories of items that were stolen from South African households in 2011. Electronic equipment, such as laptop computers and television sets were burglars’ preferred goods. The Victims of Crime Survey (2012) found that 58,6% of households who experienced housebreaking/burglary had lost electronic equipment in the incident, compared to 43,2% of households who experienced home robbery. Personal belongings (watches, jewellery, etc.) were stolen in 30,4% of household burglary incidents, followed by money (23,3%). Items like handbags/wallets (10,9%) and travelling bags (8,2%) were the least likely to be stolen in burglaries. These findings confirm Fitzgerald and Poynton’s (2011) assertion that burglars are interested in items that are of high value or can be easily disposed of. Money was popular in burglaries because unlike other items, it does not have to be re-sold.
The perpetrators of home robbery appear to be more interested in items that are easily accessible. About 38,8% of households had their cell phones taken away from them, while about 33,7% of households lost their money and 28,9% lost their personal belongings items such as watches etc. Travelling bags (2,6%) were the least likely to be stolen in home robberies. The findings of VOCS (2012) suggest that home robbers were more likely to steal items that have a high re-sale value than items that could not easily be sold.
Table 4: Type of property commonly lost in housebreaking and home robberies, VOCS 2012 Type of item
Housebreaking/burglary Home robbery
Per cent Per cent
Electronic equipment 58,6% 43,2% Personal belongings 30,4% 28,9% Money 23,3% 33,7% Cell phone 20,8% 38,8% Hand-bag/wallet 10,9% 19,3% Travelling bag 8,2% 2,6%
3.2.5 Identity of the perpetrators
Although there may be similarities between home robberies and housebreaking/burglary, the distinct characteristic that differentiates home robbery from housebreaking/burglary is that there is contact between the victim and the perpetrator during a home robbery, whereas there is no direct contact between the victim and perpetrator during housebreaking/burglary. Due to the nature of home robberies as compared to housebreaking/burglary, it is expected that a greater proportion of home robbery victims would have some knowledge about the perpetrator than victims of housebreaking/burglary. Such information or knowledge becomes instrumental for the police when gathering evidence.
The VOCS (2012) asked victims of these two crimes if they knew who could have committed these crimes against them. Figure 10 below shows the provincial distribution of victim households that were robbed or fell victim to housebreaking/burglary and knew something about the perpetrator or the suspect. Eastern Cape (32,9%) and Northern Cape (28,1%) had the highest percentage of households that suspected that they knew the perpetrators of residential burglaries. Households in Gauteng (15,0%) and KwaZulu-Natal (17,8%) were the least likely to know the perpetrator of housebreaking/burglary.
Free State had the highest proportion (45,3%) of households that reported that they knew who the perpetrator of the home robbery was, followed by Eastern Cape (43,3%) and Northern Cape (42,7%). Mpumalanga (27,9%) and Limpopo (29,9%) showed the lowest proportions of households that had knowledge about the perpetrators of home robberies.
Figure 10: Percentage distribution of those who knew the perpetrators of crime, by province in 2011, VOCS 2012
WC EC NC FS KZN NW GP MP LP RSA Know burglar 26,5 32,9 28,1 24,2 17,8 21,5 15,0 25,4 18,1 21,3 Know robber 39,3 43,3 42,7 45,3 31,7 35,3 31,2 27,9 29,9 34,0 0,0 5,0 10,0 15,0 20,0 25,0 30,0 35,0 40,0 45,0 50,0 P erc enta ge
Crime Statistics Series Volume I
Figure 11 illustrates the distribution of how the victims of home robberies and housebreaking/burglary think they knew the perpetrators. Among the households that knew the suspects that committed home robbery against them, about six in every ten (59,0%) knew the suspects by face or name. An estimated 14,1% of households knew the suspects, because they have witnessed the theft and about a tenth (10,2%) had general community knowledge of who commits robberies in their area. About half (49,0%) of housebreaking/burglary victims knew the perpetrators by name or face, while 20,4% indicated that other people had witnessed the theft and 17,9% had a general community knowledge of who commits burglaries in their area.
In instances where victims have identified or know their perpetrators it should be noted, that these victims might even require further protection to avoid perpetrators further threatening them should they intend to report matter to the police.
Figure 11: Percentage distribution of victims who knew the perpetrators by how they knew them in 2011, VOCS 2012
3.3
The consequences of victimisation
3.3.1 Resistance to home robbery and the likelihood of injury
This section assesses the likelihood of serious victim injury in home robbery and the role of victim resistance in escalating the level of violence. Home robberies are usually dual in nature; having both the elements of property crime and being violent in nature. Violence associated with robberies, usually unprovoked and unexpected, makes residential robberies serious and induces fear in the victims. This interaction between perpetrator and victims is what commonly leads to violence in home robberies. Violence or contact crime is viewed as a serious social problem in most societies. Cook (1986) asserted that although losses during robbery may be negligible, it is the elements of violence that make this type of crime a serious crime. The use of violence in robberies often results in personal injury or emotional trauma which violates victims at home, a place where they are supposed to feel safe. Studies around housebreaking/burglary and home robbery have also found that despite offenders displaying violent and aggressive behaviour towards victims, they [generally] take little pleasure in intimidating and injuring them (Gill, 2000). Furthermore, perpetrators use violence or the threat of violence when entering a residence only to overcome resistance from the victims (Newham, 2008). These findings are confirmed by the VOCS data.
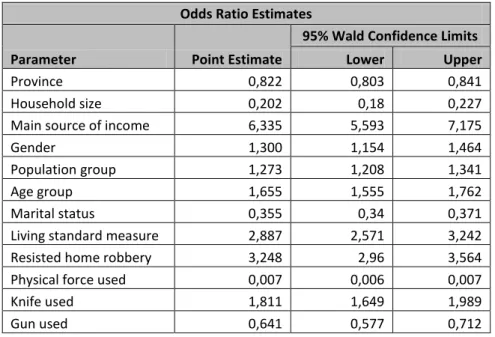
Table 5 shows the odds of victims who resisted robbery and were injured are 3,3 times higher than those of victims who did not resist robbery, with a 95% confidence interval of 3,0 to 3,6. Furthermore, the odds that there were injuries when a knife was used are 1,8 times higher than when a knife was not used with a 95% confidence interval of 1,7 to 2,0. Those households in the intermediate living standard measure and who experienced injuries were 2,9 times higher than those in other living standard measure categories. However the odds of victims who experienced home robbery and had a gun pointed at them or used were 0,6 times lower than those victims who did not have a gun with a confidence interval of 0,6 to 0,7.
A study conducted by New South Wales Bureau of Crime Statistics and Research in 1987 noted that robbery injuries were more likely to occur where the offender did not have a gun.
Table 5: Predictor model for injuries sustained in home robbery Odds Ratio Estimates
Parameter Point Estimate
95% Wald Confidence Limits
Lower Upper
Province 0,822 0,803 0,841
Household size 0,202 0,18 0,227
Main source of income 6,335 5,593 7,175
Gender 1,300 1,154 1,464
Population group 1,273 1,208 1,341
Age group 1,655 1,555 1,762
Marital status 0,355 0,34 0,371
Living standard measure 2,887 2,571 3,242 Resisted home robbery 3,248 2,96 3,564 Physical force used 0,007 0,006 0,007
Knife used 1,811 1,649 1,989
Gun used 0,641 0,577 0,712
Note: Refer to annexure 2 for a comprehensive logistic regression table
Kapardis (1988) found that a victim was four times more likely to be injured if a gang of three or more offenders was involved as opposed to a single offender. In a separate study, Morisson and O’Donnell (1994) argued that where victims had no physical barriers (such as screens) and there were multiple offenders, there was an increased risk of victims experiencing physical injuries. The results of VOCS 2011 confirm the views of Kapardis (1988) in that resistance coupled with multiple robbers has a higher probability of injury (Figure 12). About 38,9% of households resisted home robbery when being robbed by one perpetrator and 40,1% of those that resisted a single perpetrator were injured in the incident. A quarter (25,6%) of households resisted the robbery when attacked by two perpetrators, while 15,1% resisted when perpetrators where three or more. Approximately 57,2% were injured when they resisted the robbery against two perpetrators and 65,4% were injured when they resisted the attack from three or more perpetrators. There was evidently a tendency not to resist robbery when the number of perpetrators increased in a robbery incident, although more households were injured when they resisted robbery when the number of perpetrators increased. This indicates that resisting robbery when there were more perpetrators was associated with injury of the victims.