Research paper © 2020 IAU, Majlesi Branch
A Novel Approach for
Optimization of Vehicle Noise
Insulators
Seyyed Hamed Tabatabaei
1,*
Department of Mechanical Engineering,Islamic Azad University, South Tehran Branch, Iran E-mail: sh_tabatabaei@azad.ac.ir
*Corresponding author
Saeed Moradi Haghighi
2 Department of Mechanical Engineering, Tarbiat Modares University, Tehran, Iran E-mail: m.saeed@modares.ac.irKasra Ghasemian
3, Amir Hossein Kiani
4 Department of Mechanical Engineering,University of Science and Technology, Tehran, Iran
E-mail: k_ghasemian@mecheng.iust.ac.ir, amir_kiani@mecheng.iust.ac.ir Received: 29 November 2019, Revised: 27 March 2020, Accepted: 7 April 2020
Abstract: Development of effective sound insulators for interior noise reduction of vehicle cabin is an essential phase of the process of vehicle manufacturing. One of the main issues in this process is the space limitations for packaging the firewall insulators. In this paper, a new approach in sound insulator optimization will be used, in which the space limitation has been considered. The insulator consists of a Micro-Perforated Plate (MPP) and a limp porous layer. MPP layer is suitable for use in vehicles due to low weight and flexibility in design. The main goal of this study was to reach better performance and less weight and volume in a specific thickness. So, a mathematical model of this sound package has been developed and validated by experimental data and SEA software. The simulation results illustrate the high performance of the optimized sound package in practical application, particularly at higher frequencies. On the other hand, the weight and thickness of the optimized sound package are less than the conventional sound packages. These qualities provide an optimized design that has better compatibility with the automotive industry.
Keywords: Absorber, Genetic Algorithm, Micro-Perforated, Optimization, SEA, Sound Package
Reference: Seyyed Hamed Tabatabaei, Saeed Moradi Haghighi, Kasra Ghasemian, and Amir Hossein Kiani, “A Novel Approach for Optimization of Vehicle Noise Insulators”, Int J of Advanced Design and Manufacturing Technology, Vol. 13/No. 3, 2020, pp. 9–20. DOI: 10.30495/admt.2020.1883494.1161.
Biographical notes:Seyyed Hamed Tabatabaei received his PhD in Mechanical Engineering from Khaje Nasir Toosi University of Technology in 2012. He is currently an Assistant Professor at the Department of Mechanical Engineering, South Tehran Branch of Islamic Azad University, Tehran, Iran. Saeed Moradi Haghighi is presently a MSc student at Tarbiat Modares University and a researcher in the MSA lab. Kasra Ghasemian and Amirhossein Kiani are currently MSc students in Iran university of science and technology. Their current research interest includes NVH and modal analysis, and are researchers in the modal lab.
© 2020 IAU, Majlesi Branch
1 INTRODUCTION
Improving the vehicle's cabin interior noise through sound packaging is an important phase of the process of vehicle manufacturing. However, the relatively high weight of the conventional structures is a limiting factor due to its effect on fuel consumption and depreciation. Therefore, appropriate sound packaging of the dash panel has significant importance [1].
Due to the importance of reducing fuel consumption and depreciation, there is an excellent demand for designing lightweight sound packages. Therefore, the heavy-weight, mass-spring insulators were gradually replaced by lightweight insulators. For example, dual-density insulators and multilayer designs were proposed as the lightweight insulators in automotive companies [2-3]. Recently, with the advent of Micro-Perforated Plates (MPPs) as an acoustical material, the use of these insulators has been considered as an alternative to lightweight insulators [4]. An MPP consists of small holes, generally micro-sized, created in a thin plate which dissipates energy inside the holes similar to the absorbers' mechanism of action [5]. Due to the lightweight, low thickness, high strength, and flexibility of the MPP, it can lead to an optimized design compared to the common sound package.
Parrett et al. suggested a combination of MPP and absorber materials for automotive applications like dash insulator. Furthermore, it has been emphasized that a combination of a porous layer and MPP will achieve improved acoustical performance compared to the common sound package designs (e.g., dual-density). In addition, it can lead to improved absorption performances by controlling the open area of the MPP [6].
Li [7] and Liu [8] developed an appropriate mathematical method for the theoretical modeling of a two-layer acoustic insulator. The acoustic insulator includes MPP and porous layers, which "Maa" and "equivalent fluid" methods are utilized for mathematical modeling, respectively. Through using the above mentioned theoretical model, an optimization method for the insulator has been proposed by Shin and Bolton [5]. The main task in the mentioned study was the achievement of the balanced performance between the absorption coefficient and the transmission loss. As stated in [9], the weight of the sound package is proportional to its thickness. Therefore, by decreasing the thickness of the sound package, it is possible to attain a lower weight. Furthermore, the significance of the insulator thickness in some specific areas of the vehicle dash panel has been reflected in [10]. However, there is a lack of research regarding the insulator thickness in the optimization procedures. On the other hand, some conventional optimization methods such as trial and
error or Response Surface Methodology (RSM) has been used as the optimization tools [11-13].
Therefore, in this paper, two main contributions have been considered. Firstly, the total thickness of the insulator is included as constraint parameters in the optimization procedure. This constraint provides the optimized design that has better compatibility with the limited space of the automotive dash panel. Secondly, the genetic algorithm is used to optimize the principal parameters of the selected insulator. Genetic Algorithm (GA) is one of the most powerful methods in optimization fields. This algorithm is appropriate because of its acceptable accuracy and computational time. Also, the algorithm will not be caught in the local minimum traps and can find the absolute minimum. This method can achieve more reliable and accurate outcomes compared to conventional methods.
The paper is organized as follows:
Firstly, a mathematical model of the porous and MPP layers has been developed based on the equivalent fluid method and MAA, respectively. Two developed models of the selected insulator have been connected through using the transfer matrix method. Then, the validity of the developed model is discussed by comparing the absorption coefficient of the presented model with existing experimental data and the SEA software model. In the next step, some important parameters of the selected insulator have been optimized using the genetic algorithm. Finally, the performance of the optimized insulator has been compared to the conventional insulator in a SEA vehicle acoustic model for the application of sound packages for dash panels.
2 THEORETICAL MODELING
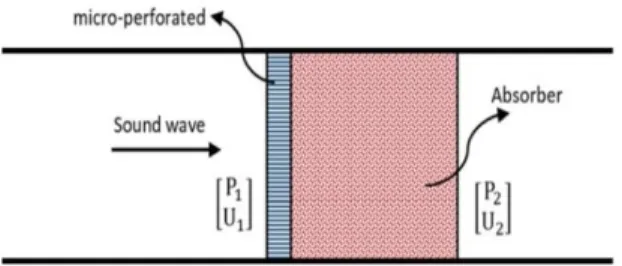
As mentioned in the previous sections, the sound package used in this paper includes a porous material layer and a micro-perforated plate, as shown in “Fig. 1ˮ.
Fig. 1 Acoustical model for the selected sound package.
In this study, the transfer matrix method is utilized to simulate the acoustic behaviour of the multilayer sound package. In the first step, the general form of the transfer matrix is separately obtained for each layer. Then, in the
© 2020 IAU, Majlesi Branch next step, detailed modelling of each layer is discussed
by defining appropriate parameters of transfer matrices. 2.1. Transfer Matrix Method
The transfer matrix method is a common approach to simulate the acoustic properties of a multilayer media, which is based on studying the behaviour of wave that is moving through a non-continuous media. Figure 1 shows the simplified model of sound propagation. As illustrated, the sound wave creates a sound field. In order to study the sound properties, the sound field needs to be fully determined. The sound field can be defined by two variables at each point, including sound pressure and the particle velocity. Transfer matrix can relate two points of the acoustic field in a media so that we can write the following equation:
F1 Ttotal
F2 (1) Which:
1 1 1 P F U (2)
2 2 2 P F U (3)
11 12 total 21 22 T T T = LP MPP = T T (4)Where, [Ttotal
]
is the total transfer matrix of the soundpackage, [LP
]
is the limp porous material's transfer matrix and [MPP]
is the MPP's transfer matrix. In the following subsections, the absorber and the MPP's matrices are calculated in a different way, which will be discussed in detail.2.1.1. Transfer matrix of limp porous layer
In order to define the transfer matrix of a porous layer, one must first understand the structure of them. This kind of material has two phases, solid and fluid. The solid phase, commonly referred to as a frame, forms the body structure of a porous material, including pores. The fluid phase is generally referred to entrapped air inside the porous material's pores. Under a specific frequency range, approximately upper than 500 Hz, the solid phase does not influence acoustic performance, and one can claim that the acoustic performance of a porous layer is similar to some kind of fluid. For such reason, one can equate a porous material to a fluid. So in the following, equivalent fluid will be used instead of porous material. In the first step, the transfer matrix of an equivalent fluid is calculated.
A sound field in a fluid media is entirely defined at any point by the following vector:
i i i P F U (5)Where, Pi and
U
i are sound pressure and particlevelocity of the fluid in a horizontal direction
( )
x
, respectively. On the basis of the assumption of steady-state condition and plane wave propagation, Pi andU
ican be written as follows [14]:
1 x 2 x Pi A exp jk x A exp jk x (6)
x 1 x 2 x k U A exp jk x A exp jk x ωρ i (7)Where, K x is the wavenumber component inside the fluid in the direction of x , is the angular frequency and
ρ
is the fluid's density. Referring to “Fig. 2ˮ, the origin of the coordinate system is located at point 2. Therefore, Pi andU
i can be calculated at points 2 and1 where, x 0 and
x
h
, respectively.Fig. 2 Schematic showing plane wave encountering a fluid media.
According to “Fig. 2”, the connection between acoustic fields and the absorption transfer matrix is expressed by:
F = LP F
1 2 (8)Where, [LP
]
can be defined as:
1 2 3 4LP
LP
LP
LP
LP
(9)Regarding “Eq. (8)ˮ, and computing P
i and Ui at point (1) and (2), the following equation can be achieved:
© 2020 IAU, Majlesi Branch
1 2 1 2 x 1 2 3 4 1 x 1 x 2 x 2 x x 1 x 1 x 2 x 2 x x x xA cos k h +A jsin k h +A cos k h -A jsin k h
k A k A k A k A =
cos k h + jsin k h - cos k h + jsin k h
ωρ ωρ ωρ ωρ
A +A
LP LP
k
A -A
LP
LP
ωρ
(10)Finally, by solving matrix “Eq. (10)ˮ, transfer matrix of the porous absorber is obtained:
x x x x x x ωρ cos k h j sin k h k LP k j sin k h cos k h ωρ (11)The specific impedance is obtained from the following equation [16]:
ρω
Z
k
x
(12)Substituting the impedance from (12) in equation (11):
x
x
x x cos k h jZ sin k h LP j sin k h cos k h Z (13)The transfer matrix of a fluid can be obtained just by determining the impedance and wavenumber of the fluid. Likewise, according to the assumptions made in the equivalent fluid method, equivalent impedance (
eq-porous
Z ) and wave number (keq-porous) are the basic parameters for defining the transfer matrix of the porous layer. So, the transfer matrix of the mentioned absorber can be written as follow:
eq-porous eq-porous eq-porous eq-porous eq-porous eq-porous LP cos k h jZ sin k h j sin k h cos k h Z
(14)In order to obtain the values of the equivalent wave number and impedance, it is strictly required to use a proper model, which is JCA, in this paper. Further detail of this method will be explained in section (2.2.1).
2.1.2. Transfer matrix of Micro-perforated plate An MPP with a thickness of
t
is shown in “Fig. 3ˮ:Fig. 3 Schematic diagram of an MPP backed by an air cavity.
The MPP layer can be modelled by its transfer matrix's elements, which correlate the sound pressure and velocity on both sides of the acoustic layer. The general transfer matrix of an MPP can be expressed as follows:
1 2 1 2 3 4 1 2 MPP MPP P P MPP MPP U U (15)
Where MPP1, MPP2, MPP3 and MPP4 are the four-pole parameters of an acoustic layer,
1 P and
2
P are the sound pressures, U and 1 U , are the particle velocities on 2 each side of MPP.
Transfer impedance is defined as [15]:
P P 1 2 Z Z Z T 1 2 U U 1 2 (16)
Since the thickness of t is small, the particle velocity on both sides of the MPP is equal, so equation (16) will be obtained in the form of below:
1 2 1 T
P P U Z (17)
By substituting “Eq. (17)ˮ in “Eq. (15)ˮ, the following can be obtained:
© 2020 IAU, Majlesi Branch 1 2 2 1 t 2 3 4 1 1 1 2 t 3 4 MPP MPP P U Z P MPP MPP U U MPP MPP 1 Z MPP MPP 0 1
(18)In the above-mentioned equation, transfer impedance can be obtained by using various methods. In this paper, the Maa method has been chosen, which will be further explained in section (2.2.2).
2.2. Determination of the Transfer Matrices Parameters
In the previous section, the transfer matrices of both the limp porous and MPP layer have been obtained parametrically. Now, in order to use the matrices, the related parameters should be extracted by using an appropriate method.
2.2.1. Parameters of Porous Materials (JCA method) Porous materials are one of the most widely used materials in the sound packaging industry.
There is a number of models that can be used to simulate porous media. As mentioned before, the motionless skeleton (equivalent fluid) is an appropriate model. To describe fluid behaviour, the fundamental wave equation (Helmholtz equation) is used [15]. This equation is completely defined by two parameters called complex density and complex bulk modulus. For defining these two parameters, there are a few models. In this paper, the porous layer was modelled as an equivalent fluid by using the Johnson-Champoux-Allard (JCA) model. JCA is a semi-phenomenological model describing visco-inertial dissipative effects inside the porous media [16]
.
In this model, some parameters, such as dynamic tortuosity, dynamic permeability, and a macroscopic parameter called the specific viscosity length, are defined. Also, a parameter is used to express the heat transfer between the various layers of the fluid in the boundary layers adjacent to the pores wall, called the specific thermal length. Based on the results set in [15], in the JCA model, the specific density and specific bulk modulus values are obtained as follows:specific density,
:
0 2 0 2 2 2 0 4 1 1 Λ j j (19)Where is porosity,
is static flow resistivity of air, is tortuosity, is Viscous characteristic length,0
is the density of the fluid(air), and
is Dynamic viscosity.Specific bulk modulus, K
:
0 1 ' 2 0 ' 2 0 Λ 8 1 1 1 Λ 16 p p P K C j j C (20)Where,
is the ratio of specific heats,C
p is thespecific heat capacity at constant pressure,
P
0 isatmospheric pressure (static),
is the thermal conductivity of air, and Λ' is the thermal characteristic length. After calculating
and K
, it is possible to determine the equivalent impedance (Zeq-porous) and wave number (keq-porous) [17]:
eq-porous Z K (21)
eq-porous k /K (22)In the next step, the transfer matrix of porous material can be obtained (“Eq. (14)ˮ).
2.2.2. Parameters of Micro-Perforated Plate ("Maa" Method)
The theoretical model for predicting the performance of micro-perforated plates has been developed well, which has created a great opportunity to design and control the operation of these plates [18]
.
In order to model these plates, circular holes in MPP are considered as thin tubes. When a sound wave passes through a short, thin tube with a radius
r
0, the partial velocity U is a function of the distance r, as shown in “Fig. 4ˮ. The connection between partial velocity in the hole and the applied acoustic pressure on the given thin tube is expressed by the partial air motion “Eq. (23)ˮ [19].
Fig. 4 Schematic motion of the partial velocity in a thin tube with radius r0.
2 2 air 2 1 p K U r r r μh r (23)© 2020 IAU, Majlesi Branch Where, 2
air
K jρ ωμ0 ,
ω=2 f
is angular velocity andf is frequency,
is the dynamic viscosity of the air, h is the thickness of the thin tube, r is thin tube radial coordinates,
p
is the pressure difference between the front and back of the tube. “Eq. (23)ˮ is a non-homogeneous differential equation and its general solution is as follows:
0
air
2 air p U r AJ K r μhK (24)Where, J0is first-order Bessel function of zero, and constant A, can be obtained by applying suitable boundary conditions. Due to the effect of viscosity, the velocity of air at the boundary of tubular walls is equal to the vibration velocity of the material. "Maa" assumed that the vibration of walls could be neglected due to random noise pressure, and so the panel could be considered rigid [11], [20]
.
0U r 0 (25)
The average velocity on the hole is calculated by applying boundary condition:
0 r 1 air 0 0 2 0 air 0 0 air 0 0 r 2πrdr p 2 J K r 1 jωρ h K r J K r πr U U
(26) Where, 1J , is the first-order Bessel function. According to the definition of normal impedance and “Eq. (25)ˮ, thin tube impedance will be obtained as follows:
1 1 air 0 0 0 0 air 0 0 air 0 0 0 J K r jωρ h p 2 1 ρ c δ K r J K r ρ c δU t Z (27)Where, is the perforation ratio and
c
0is the speed of sound. Finally, by solving “Eq. (27)ˮ, “Eq. (28)ˮ will be obtained for the impedance of the MPP:2 3 2 2 0 0 0 xr 0.03675 h x 2 1 δ 32 8 h jωh 1 0.294 10 1 1.7 δ x h 9 2 2 t r r Z (28) Where, x is expressed as 0 2r f / 10
2.3. Definition of Overall Absorption Coefficient for the Sound Package
Transfer matrices contain all useful information about how noise acts in a multilayer media. In this paper, the absorption coefficient was used for the validation and optimization process. For calculating the absorption coefficient of a sound package based on the transfer matrix, the following steps should be taken [21]. As shown in “Eq. (6)ˮ, pressure amplitudes of Incident and reflected sound waves on the surface are A1and A2. According to “Eq. (1) to Eq. (7) and Eq. (12)ˮ, one can write the following equation (Note that in this case, “Fig. 1ˮ, the reference point is located in position 1):
1 2 1 11 2 12 2 A +A =P =T P +T U (29) 1 2 1 21 2 22 2 0 0 A -A =U =T P +T U c (30)
The end part of the sound package model is considered as a rigid wall, so the particle velocity in position 2 is
2
U =0 . the pressure reflection coefficient λ=A2 A1 can be expressed by the transfer matrix elements as [21]:
11 0 0 21 11 0 0 21
T -
T
λ=
T +
T
c
c
(31)the normalized acoustic impedance Z = P /Us
/ 1 1 0 0c , has the following relationship with the reflection coefficient: 0 0 Z 1+λ 1-λ s c (32)The sound absorption coefficient is defined by
2
1
So, it can be shown in terms of Zs[22]:
0 0 2 2 0 0 0 0 4Re / 1 Re / / s s s Z c Z c Im Z c (33)
Where, Re and Im represent the real and imaginary parts, respectively.
© 2020 IAU, Majlesi Branch
3 STATISTICAL ENERGY ANALYSIS SIMULATION
Statistical Energy Analysis (SEA) method has been widely used to predict noise and vibration in recent years, and it becomes the main tool for mid and high-frequency noise and vibration analysis in the automotive industry [23]. SEA is used for acoustic modelling of the interior trim materials because the majority of vehicle noise covers the mid and high-frequency ranges. On the other hand, the conventional methods such as the Boundary Element Method (BEM) and Finite Element Method (FEM) become less reliable and time-consuming at the mentioned frequency ranges.
In SEA modelling, the system is divided into several subsystems, and a power balance for each subsystem is set up based on the conservation of energy [24]. This feature allows the SEA method to construct the mathematical models of the energy flow for the complex structures [25]. SAE software simulates the NVH based on the presented theories. In Section 2, the comprehensive theoretical model of the absorption coefficient of the insulator has been introduced. In this section, 2 models have been developed using SAE software.
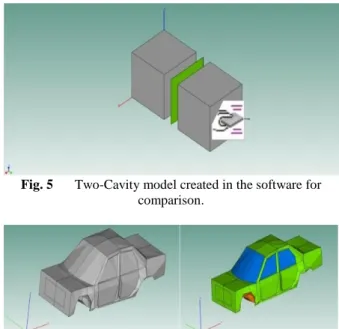
Figure 5 illustrates the first model (Two-Cavity model), which consists of two acoustic cavities and a plate coupled with an insulator located in-between. A sound waves travels from one cavity to another one, and while it passes the insulator, it loses energy. In the validation section, the correlation of results between theoretical, SEA, and experimental results will be shown.
Fig. 5 Two-Cavity model created in the software for comparison.
Fig. 6 A 3D model of a four-door sedan vehicle using SEA software. Right: Structural subsystems. Left: Acoustical
subsystems.
Although the Two-Cavity model is a suitable model to calculate the absorption coefficient, it represents an ideal condition. Therefore, a full vehicle model is used to represent more realistic conditions. Figure 6 shows a 3D model of full vehicle used for simulation. This model is a generic sedan model and is a suitable case for comparing sound pressure in an interior cabin for various sound packages.
The vehicle model is divided into some structural and acoustical subsystems. Structural subsystems are used to represent plates and shells like floor, roof, dash, doors, windows, and firewall. Acoustic subsystems are used to represent acoustic spaces called cavities. The dimensions of the subsystems are extracted from real vehicle geometry [26-27]. (“Fig. 7ˮ)
Fig. 7 Firewall of the simulated model (Orange parts). In order to investigate the insulator in a more realistic situation, it will be used as a sound package on the firewall of the full vehicle model. In order to illustrate the superior effect of the proposed sound package on reducing the engine noise, a white noise source is placed at the engine compartment. Then the response of the source will be measured and compared at the driver's head position for different sound packages.
4 MODEL VALIDATION
In this section, the model presented in Section 2 is validated based on the experimental results. Furthermore, the response of the presented model is also compared with the response of the same sound package inserted into the two-cavity model of SEA software. The absorption coefficient of the combined layers has been selected as the performance response for validation. For the purpose of model validation, experimental results were extracted from reference [19] with different properties of MPP listed in “Table 1ˮ. Referring to Section 2, the absorption coefficient as the function of frequency is computed as the theoretical result. Furthermore, using the two-cavity model presented in section 3, the absorption coefficient of the same insulator was computed.
© 2020 IAU, Majlesi Branch
Table 1 Properties of modeled layers for validation
Layers Thickne ss (mm) Air flow resistivity ) 4 Ns/m ( Perforation ratio (%) Hole diameter (mm) Absorber (all insulators) 4.5 214000 - -MPP1 1.07 - 3.5 0.8 MPP2 1.08 - 4.8 0.8 MPP3 1.08 - 7.2 0.8 a) Case 1 b) Case 2 c) Case 3
Fig. 8 Validation of the absorption coefficient of theoretical model by the experimental model of case 1 to 3,
and the comparison of SEA modelling.
Referring to “Table 1ˮ, three cases could be defined as follows:
Case 1 = Absorber + MPP 1 Case 2 = Absorber + MPP 2 Case 3 = Absorber + MPP 3
In “Fig. 8 (a), (b), and (c)ˮ, the results of the theoretical model, SEA, and experiment have been compared for three of the different mentioned cases. As it is shown in “Fig. 8”, there is an acceptable agreement between presented theoretical model and both experimental and SEA results.
5 OPTIMIZATION
5.1. The Process of Optimization in Model
In order to improve the performance of the selected sound package, an optimization process has been performed. There are a number of mathematical algorithms that can be used to optimize the parameters of a problem to achieve a more accurate outcome. Genetic Algorithm (GA) is one of the most powerful methods in optimization fields. This algorithm is appropriate because of its acceptable accuracy and computational time. Also, the algorithm will not be caught in the local minimum traps and can find the absolute minimum. For the above reasons, GA is used in this study.
At the first step of GA, the algorithm randomly selects a number of points in the problem's domain and forms the first generation of the population. Then, the algorithm selects multiple points from this population, which has more appropriate output values. One can name these points as the parents of the next generation. By performing the fertilization and mutation procedures on the inputs representing these points (also referred to as chromosomes), a new generation of points will be created, followed by the next step of the algorithm. After choosing a new generation, the termination conditions are going to be checked. If one of the termination conditions is established, the system identifies the best chromosome as the answer to the problem; otherwise, the second generation will be returned to the algorithm cycle to resume the procedure. This cycle continues until a termination condition is reached.
5.2. Applying Optimization
As shown in the validation section, the absorption coefficient curve shows the performance of a particular sound package. The maximum absorption coefficient at each frequency is equal to one, which means that all the released energy at that frequency is absorbed. Consequently, according to “Eq. (34)ˮ, the performance index has been defined.
© 2020 IAU, Majlesi Branch
6400 1J
1
f f
(34)Where, ɑf is equal to the amount of absorption
coefficient at each frequency. By calculating the above function, the area above the absorption-frequency curve is computed. Obviously, when the absorption coefficient is closer to 1, the desired sound package provides better performance. Therefore, the minimum value of the defined function should be considered. By finding the minimum of J , the absorption coefficient can be optimized for the sound package. In order to achieve this target, according to “Fig. 9”, the following parameters of the sound package have been chosen for tuning during the optimization process:
Fig. 9 Schematic of an MPP.
1- Perforation ratio of MPP (
) (This parameter could be adjusted by changing the number of holes in MPP)2- MPP hole diameter ( d ) 3- MPP thickness (t ) 1
4- Absorber flow resistivity of porous layer () 5- Absorber thickness (t2).
Table 2 Optimization parameters and their range Specifications Unit Minimum Maximum
δ (%) 1 15 d mm 0.05 3 1 t mm 0.5 2 σ (Ns/m4) 7000 350000 2 t mm 1 30
In “Table 2ˮ, the variation range of the mentioned parameters has been defined. Clearly, the selected ranges are defined as inequality constrained for the optimization tool. Furthermore, due to limited space for packaging the insulator, the total thickness of the insulator (t1t2) is an important parameter. Therefore, for better judgment about the optimized insulator, the
defined optimization problem is solved in two separated situations with the following equality constraints: - Insulator-1: t1t2 30mm
- Insulator-2: t1t2 15mm
5.3. Optimized Parameters
As mentioned above, the optimization process has been done twice, each time with a different total thickness. The first optimization has been done under a total thickness limitation of 30 mm, which named Insulator-1. The Insulator-1 optimized parameters are shown in “Table 3ˮ.
Table 3 Optimized parameters of Insulator-1
Layers Thick ness (mm) Air flow resistivity ) 4 Ns/m ( Perforatio n ratio (%) Hole diamete r (mm) Absorber 29 29460.547 - -MPP 0.582 - 12.671 0.565
The second optimization has been done under a total thickness limitation of 15 mm, which named Insulator-2. The Insulator-2 optimized parameters are shown in “Table 4ˮ.
Table 4 Optimized parameters of Insulator-2
Layers Thick ness (mm) Air flow resistivity ) 4 Ns/m ( Perforatio n ratio (%) Hole diamete r (mm) Absorber 15 94902.141 - -MPP 0.501 - 15 0.746
In the next section, the performance of the optimized insulators is compared to the conventional dual-density insulator.
6 RESULTS AND DISCUSSION
In the previous section, two optimized sound packages have been achieved (Insulators 1,2). In this section, the performance of these insulators is evaluated in different situations, and the capability of them is compared with various conventional insulators.
6.1. Comparison of Absorption Coefficient for Optimized and Not-optimized Insulators
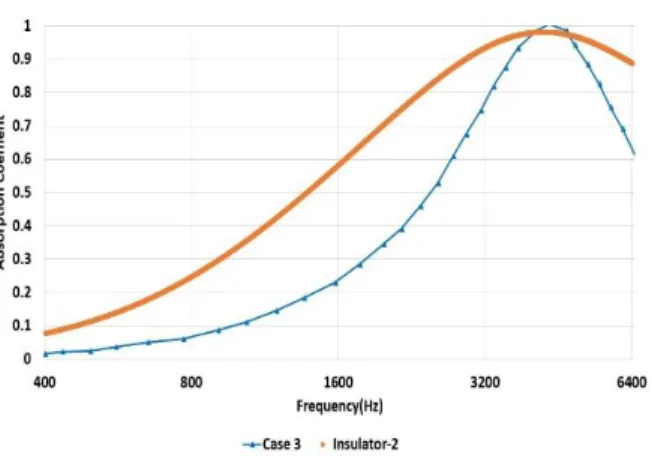
In the first step, the absorption coefficient of the insulator-2 with a total thickness of 15mm is compared with the Not-optimized insulator, Case 3, that its parameters have been listed in “Table 1ˮ. In “Fig. 10ˮ, the performance of the two mentioned insulators has been compared. As shown in “Fig. 10ˮ, using the
© 2020 IAU, Majlesi Branch
optimization method, it is possible to achieve improved performance in absorbing sound power.
Fig. 10 Comparison of the absorption coefficient for Insulator-2 and case 3.
6.2. Comparison of Absorption Coefficient for Optimized Insulators and Dual-Density Insulator In the second step, the performance of the optimized insulator is compared with the "Dual-Density" insulator. The Dual-Density insulator is the widely used concept in the automotive industry, and in recent years its popularity has been raised among many acoustic engineers [28]. The parameters of the Dual-Density insulators are listed in Table 5 [11]. The total thickness of the insulator is 30 mm.
Table 5 Dual-Density insulator properties Physical
Properties First layer Second layer
Thickness (mm) 10 20 Porosity 0.95 0.97 Flow resistivity ) 4 -Nsm ( 36000 15000 Tortuosity 1.7 1.1 VCL1 (µm) 16 120 VCL2 (µm) 180 120
The absorption coefficient of the optimized concepts is compared with the Dual-Density concept in “Fig. 11ˮ. As it is shown in this figure, at mid and high frequencies, the insulator 1 has superior performance for noise absorption. At low frequencies, the Dual-Density insulator has higher performance. On the other hand, the insulator-2 with half-thickness of two other insulators has an acceptable response, particularly at high frequencies.
In order to have a better judgment about the sound absorption capabilities of the mentioned insulators, the normalised area below the absorption coefficient curve is selected as the comparison index. In “Fig. 12ˮ, based on the new defined index, four different cases have been compared including insulator-1, insulator-2,
Non-optimized MPP and Dual Density insulator. The index of insulator-1 is higher than the other cases.
Fig. 11 Comparison of Optimized Insulator-1 and Insulator-2 with Dual-Density concept.
As shown in this figure, the index for Non-Optimized concept is about 60% (Case 3). On the other hand, the index is increased to 80% for insulator-2. Furthermore, the performance of the insulator-2 (with 15 mm thickness) in sound power absorption is almost similar to the Dual-Density case (with 30 mm thickness).
Fig. 12 A comparison of the surface under absorption curves.
As stated in the previous sections, the main goal of this study is to reduce the weight and volume of the insulation. Therefore, the final selected insulator in this paper is insulator-2 with a total thickness of 15mm. Consequently, in the next section, the performance of the selected optimized sound package is investigated in a more realistic situation.
6.3. Performance Evaluation of the Optimized Sound Package in the Automotive Dash Panel
In the final step, in order to make a more realistic judgment about the optimized concept, a vehicle SEA model presented in Section (3) has been used. The interior noise of the cabin has been measured at the driver's ear position for three mentioned insulators,
© 2020 IAU, Majlesi Branch including Dual-Density, non-optimized (Case3), and
optimized (Insulator-2) cases. These insulators have been used as the sound package for the dash panel in three separate tests. According to “Fig. 13ˮ, the optimized concept has superior performance in comparison to a Non-optimized concept. On the other hand, optimized and Dual-Density concepts have almost the same performance in noise reduction. However, it is very important to note that the thickness of the optimized sound package is almost half of the Dual-Density sound package. This will be very practical for the case of packaging and mass and volume reduction.
Fig. 13 Comparison of the sound pressure level in vehicle for different sound packages.
7 CONCLUSION
The comprehensive mathematical model for the absorption coefficient of a multilayer sound package has been developed. The multilayer sound package consists of the micro-perforated layer and the limp porous layer. The developed model has been validated by using both experimental data and SEA software. At the next step, the Genetic Algorithm has been used to optimize the selected multilayer sound package. The simulation results show that the absorption characteristic of the sound package can be improved through the optimization method. Furthermore, the comparative simulation results confirmed the relative merit of the optimized sound package with respect to the Non-optimized and conventional insulators.
8 ACKNOWLEDGMENT
This work was supported by South Tehran Branch of Islamic Azad University under the project of “A method to improvement of NVH characteristic of passenger vehicle”.
REFERENCES
[1] Pang, J., Noise and Vibration Control in Automotive Bodies, First ed, John Wiley & Sons, Inc., Hoboken, New Jersey, 2018, pp. 217.
[2] Duval, A., Rondeau, J. F., Bischoff, L., Deshayes, G., and Dejaeger, L., Generalized Lightweight Concepts: Improving the Acoustic Performance of Less than 2500 g/m2 Insulators, SAE Technical Paper No. 2009-01-2136, 2009.
[3] Zhang, J., Zhu, G., Zhang, X., Liu, H., and Liu, C., The Vehicle NVH Development and Engineering Application of the Lightweight Sound Package, in Proceedings of SAE-China Congress 2014: Selected Papers, 2015, pp. 291-300.
[4] Li, C., Cazzolato, B., and Zander, A., Acoustic Impedance of Micro Perforated Membranes: Velocity Continuity Condition at the Perforation Boundary, The Journal of the Acoustical Society of America, Vol. 139, No. 1, 2016, pp. 93-103.
[5] Shin, H., Bolton, J. S., The Identification of Minimum-Weight Sound Packages, Noise Control Engineering Journal, Vol. 66, No. 6, 2018, pp. 523-540.
[6] Parrett, A. V.,et al., Application of Micro-Perforated Composite Acoustic Material to a Vehicle Dash Mat, SAE Technical Paper No.2011-0148-7191, 2011. [7] Li, L., Gang, X., Liu, Y., Zhang, X., and Zhang, F.,
Numerical Simulations and Experiments on Thermal Viscous Power Dissipation of Perforated Plates, AIP Advances, Vol. 8, No. 10, 2018, pp. 105-221.
[8] Liu, Z., Zhan, J., Fard, M., and Davy, J. L., Acoustic Measurement of a 3d Printed Micro-Perforated Panel Combined with a Porous Material, Measurement, Vol. 104, 2017, pp. 233-236.
[9] Du, A. M., Wei, N., and Shao, J. W., Optimization of Sound Package for Automotive Dash Panel, Applied Mechanics and Materials 2014 (Vol. 670, pp. 1098-1101). Trans Tech Publications Ltd.
[10]Seppi, M., Castagnetti, C., and Ravinath, V., Optimisation of a Hybrid Sound Package with Statistical Energy Analysis, ATZ Worldwide 114, No. 9, 2012, pp. 44-48.
[11]Jain, S., Shravage, P., Joshi, M., and Karanth, N., Acoustical design of Vehicle Dash Insulator, SAE Technical Paper No. 2011-0148-7191, 2011.
[12]Jain, S., Shravage, P., and Karanth, N., Sound Package Materials for Vehicle Interior NVH Refinement, Automotive Material Conference, 2010.
[13]Marzbanrad, J., Hafezian, M., and Mozaffarikhah, M., Automotive Interior Cabin Noise Analysis and Optimization Using SEA and RSM, International Journal of Automotive Engineering, Vol. 9, No. 1, 2019, pp. 2887-2894.
[14]Heutschi, K., Lecture Notes on Acoustics I, Institute for Signal- and Informationprocessing, ISI Swiss Federal Institute of Technology, Zurich, Swiss, 2013, chaps. 1.
© 2020 IAU, Majlesi Branch
[15]Allard, J., Atalla, N., Propagation of Sound in Porous Media: Modelling Sound Absorbing Materials, 2nd
edition, John Wiley & Sons, Hoboken, New Jersey, 2009, pp. 2-3.
[16]Chevillotte, F., Jaouen, L., and Bécot, F. X., On the Modeling of Visco-Thermal Dissipations in Heterogeneous Porous Media, The Journal of the Acoustical Society of America, Vol. 138, No. 6, 2015, pp. 3922-3929.
[17]Liu, Z., Zhan, J., Fard, M., and Davy, J. L., Acoustic Properties of Multilayer Sound Absorbers with a 3D Printed Micro-Perforated Panel, Applied Acoustics, Vol. 121, 2017, pp. 25-32.
[18]Zwikker, C., Kosten, C. W., Sound Absorbing Materials, Elsevier Publishing Company, Amsterdam, 1949. [19]Villamil, H. R., Acoustic Properties of Microperforated
Panels and Their Optimization by Simulated Annealing, Ph. D. Dissertation, Universidad Politecnica de Madrid, Madrid, Spain, 2012.
[20]Dah-You, M., General Theory and Design of Microperforated-Panel Absorbers, Chinese Journal,No. 3, 1997, pp. 03.
[21]Lee, D., Kwon, Y., Estimation of the Absorption Performance of Multiple Layer Perforated Panel Systems by Transfer Matrix Method, Journal of Sound and Vibration, Vol. 278, No. 4-5, 2004, pp. 847-86.
[22]Liu, Z., Zhan, J., Fard, M., and Davy, J. L., Acoustic Measurement of a 3D Printed Micro-Perforated Panel Combined with a Porous Material, Measurement, Vol. 104, 2017, pp. 233-236.
[23]Musser, C. T., Manning, J. E., and Peng, G. C., Predicting Vehicle Interior Sound with Statistical Energy Analysis, Sound & Vibration, Vol. 46, No. 12, 2012, pp. 8-14.
[24]Egab, L., Wang, X., Fard, M., and Jazar, R., Prediction of Interior Trim Sound Absorption Using Statistical Energy Analysis, 25th International Conference on Noise and Vibration engineering, Vol. 5, 2012, pp. 3881-3890.
[25]Golota, A., Acoustic Simulation of Power Unit Encapsulation for Construction and Mining Applications, Master's Thesis, chalmers university of technology, Gothenburg, Sweden, 2012.
[26]Pan, J., Semeniuk, B., Ahlquist, J., and Caprioli, D., Optimal Sound Package Design Using Statistical Energy Analysis, SAE Technical Paper No, 0148-7191, 2003. [27]Yu ,Z., Raveendra, S. T., Mo, H., and Mollo, C.,
Development of General SEA Templates for Four-Door Passenger Cars, SAE Transactions, 2003, pp. 1860-1870 [28]Edathute, S., Nalla, T., Bhangale, R., and Kumbhar, M., Application of Dual Density Light Weight Dash Acoustic Insulators in SUVs, SAE Technical Paper No. 0148-7191, 2009.