Original Contribution
Patterns of Care in Palliative Radiotherapy: A
Population-Based Study
By James D. Murphy, MD, MS, Lorene M. Nelson, PhD, Daniel T. Chang, MD, Loren K. Mell, MD,
and Quynh-Thu Le, MD
Stanford University School of Medicine, Stanford; and University of California, San Diego, La Jolla, CA
Abstract
Purpose: Approximately one half of the radiotherapy (RT) pre-scribed in the United States is delivered with palliative intent. The purpose of this study was to investigate the patterns of delivery of palliative RT across the United States.
Methods: Using the Surveillance, Epidemiology, and End Results–Medicare linked database, 51,610 patients were identified with incident stage IV breast, prostate, lung, or colo-rectal cancer diagnosed between 2000 and 2007 and observed through 2009. Multivariate logistic regression determined predictors of palliative RT.
Results: Forty-one percent of the study population received palliative RT, including 53% of patients with lung cancer, fol-lowed by those with breast (42%), prostate (40%), and colo-rectal cancers (12%). Multivariate analysis revealed that older
patients (P⬍.001) and those with higher Charlson comorbid-ity scores (P⬍.001) were less likely to receive palliative RT. Black patients with prostate cancer were 20% less likely (P⬍ .001), and black patients with colorectal cancer were 28% less likely (P⬍.001), than white patients to receive palliative RT. Among those treated with RT, 23% of patients with lung cancer died within 2 weeks of completing treatment, followed by those with colorectal (12%), breast (11%), and prostate cancers (8%). In addition to tumor site, significant predictors (P⬍.05) of death within 2 weeks of receiving RT included increased age, increased comorbidity, and male sex. Conclusion: Inequality in the receipt of palliative RT exists among the elderly and patients with comorbid conditions and varies with race. In addition, a significant number of patients die shortly after receiving RT. Understanding these patterns of care, along with further research into the underlying causes, will improve access and quality of palliative RT.
INTRODUCTION
Across the United States, approximately one half of pre-scribed radiotherapy (RT) is delivered with palliative in-tent.1,2Palliative RT has numerous indications, including
the treatment of painful bone metastases, symptomatic brain metastases, and spinal cord or nerve root compression. Pal-liative RT can diminish pain, preserve or improve neurologic function, and dramatically improve quality of life in patients with metastatic cancer.
Despite the significant benefit that palliative RT offers, few studies have evaluated this modality at a population level.3-6In addition, the benefit of palliative RT depends a
great deal on timing. Patients who die shortly after receiv-ing cancer therapy inherently stand to benefit less. Other studies have addressed chemotherapy use at the end of life,7,8
and this question deserves further evaluation with pallia-tive RT.
Our study used the Surveillance, Epidemiology, and End Results (SEER) –Medicare linked database to explore palli-ative RT across the four most common cancers in the United States9: breast, prostate, lung, and colorectal cancers.
Specif-ically, the objectives of this study were: one, to identify factors that contribute to inequality in palliative RT; and two, to define the time-course of palliative RT with a focus on defining the population receiving treatment immediately before death.
METHODS
Data
This study used the SEER-Medicare linked database. The SEER program consists of cancer registries that cover approxi-mately 28% of the US population. Medicare provides federally funded health insurance for people ageⱖ65 years. The SEER-Medicare linked database contains SEER-Medicare claims data for the Medicare-eligible patients in the SEER database. This data set allows a unique opportunity to evaluate patterns of health care delivery on a population-based level. This study was deemed exempt from institutional review board approval.
Population
This study evaluated the four most commonly diagnosed can-cers in the United States: breast, prostate, non–small-cell lung, and colorectal cancers. We identified 90,563 patients ageⱖ66 years with an incident diagnosis of stage IV cancer between 2000 and 2007. Patients with multiple primary tumors were excluded (13%), as were patients who initially enrolled in Medicare because of end-stage renal disease or disability (0.3%). Finally, patients with incomplete Medicare claims data (continuous part A or part B, without part C enrollment) for 12 months before diagnosis (to calculate comorbidity) through death or last follow-up (December 2009) were excluded (34%), leaving 51,610 patients in the final study cohort.
Study End Points
The primary end point in this study was RT delivery in patients with metastatic disease, which was derived from SEER registry data and Medicare claims data. SEER collects information on RT within 1 year of diagnosis delivered as part of the initial course of treatment.10Medicare billing claims data allow the
identification of RT delivered at any point in a patient’s life. With Medicare, the following daily radiation treatment and weekly management Health Care Common Procedure Coding System codes were used to capture a course of RT: 77371 to 77373, 77417, 77419 to 77420, 77425, 77427, 77430 to 77432, 77435, 77401 to 77416, 77418, 77422 to 77423, 77470, 77499, 77520, 77522 to 77523, 77525, G0173 to G0174, G0243, G0251, and G0338 to G03340. Radioactive implants and radioisotopes, coded separately in SEER, were not counted as palliative RT. A course of radiation was defined as any group of codes within 14 days of one another. Because patients can receive multiple courses of radiation, we assumed that any break in radiation codesⱖ14 days indicated a separate and additional course of radiation. The duration of a course of radiation was defined as the time between the first and last billing claims for that course.
We assessed RT agreement between SEER registry data and Medicare claims data within the first year of diagnosis, when both SEER and Medicare capture RT data simultaneously. When the SEER database scored patients as having received radiation, Medicare agreed 91% of the time. Similarly, when Medicare scored patients as having received radiation within 1 year of diagnosis, SEER agreed 90% of the time. This level of agreement is similar to what other investigators have found.11
Covariates Studied
Patient- and tumor-related variables obtained from SEER data included age, race, marital status, disease site, registry location, socioeconomic status, and year of diagnosis (2000 to 2007). Race was defined from SEER using descriptions from the 2000 US Census and Bureau of Vital Statistics.12Individual SEER
cancer registries were reclassified into East (Connecticut and New Jersey), Midwest (Detroit and Iowa), South (Atlanta, rural Georgia, Kentucky, and Louisiana), and West (San Francisco, Hawaii, New Mexico, Seattle, Utah, San Jose, Los Angeles, and greater California). Socioeconomic status was estimated by me-dian household income divided into quintiles. Meme-dian house-hold income was determined from the 2000 census using census track data over zip code data and secondarily using race-and age-adjusted data over unadjusted data. Patients without household income data (1%) were grouped into the bottom quintile.13 Comorbidity was assessed during the 12 months
before diagnosis using inpatient and outpatient Medicare claims14with the Deyo adaptation15of the Charlson
comorbid-ity index.16The distance from the patient to the nearest
radia-tion oncologist was estimated from the number of radiaradia-tion oncologists per 1,000 square miles in the county where the patient resided. These data were determined from the Area Resource File,17which collects data that include the number of
radiation oncologists per county in the year 2005.
Statistical Analysis
Continuous covariates were divided into categorical covariates to assess for nonlinear trends. Univariate predictors of palliative RT were determined with2tests. Multivariate predictors of
palliative RT were determined with logistic regression using relevant covariates (Table 1). Potential interactions between covariates were examined in the multivariate model, and among the covariates tested, we found a clinically and statistically sig-nificant interaction between tumor site and race. To account for this interaction, we stratified this multivariate model by tumor site.
Predictors of the duration of RT were determined with a multivariate linear regression model that included all covariates listed in Table 1. Time from the end of palliative RT to death was assessed with the Kaplan-Meier method.18Among patients
who received multiple courses of RT, the last course was used to assess time from the end of treatment to death. Multivariate predictors of death within 2 weeks of irradiation were deter-mined with logistic regression. The end of palliative RT was defined as the date of the last Medicare radiation claim, and therefore, the analysis of the timing of palliative RT excluded a small fraction of patients with a record of palliative RT in SEER only, without Medicare irradiation billing claims (6% of pa-tients receiving RT). No interactions between covariates were discovered in the multivariate analyses of RT duration, and predictors of death within 2 weeks of RT; therefore, unstratified models are presented with these analyses. All analyses were con-ducted with SAS version 9.3 (SAS Institute, Cary, NC).
RESULTS
Of the 51,610 patients identified within the SEER-Medicare database, 21,279 (41%) received palliative RT. Fifty-three per-cent of patients with lung cancer received palliative RT, fol-lowed by those with breast (42%), prostate (40%), and colorectal cancers (12%). Table 1 lists additional demographic data for our study population. The majority of patients (78%) received only a single course of palliative RT, whereas 17% received two courses, and 5% receivedⱖthree separate courses. The median follow-up times from diagnosis to death were 4.0, 13, 29, and 6.6 months for lung, breast, prostate, and colorectal cancers, respectively.
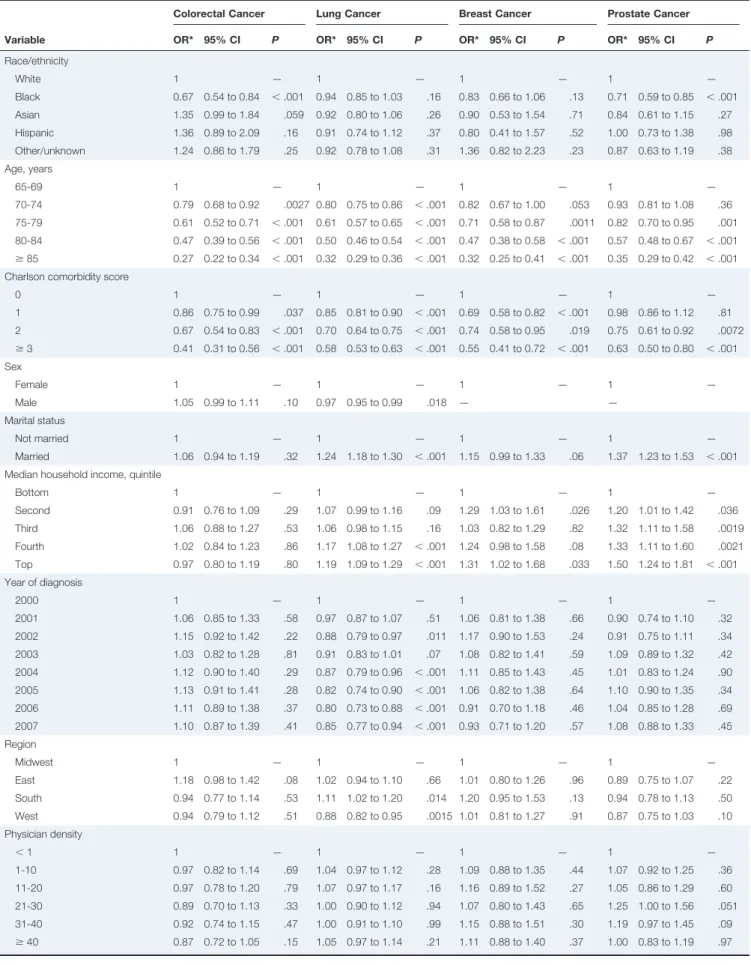
Predictors of Palliative RT
Table 1 lists the univariate predictors of palliative RT, and Table 2 lists the multivariate predictors of palliative RT. After adjusting for other covariates, black patients with prostate can-cer were 20% less likely to receive palliative RT compared with white patients with prostate cancer (relative risk [RR], 0.80; 95% CI, 0.71 to 0.91;P⬍.001). In addition, black patients with colorectal cancer were 28% less likely to receive palliative RT compared with white patients with colorectal cancer (RR, 0.72; 95% CI, 0.60 to 0.87;P⬍.001). We saw no significant differences between black and white patients with breast (RR, 0.91; 95% CI, 0.79 to 1.03;P⫽.13) or lung cancer (RR, 0.98; 95% CI, 0.94 to 1.01;P⫽.16). Across all disease sites,
multi-variate analysis revealed that older patients (P⬍.001) and those with high comorbidity scores (P ⬍ .001) were less likely to receive palliative RT. Among those with lung, breast, or pros-tate cancer, there were higher rates of palliative RT in higher socioeconomic classes and among people who were married. The use of palliative RT decreased slightly over time for lung cancer and remained relatively stable for breast, prostate, and colorectal cancers.
Among the group of black patients with prostate or colorec-tal cancer, we searched for potential subgroups who may have been more or less likely to receive palliative RT. We observed that black patients were more likely to be younger, unmarried, have lower income, more comorbidity, reside in the South or Midwest, and live in urban areas compared with white patients. However, tests for statistical interaction failed to identify a par-ticular subgroup of black patients who were more or less likely to receive palliative RT compared with the already decreased rates of palliative RT among the entire group of black patients with prostate or colorectal cancer (P⬎.05 for interaction).
Duration and Timing of Palliative RT
The median duration of palliative RT for the entire study population was 16 days. Patients with lung cancer had the shortest treatment duration, followed by those with breast (average 4 days longer), colorectal (6 days longer), and pros-tate cancers (8 days longer; allP⬍.001). Older patients had slightly shorter radiation courses (average 1.3 days shorter for every 10 years older;P⬍.001). Finally, patients treated in the West had slightly longer radiation courses (1.2 days longer;P⫽.002) compared with those in the Midwest. The duration of palliative RT did not vary by race, sex, comor-Table 1.Patient Characteristics and Univariate Predictors of
Palliative RT Variable No. of Patients Palliative RT (%) P No Yes All patients 51,610 59 41 — Tumor site ⬍.001 Lung 29,316 47 53 Colon/rectum 11,920 87 13 Breast 3,811 58 42 Prostate 6,563 60 40 Sex ⬍.001 Male 28,031 58 42 Female 23,579 60 40 Race/ethnicity ⬍.001 White 42,903 58 42 Black 5,231 64 36 Asian 1,553 61 39 Hispanic 798 62 38 Other/unknown 1,125 58 42 Age, years ⬍.001 66-69 10,315 48 52 70-74 13,226 53 47 75-79 12,867 59 41 80-84 9,232 66 34 ⱖ85 5,970 78 22 Marital status ⬍.001 Not married 25,689 63 37 Married 25,921 55 45 Year of diagnosis .35 2000 5,942 58 42 2001 6,167 58 42 2002 6,332 59 41 2003 6,673 58 42 2004 6,859 58 42 2005 6,750 59 41 2006 6,651 60 40 2007 6,236 59 41
Charlson comorbidity score ⬍.001
0 30,228 57 43 1 12,209 59 41 2 5,113 63 37 ⱖ3 4,060 67 33 SEER registry ⬍.001 Midwest 8,122 59 41 East 12,342 58 42 South 9,978 57 43 West 21,168 60 40 Geographic location ⬍.001 Metro area (ⱖ1 million) 29,016 59 41
Metro area (⬍1 million) 14,455 57 43 Urban area (ⱖ20,000) 3,161 57 43
(continued on next column)
Table 1.(Continued) Variable No. of Patients Palliative RT (%) P No Yes Urban area (2,500 to 19,999) 4,014 60 40 Rural area (⬍2,500) 963 60 41 Median household income,
quintile ⬍.001 Bottom 10,329 62 38 Second 10,323 59 41 Third 10,315 59 41 Fourth 10,324 57 43 Top 10,319 57 43 Physician density .0034 ⬍1 11,096 59 41 1-10 14,410 58 42 11-20 5,581 57 43 21-30 4,568 59 41 31-40 5,543 61 39 ⱖ41 10,411 59 41
Abbreviations: RT, radiotherapy; SEER, Surveillance, Epidemiology, and End Results.
Table 2.Multivariate Predictors of Palliative RT
Variable
Colorectal Cancer Lung Cancer Breast Cancer Prostate Cancer
OR* 95% CI P OR* 95% CI P OR* 95% CI P OR* 95% CI P
Race/ethnicity White 1 — 1 — 1 — 1 — Black 0.67 0.54 to 0.84 ⬍.001 0.94 0.85 to 1.03 .16 0.83 0.66 to 1.06 .13 0.71 0.59 to 0.85 ⬍.001 Asian 1.35 0.99 to 1.84 .059 0.92 0.80 to 1.06 .26 0.90 0.53 to 1.54 .71 0.84 0.61 to 1.15 .27 Hispanic 1.36 0.89 to 2.09 .16 0.91 0.74 to 1.12 .37 0.80 0.41 to 1.57 .52 1.00 0.73 to 1.38 .98 Other/unknown 1.24 0.86 to 1.79 .25 0.92 0.78 to 1.08 .31 1.36 0.82 to 2.23 .23 0.87 0.63 to 1.19 .38 Age, years 65-69 1 — 1 — 1 — 1 — 70-74 0.79 0.68 to 0.92 .0027 0.80 0.75 to 0.86 ⬍.001 0.82 0.67 to 1.00 .053 0.93 0.81 to 1.08 .36 75-79 0.61 0.52 to 0.71 ⬍.001 0.61 0.57 to 0.65 ⬍.001 0.71 0.58 to 0.87 .0011 0.82 0.70 to 0.95 .001 80-84 0.47 0.39 to 0.56 ⬍.001 0.50 0.46 to 0.54 ⬍.001 0.47 0.38 to 0.58 ⬍.001 0.57 0.48 to 0.67 ⬍.001 ⱖ85 0.27 0.22 to 0.34 ⬍.001 0.32 0.29 to 0.36 ⬍.001 0.32 0.25 to 0.41 ⬍.001 0.35 0.29 to 0.42 ⬍.001 Charlson comorbidity score
0 1 — 1 — 1 — 1 — 1 0.86 0.75 to 0.99 .037 0.85 0.81 to 0.90 ⬍.001 0.69 0.58 to 0.82 ⬍.001 0.98 0.86 to 1.12 .81 2 0.67 0.54 to 0.83 ⬍.001 0.70 0.64 to 0.75 ⬍.001 0.74 0.58 to 0.95 .019 0.75 0.61 to 0.92 .0072 ⱖ3 0.41 0.31 to 0.56 ⬍.001 0.58 0.53 to 0.63 ⬍.001 0.55 0.41 to 0.72 ⬍.001 0.63 0.50 to 0.80 ⬍.001 Sex Female 1 — 1 — 1 — 1 — Male 1.05 0.99 to 1.11 .10 0.97 0.95 to 0.99 .018 — — Marital status Not married 1 — 1 — 1 — 1 — Married 1.06 0.94 to 1.19 .32 1.24 1.18 to 1.30 ⬍.001 1.15 0.99 to 1.33 .06 1.37 1.23 to 1.53 ⬍.001 Median household income, quintile
Bottom 1 — 1 — 1 — 1 — Second 0.91 0.76 to 1.09 .29 1.07 0.99 to 1.16 .09 1.29 1.03 to 1.61 .026 1.20 1.01 to 1.42 .036 Third 1.06 0.88 to 1.27 .53 1.06 0.98 to 1.15 .16 1.03 0.82 to 1.29 .82 1.32 1.11 to 1.58 .0019 Fourth 1.02 0.84 to 1.23 .86 1.17 1.08 to 1.27 ⬍.001 1.24 0.98 to 1.58 .08 1.33 1.11 to 1.60 .0021 Top 0.97 0.80 to 1.19 .80 1.19 1.09 to 1.29 ⬍.001 1.31 1.02 to 1.68 .033 1.50 1.24 to 1.81 ⬍.001 Year of diagnosis 2000 1 — 1 — 1 — 1 — 2001 1.06 0.85 to 1.33 .58 0.97 0.87 to 1.07 .51 1.06 0.81 to 1.38 .66 0.90 0.74 to 1.10 .32 2002 1.15 0.92 to 1.42 .22 0.88 0.79 to 0.97 .011 1.17 0.90 to 1.53 .24 0.91 0.75 to 1.11 .34 2003 1.03 0.82 to 1.28 .81 0.91 0.83 to 1.01 .07 1.08 0.82 to 1.41 .59 1.09 0.89 to 1.32 .42 2004 1.12 0.90 to 1.40 .29 0.87 0.79 to 0.96 ⬍.001 1.11 0.85 to 1.43 .45 1.01 0.83 to 1.24 .90 2005 1.13 0.91 to 1.41 .28 0.82 0.74 to 0.90 ⬍.001 1.06 0.82 to 1.38 .64 1.10 0.90 to 1.35 .34 2006 1.11 0.89 to 1.38 .37 0.80 0.73 to 0.88 ⬍.001 0.91 0.70 to 1.18 .46 1.04 0.85 to 1.28 .69 2007 1.10 0.87 to 1.39 .41 0.85 0.77 to 0.94 ⬍.001 0.93 0.71 to 1.20 .57 1.08 0.88 to 1.33 .45 Region Midwest 1 — 1 — 1 — 1 — East 1.18 0.98 to 1.42 .08 1.02 0.94 to 1.10 .66 1.01 0.80 to 1.26 .96 0.89 0.75 to 1.07 .22 South 0.94 0.77 to 1.14 .53 1.11 1.02 to 1.20 .014 1.20 0.95 to 1.53 .13 0.94 0.78 to 1.13 .50 West 0.94 0.79 to 1.12 .51 0.88 0.82 to 0.95 .0015 1.01 0.81 to 1.27 .91 0.87 0.75 to 1.03 .10 Physician density ⬍1 1 — 1 — 1 — 1 — 1-10 0.97 0.82 to 1.14 .69 1.04 0.97 to 1.12 .28 1.09 0.88 to 1.35 .44 1.07 0.92 to 1.25 .36 11-20 0.97 0.78 to 1.20 .79 1.07 0.97 to 1.17 .16 1.16 0.89 to 1.52 .27 1.05 0.86 to 1.29 .60 21-30 0.89 0.70 to 1.13 .33 1.00 0.90 to 1.12 .94 1.07 0.80 to 1.43 .65 1.25 1.00 to 1.56 .051 31-40 0.92 0.74 to 1.15 .47 1.00 0.91 to 1.10 .99 1.15 0.88 to 1.51 .30 1.19 0.97 to 1.45 .09 ⱖ40 0.87 0.72 to 1.05 .15 1.05 0.97 to 1.14 .21 1.11 0.88 to 1.40 .37 1.00 0.83 to 1.19 .97 Abbreviations: OR, odds ratio; RT, radiotherapy.
bidity, marital status, income level, year of diagnosis, or density of radiation oncologists.
We next turned our attention to determining the timing of the delivery of palliative RT, focusing on the fraction of patients who received RT immediately preceding death. Survival after completing RT is shown in Appendix Figure A1 (online only), which highlights the observation that a significant proportion of patients received RT shortly before death. Specifically, 23% of patients with lung cancer died within 2 weeks of completing palliative RT, followed by those with colorectal (12%), breast (12%), and prostate cancers (8%).
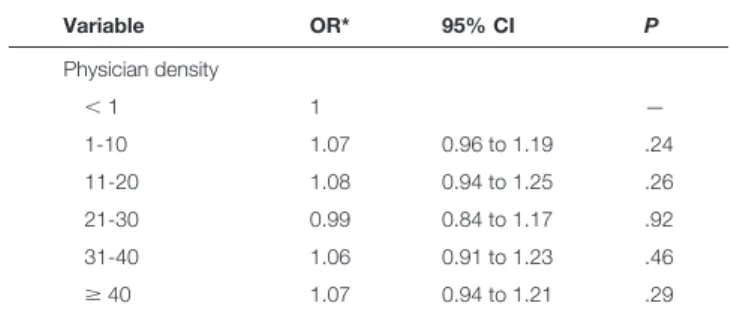
Finally, we determined the patient characteristics of those who died within 2 weeks of receiving RT (Table 3). Multivar-iate analysis revealed site-specific differences, with patients with lung cancer the most likely to die shortly after RT, followed by those with colorectal, breast, and prostate cancers. Treatment year was a significant predictor, suggesting that the number of patients treated shortly before death decreased over the study period. Other predictors of death included increased age, in-creased comorbidity, and male sex.
DISCUSSION
This study characterizes the delivery of palliative RT among the four most common causes of cancer diagnosed in the United States.9Although palliative RT can act as a powerful tool to
alleviate symptoms associated with advanced cancer, this study identified areas of disparity and potential inefficiency with re-spect to delivery of RT at the end of life. Identifying these problems and further research into their underlying causes will improve access and effectiveness of this important treatment modality.
A key finding of our study relates to tumor site– dependent racial disparity, with black patients with prostate cancer 20% less likely to receive palliative RT and black patients with colo-rectal cancer 28% less likely to receive palliative RT compared with white patients. Many factors could explain these observed differences, and although underlying causes of racial inequality have not been identified in palliative RT, they have been ad-dressed in other areas of health care. Unconscious physician racial bias against black patients affects clinical recommenda-tions for cardiac catheterization19and treatment decisions in
patients with acute coronary syndrome.20Also, poor
patient-Table 3. Predictors of Death Within 1 Month of Completing Palliative RT Variable OR* 95% CI P Tumor site Prostate 1 — Breast 1.72 1.37 to 2.17 ⬍.001 Colorectal 1.81 1.46 to 2.25 ⬍.001 Lung 3.81 3.26 to 4.45 ⬍.001 Race/ethnicity White 1 — Black 1.01 0.88 to 1.17 .84 Asian 0.93 0.74 to 1.17 .54 Hispanic 1.27 0.95 to 1.71 .10 Other/unknown 0.77 0.59 to 1.02 .07 Age, years 66-69 1 — 70-74 1.07 0.97 to 1.18 .21 75-79 1.13 1.02 to 1.25 .021 80-84 1.29 1.15 to 1.45 ⬍.001 ⱖ85 1.42 1.21 to 1.67 ⬍.001 Charlson comorbidity score
0 1 — 1 1.06 0.97 to 1.15 .21 2 1.23 1.09 to 1.39 .001 ⱖ3 1.38 1.20 to 1.59 ⬍.001 Sex Female 1 — Male 1.11 1.07 to 1.16 ⬍.001 Marital status Not married 1 — Married 0.94 0.87 to 1.01 .10 Median household income, quintile
Bottom 1 — Second 1.05 0.93 to .191 .41 Third 1.05 0.93 to .191 .40 Fourth 1.06 0.93 to 1.20 .38 Top 0.96 0.84 to 1.10 .55 Year of diagnosis 2000 1 — 2001 0.91 0.79 to 1.05 .19 2002 0.93 0.81 to 1.07 .32 2003 0.79 0.68 to 0.91 .001 2004 0.85 0.74 to 0.98 .026 2005 0.80 0.69 to 0.92 .0018 2006 0.69 0.60 to 0.80 ⬍.001 2007 0.73 0.63 to 0.85 ⬍.001 Region Midwest 1 — East 1.01 0.90 to 1.14 .83 South 0.97 0.86 to 1.10 .69 West 0.99 0.88 to 1.11 .88
continued on next column
Table 3.(continued) Variable OR* 95% CI P Physician density ⬍1 1 — 1-10 1.07 0.96 to 1.19 .24 11-20 1.08 0.94 to 1.25 .26 21-30 0.99 0.84 to 1.17 .92 31-40 1.06 0.91 to 1.23 .46 ⱖ40 1.07 0.94 to 1.21 .29 Abbreviations: OR, odds ratio; RT, radiotherapy.
physician interaction contributes to the decision of black pa-tients to reject the recommendation for the standard of care (surgery) in early-stage non–small-cell lung cancer.21Although
this study found racial inequality with prostate and colorectal cancers, a natural question arises: Why was there no disparity in breast or lung cancer? This question is challenging to answer; however, understanding the difference could shed light on the underlying cause of racial disparity. Potential hypotheses in-clude disease-specific biases or barriers somewhere from patient referral through radiation treatment, although race-based dif-ferences in tumor biology or disease trajectory should be ex-plored as well. Unfortunately, the data used in this project lack the granularity required to answer several of these questions, and underlying causes of tumor site–specific racial disparity in the use of palliative RT remains unknown. Factors such as referring or treating physician biases, communication break-downs, and race-based differences in tumor biology all warrant further study.
In addition to racial inequality, our study found that income level and age correlated independently with palliative RT. The correlation between estimated income level, age, and palliative RT is not unique to this study.3,4A SEER-Medicare study on
non–small-cell lung cancer between 1991 and 1996 and a Ca-nadian study evaluating the Ontario Cancer Registry between 1986 and 1995 both found that increased age and lower income level correlated inversely with the receipt of palliative RT. Of note, all participants in these studies had health insurance; how-ever, one could hypothesize that lower socioeconomic status would affect a patient’s ability to pay deductibles or copay-ments, which could affect his or her willingness to receive pal-liative RT. Although our study cannot address this hypothesis directly, increased copayments have been linked to a 15% de-cline in the use of emergency department services.22Another
possibility would be that patients with a lower income level could have less access to transportation, which would limit their ability to get to and from a radiation oncology clinic.23
Aside from inequality, this study found that a considerable number of patients died soon after receiving RT. Chemother-apy delivered within 2 weeks of death is considered a metric for decreased quality of care at the end of life24; however, the same
may not be true for palliative RT. Although chemotherapy can palliate, it is often delivered to induce a systemic response, decrease tumor burden, and prolong life. This stands in contrast with the principal goal of palliative RT: alleviating focal symp-toms. Despite this, a German study found that among patients who died within 2 weeks of receiving palliative RT, only 26% had stable or improved symptoms.25Among patients receiving
palliative RT in this study, 19% died within 2 weeks of com-pleting treatment, and one of three died within 1 month. A separate recently reported SEER-Medicare study evaluating lung, breast, prostate, colorectal, and pancreatic cancers from 2000 to 2007 found that nearly one in five patients who re-ceived RT within the last 30 days of life spent ⬎ 10 days receiving radiation treatment.6Identifying and understanding
the underlying causes of this complex subject poses a challenge, given that the timing of RT depends on multiple factors.
Al-though earlier patient identification and referral to a radiation oncologist could help, this approach may not be feasible in all patients, given their relatively short overall survival. Physicians consistently overestimate survival in patients with cancer at the end of life,26,27and improved prognostic tools or biomarkers28
could lead to enhanced patient selection. In addition, improve-ments in the delivery of radiation therapy, such as faster times from referral to treatment29 or shorter courses of palliative
RT,6,30,31would effectively lengthen the interval between RT
and death. Further research is desperately needed to better un-derstand this complicated issue.
This study has limitations that are worth mentioning. The administrative data in this study do not contain information on radiation target or dose. Therefore, this study included patients treated with RT for bone metastases, brain metastases, and symptomatic local disease, as well as RT for several other indi-cations. This heterogeneity precludes more-detailed subset analyses, and our results could theoretically differ between pa-tients treated with brain metastases, bone metastases, and other palliative RT targets. Another limitation relates to the fact that this study included patients age⬎ 66 years with an incident diagnosis of metastatic cancer and did not include patients with localized malignancies who subsequently developed metastatic disease. Therefore, conclusions reached here may not be gener-alizable to younger patients or those with metastatic cancer initially presenting with local disease. Finally, this study can only infer palliative treatment intent, because neither SEER nor Medicare explicitly record intent. A large majority of patients with stage IV disease have incurable cancer; however, a small subset of patients with oligometastatic tumors could have po-tentially curable disease, and therefore, RT may be adminis-tered with curative intent in this subset. Although this could have potentially skewed our results, we estimate that the subset of patients treated with curative intent accounted for a small fraction of the study population and therefore should not jeop-ardize our conclusions.
Despite these limitations, this study demonstrates signifi-cant inequality in the delivery of palliative RT among the el-derly, patients with comorbidity, and black patients with prostate and colorectal cancer. In addition, we show that a considerable proportion of patients die shortly after complet-ing radiation treatment. Understandcomplet-ing these patterns of care and further research into the underlying causes will improve the effectiveness of palliative RT.
Acknowledgment
Supported an American Society of Clinical Oncology Young Investigator Award (J.D.M.) and Master Research Agreement from Varian Medical Systems (J.D.M., Q.-T.L.). This study used the linked Surveillance, Ep-idemiology, and End Results (SEER) –Medicare database. The interpre-tation and reporting of these data are the sole responsibility of the authors. We acknowledge the efforts of the Applied Research Program, National Cancer Institute; the Office of Research, Development, and Information, Centers for Medicare and Medicaid Services; Information Management Services; and the SEER program tumor registries in the creation of the SEER-Medicare database.
Authors’ Disclosures of Potential Conflicts of Interest
Although all authors completed the disclosure declaration, the following author(s) and/or an author’s immediate family member(s) indicated a financial or other interest that is relevant to the subject matter under consideration in this article. Certain relationships marked with a “U” are those for which no compensation was received; those relationships marked with a “C” were compensated. For a detailed description of the disclosure categories, or for more information about ASCO’s conflict of interest policy, please refer to the Author Disclosure Declaration and the Disclosures of Potential Conflicts of Interest section in Information for Contributors.
Employment or Leadership Position:NoneConsultant or Advi-sory Role: NoneStock Ownership:NoneHonoraria: None Re-search Funding:Quynh-Thu Le, VarianExpert Testimony:None
Other Remuneration:None
Author Contributions
Conception and design:All authors
Financial support:James D. Murphy, Quynh-Thu Le
Administrative support:Quynh-Thu Le
Collection and assembly of data:James D. Murphy
Data analysis and interpretation:All authors
Manuscript writing:All authors
Final approval of manuscript:All authors
Corresponding author: James D. Murphy, MD, MS, University of Cali-fornia San Diego, Department of Radiation Medicine and Applied Sci-ences, 3960 Health Sciences Dr, La Jolla, CA 92093-0865; e-mail: [email protected].
DOI: 10.1200/JOP.2012.000835; published online ahead of print at jop.ascopubs.org on April 16, 2013.
References
1. Janjan NA: An emerging respect for palliative care in radiation oncology. J Palliat Med 1:83-88, 1998
2. Richter MP, Coia LR: Palliative radiation therapy. Semin Oncol 12:375-383, 1985
3. Hayman JA, Abrahamse PH, Lakhani I, et al: Use of palliative radiotherapy among patients with metastatic non-small-cell lung cancer. Int J Radiat Oncol Biol Phys 69:1001-1007, 2007
4. Huang J, Zhou S, Groome P, et al: Factors affecting the use of palliative radiotherapy in Ontario. J Clin Oncol 19:137-144, 2001
5. Kapadia NS, Mamet R, Zornosa C, et al: Radiation therapy at the end of life in patients with incurable nonsmall cell lung cancer. Cancer 118:4339-4345, 2012
6. Guadagnolo BA, Liao KP, Elting L, et al: Use of radiation therapy in the last 30 days of life among a large population-based cohort of elderly patients in the United States. J Clin Oncol 31:80-87, 2013
7. Earle CC, Neville BA, Landrum MB, et al: Trends in the aggressiveness of cancer care near the end of life. J Clin Oncol 22:315-321, 2004
8. Ho TH, Barbera L, Saskin R, et al: Trends in the aggressiveness of end-of-life cancer care in the universal health care system of Ontario, Canada. J Clin Oncol 29:1587-1591, 2011
9. Siegel R, Naishadham D, Jemal A: Cancer statistics, 2012. CA Cancer J Clin 62:10-29, 2012
10. Adamo MB, Johnson CH, Ruhl JL, et al (eds): 2012 SEER Program Coding and Staging Manual. Bethesda, MD, National Cancer Institute, NIH publication 12-5581, 2012
11. Virnig BA, Warren JL, Cooper GS, et al: Studying radiation therapy using SEER-Medicare linked data. Med Care 40:IV49-IV54, 2002 (suppl)
12. Surveillance, Epidemiology, and End Results: Appendix D: Race and Nation-ality Descriptions From the 2000 Census and Bureau of Vital Statistics. http:// seer.cancer.gov/manuals/2010/SPCSM_2010_AppendixD.pdf
13. Krieger N: Overcoming the absence of socioeconomic data in medical re-cords: Validation and application of a census-based methodology. Am J Public Health 82:703-710, 1992
14. Klabunde CN, Potosky AL, Legler JM, et al: Development of a comorbidity index using physician claims data. J Clin Epidemiol 53:1258-1267, 2000
15. Deyo RA, Cherkin DC, Ciol MA: Adapting a clinical comorbidity index for use with ICD-9-CM administrative databases. J Clin Epidemiol 45:613-619, 1992
16. Charlson ME, Pompei P, Ales KL, et al: A new method of classifying prog-nostic comorbidity in longitudinal studies: Development and validation. J Chronic Dis 40:373-383, 1987
17. US Department of Health and Human Services: 2009-2010 Area Resource File. http://arf.hrsa.gov/index.htm
18. Kaplan EL, Meier P: Nonparametric estimation from incomplete observa-tions. J Am Stat Assoc 53:457-481, 1958
19. Schulman KA, Berlin JA, Harless W, et al: The effect of race and sex on physicians’ recommendations for cardiac catheterization. N Engl J Med 340:618-626, 1999
20. Green AR, Carney DR, Pallin DJ, et al: Implicit bias among physicians and its prediction of thrombolysis decisions for black and white patients. J Gen Intern Med 22:1231-1238, 2007
21. Cykert S, Dilworth-Anderson P, Monroe MH, et al: Factors associated with decisions to undergo surgery among patients with newly diagnosed early-stage lung cancer. JAMA 303:2368-2376, 2010
22. Selby JV, Fireman BH, Swain BE: Effect of a copayment on use of the emergency department in a health maintenance organization. N Engl J Med 334:635-641, 1996
23. Goodwin JS, Hunt WC, Samet JM: Determinants of cancer therapy in elderly patients. Cancer 72:594-601, 1993
24. American Society of Clinical Oncology: The Quality Oncology Practice Initia-tive: Summary of Measures, Spring 2012. http://qopi.asco.org/Documents/ QOPISpring2012MeasuresSummary_003.pdf
25. Gripp S, Mjartan S, Boelke E, et al: Palliative radiotherapy tailored to life expectancy in end-stage cancer patients: Reality or myth? Cancer 116:3251-3256, 2010
26. Glare P, Virik K, Jones M, et al: A systematic review of physicians’ survival predictions in terminally ill cancer patients. BMJ 327:195-198, 2003
27. Hartsell WF, Desilvio M, Bruner DW, et al: Can physicians accurately predict survival time in patients with metastatic cancer? Analysis of RTOG 97-14. J Palliat Med 11:723-728, 2008
28. Feliu J, Jime´nez-Gordo AM, Madero R, et al: Development and validation of a prognostic nomogram for terminally ill cancer patients. J Natl Cancer Inst 103: 1613-1620, 2011
29. de Sa E, Sinclair E, Mitera G, et al: Continued success of the rapid response radiotherapy program: A review of 2004-2008. Support Care Cancer 17:757-762, 2009
30. Borgelt B, Gelber R, Kramer S, et al: The palliation of brain metastases: Final results of the first two studies by the Radiation Therapy Oncology Group. Int J Radiat Oncol Biol Phys 6:1-9, 1980
31. Hartsell WF, Scott CB, Bruner DW, et al: Randomized trial of short- versus long-course radiotherapy for palliation of painful bone metastases. J Natl Cancer Inst 97:798-804, 2005
Appendix Prostate Breast Colorectal Lung 1 No. at risk Prostate Breast Colorectal Lung 2,524 1,564 1,448 14,527 1,087 577 378 1,192 424 129 53 103 204 50 21 27 306 80 35 50 545 210 93 199 765 346 191 417 2 3 4 5 6 Survival Probability
Time Since End of Radiation (years) 1
0.75
0.5
0.25
0