Education, Job Openings, and
Unemployment in Metropolitan America
Jonathan Rothwell“ Less educated
regional labor
markets may lack
entrepreneurs
who start
or expand
businesses,
leading to
fewer overall
openings and
fewer openings
for less educated
workers.”
Findings
An analysis of labor markets using data on adult educational attainment, occupations, and job openings in the 100 largest metropolitan areas from January of 2006 to February of 2012 finds that:
n Advertised job openings in large metropolitan areas require more education than all existing jobs, and more education than the average adult has attained. In the 100 largest metropolitan areas, 43 percent of job openings typically require at least a bachelor’s degree, but just 32 percent of adults 25 and older have earned one.
n Metro areas vary considerably in the level of education required by job openings posted online. Roughly half of openings in San Jose, San Francisco, and Washington, D.C. require a bachelor’s degree or higher, while fewer than one-third of openings require a bachelor’s degree in metropolitan McAllen, TX and Youngstown, OH.
n Unemployment rates are 2 percentage points higher in large metro areas with a short-age of educated workers relative to demand and have been consistently higher since before the recession. The gap between education demand and supply is small in Madison, Washington, Raleigh, and Minneapolis, and large in metro areas throughout California’s Central Valley. Both less educated and younger workers are much more likely to be working if they live in metropolitan areas with a smaller education gap.
n Declines in industry demand and housing prices explain most of the recent cyclical increases in metropolitan unemployment rates, but education gaps explain most of the structural level of metropolitan unemployment over the past few years. Changes in house prices (prompting a reverse wealth effect) and industrial demand explain roughly three-quar-ters of the trend in unemployment rates across large metropolitan areas since the recession began. However, metropolitan education gaps explain roughly two-thirds of variation in the level of unemployment across metro areas, posing a longer-run challenge for many regional labor markets.
n Metro areas with higher education gaps have experienced lower rates of job creation and job openings over the past few years. Educational attainment, overall and relative to existing demand, benefits metro areas by making workers more employable and firms more competi-tive and entrepreneurial—thus leading to more job openings for less educated workers. By con-trast, education gaps do not appear to be related to employer difficulty in filling job openings in metro areas.
In the short-term, unemployment rates are unlikely to come down to their pre-recession lev-els without improvements in housing markets and consumer demand. Yet high educational attainment is essential for the health of metropolitan labor markets before, during, and after recessions. Educational attainment makes workers more employable, creates demand for com-plementary less educated workers, and facilitates entrepreneurship. To better train less educated adults, non-profit organizations, community colleges, and governments can use detailed job openings data to align training curricula and certifiable skills with employer demand.
Introduction
T
he national picture of economic recovery is ambiguous and frustrating in its inconsistency, as evidenced in the varied paths of the nation’s metropolitan areas. Some metropolitan labor markets have nearly recovered their pre-recession unemployment rates. For example, in 19 large metropolitan areas, the unemployment rate, as of May 2012, is less than 2 percentage points above its pre-recession minimum. In another group of 31 metro areas, the unemployment rate is at least 4 percentage points above its pre-recession minimum.Despite the wide variation in economic health across the country, economic policies in Washington are generally debated and formulated as if all regions had the same economic experience. The federal policy debate about what can be done to address the slow recovery (and stave off a disaster if Europe falters) has been highly polarized between those who support more stimulus (monetary or fiscal) and those calling for regulatory and tax reform, in the context of a smaller public sector.1 Other ideas rel-evant to housing, education, and training have been largely ignored or faltered politically, despite the possibility of readily adapting them to regional circumstances.
Central to this discussion is the need to distinguish between short-term (i.e. cyclical) and long-term (i.e. structural) characteristics.2 Over the short term, severe financial crisis and subsequent public sec-tor debt crisis in Europe have dragged down U.S. GDP growth and the demand for goods and services. Over the long term, there has been a shift in developed countries towards higher skilled non-routine labor since the 1960s and 1970s. The creation and adoption of new information technologies have displaced routine work while making educated workers more productive.3
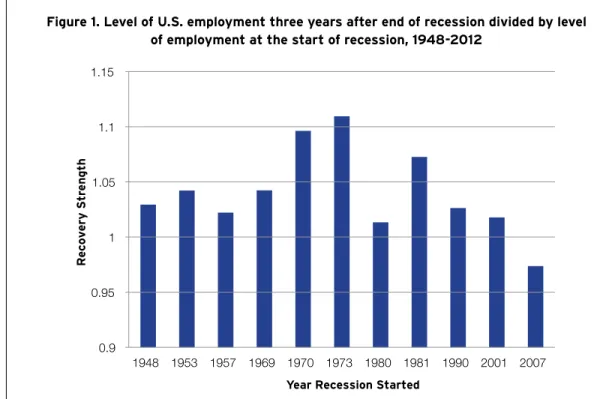
The slow recovery has raised concerns that the Great Recession exacerbated structural issues in the labor market. As Figure 1 shows, the jobs recovery since the Great Recession ended has been the weakest in the post-World War II era. Using National Bureau of Economic Analysis recession dates, the current period is the only recovery since 1948 in which jobs have not recovered their pre-recession level after three years.4
Figure 1. Level of U.S. employment three years after end of recession divided by level of employment at the start of recession, 1948-2012
Source: Brookings analysis of Bureau of Labor Statistics data, using NBER recession dates. Start of recession is first month of recession, and three years after recession is three years after the last month of recession.
0.9 0.95 1 1.05 1.1 1.15 1948 1953 1957 1969 1970 1973 1980 1981 1990 2001 2007 Recovery Str ength
Observing the labor market difficulties of less educated workers and various other factors, a num-ber of economists have suggested that employers may be finding it difficult to find qualified candi-dates to fill jobs openings, causing higher unemployment.5 Indeed, surveys of employers find that many report difficulty filling vacancies.6
The importance of education to the labor market notwithstanding, the evidence suggests that the need for higher education is mostly a long-term problem that is not the primary factor responsible for increasing unemployment rates since the recession began; the fall in demand for goods and services has played a stronger role in recent changes in unemployment.7 The problem is a lack of job openings, rather than difficulty filling available jobs. Given that more than half of new jobs typically come from establishments started within five years, the lack of openings implies a need for more entrepreneurship, as well as higher demand.8
Yet, beyond difficulty filling existing jobs, inadequate education can have other important short-term consequences, weakening recovery. A number of scholars have documented the strong relation-ship between education and entrepreneurrelation-ship and various metrics of economic dynamism.9 A lack of job openings is typically considered a cyclical problem, but it may have structural roots as well. Less educated regional labor markets may lack entrepreneurs who start or expand businesses, leading to fewer overall openings and fewer openings for less educated workers. Educated workers create demand for less educated workers in two ways: by buying goods and services provided by less edu-cated workers and by employing them directly in businesses they start.
To investigate these issues, this study focuses on how the degree of balance between the supply of and demand for education affects unemployment and job openings in metropolitan labor markets. Given the wide variation in economic health across regions, an analysis of metropolitan areas has the potential to uncover patterns that are lost in national data. The goal is to distinguish educational matching issues from cyclical and other structural issues that may also be of significance in prolong-ing this recession.
This paper aims to provide metro, state, and national policy makers and voters with a better sense of the specific problems facing metropolitan labor markets. It analyzes job openings data in the nation’s 100 largest metropolitan areas, in combination with a variety of other economic indicators. It updates a Brookings study from September 2011 focused on the educational requirements of existing jobs in metro areas.10 After explaining the methodology, the report examines trends in the demand for educated labor and how a gap between education supply and demand is related to unemploy-ment. Next, the analysis attempts to distinguish between cyclical and structural effects before turn-ing to an explanation of how an education gap might affect both by limitturn-ing job creation. It concludes with a discussion of the implications of these findings for public policy.
Methodology
T
his section provides a basic summary of the data and methods used to create the key variables employed in this analysis. The methodological appendix presents more detailed information on technical aspects of the analysis, as well as some of the metrics used in the report.Job Openings
Data on job openings come from the Conference Board Help Wanted Online Data Series (HWOL). These data represent all online advertised job vacancies, which are accumulated from a large number of job boards before removing duplicate announcements. Data used in this report cover the period from January of 2006 to February of 2012 for only the 100 largest metropolitan areas in the United States. The data were aggregated to detailed occupational codes (using the six digit Standard Occu-pational Classification system from the Bureau of Labor Statistics) for each metropolitan area.
Most labor market studies look at existing jobs, and track net job creation and destruction to exam-ine progress over time. However, for most people looking for a job, the most important set of jobs are vacancies, which are driven in large part by turnover.11 Openings data track jobs that are currently available.
The fact that the HWOL database is based on advertised online vacancies raises questions as to whether or not certain kinds of jobs are more or less likely to be advertised online. The appendix analyzes the potential bias.12 The reader should keep in mind that metro areas with a disproportionate number of jobs in computer, restaurant, or retail occupations may see the educational requirements of their jobs over-stated by these data. For that reason, alternative education gap measures will also be reported based on all existing jobs (i.e. those already filled) and a comprehensive measure that consid-ers the educational requirements of both vacant and filled jobs.
Educational requirements of Job Openings
To measure education demand per occupation, the distribution of educated workers is calculated across six education categories (less than high school, high school, some college, Associate’s degree, Bachelors degree, Masters, Doctorate/Professional degree) for every minor occupational category in the United States.13 The data required to do this come from various years of the Census Bureau’s American Community Survey, with the most recent year being 2010.14
This approach assumes that the education attained by the average U.S. worker for a given occu-pation indicates the years of education demanded by employers for that same occuoccu-pation across regions. Levels of educational attainment, such as less than high school, are assigned years of education based on the median years of education for people in each educational category.15 The educational requirements for each occupation were calculated for each year, and then matched to job openings data. A metropolitan area-level measure of education demand is then generated based on the occupational category of every job opening in that metro area. In other words, the average years of education demanded by all job openings in a metro area is the weighted average of the educational requirements of each individual job opening in that metro area.
Consider the example of construction trade workers.16 In 2007, 27 percent had less than a high school diploma; 44 percent had a diploma or equivalent; 5 percent had an associate’s degree; 19 percent had some college; 4 percent had a bachelor’s degree; 1 percent had a master’s degree; and 0 percent had a Ph.D or professional degree. Therefore, a metropolitan economy consisting of only 100 construction trade openings exhibits demand for 27 people without diplomas; 44 with diplomas; five with associate’s degree, etc. To calculate the average skill years demanded by the metropolitan economy, one would multiply the percentages quoted above by the number of years of schooling implied by each educational category. The sum of those products is the years of education demanded. The result is 12 years of education for the average construction trade workers in 2007, compared to an average of 13.7 for all occupations. The equation below shows the formula.
Average education demanded for worker in a given occupation = 10 x (share with less than high school diploma) + 12 x (share with high school diploma) +13 x (share with some college) +14 x (share with associate’s degree) + 16 x (share with bachelor’s degree) + 18 x (share with master’s degree) + 20 x (share with doctorate or professional degree).
Education gap for metropolitan areas
The education gap is defined in this report as the extent to which demand for educated workers, as revealed in data on job openings and occupations, exceeds the supply of those workers, as revealed in data on adult educational attainment, in a given regional labor market.17
The education gap index is calculated as the years of education required by the average job vacancy in a metropolitan area divided by the years of education attained by the average working-age person in that metropolitan area. Subtracting by one and multiplying by 100 yields the percentage gap between supply and demand. Index values greater than zero signal an insufficient supply of educated workers in the regional labor market relative to demand. Values below zero indicate that the average worker has enough formal education to do the average job. A value below zero does not mean that all workers have enough education.
Aside from fact that this measure is a rough estimate of the balance between education supply and demand in a metro area labor market, it has other limitations. It ignores informal skills learned from on-the-job-training, non-academic learning, and experience. These would be much more difficult to measure and compare across metropolitan areas, whereas measures of formal educational attainment
are fairly standardized.
Measuring education supply is more straightforward. The Census Bureau’s American Community Survey reports the share of working-age metropolitan residents with each level of educational attain-ment.18 The percentages are multiplied by the corresponding years of education to get a measure of years of education attained (or supplied) by the average metropolitan worker.
This education gap index uses job openings to measure the demand for education, but those are only a fraction of total demand. So, the report also includes alternative measures of education demand—one using filled jobs and one using both filled and vacant jobs. These measures combine data from the Bureau of Labor Statistics and HWOL. For the combined measure, only new vacancies are considered from HWOL to avoid over-counting openings that are available for more than one month. The number of jobs in each minor occupation (three-digit SOC code) are combined across the two data sources and matched to the Census data on educational requirements.
Predicted industry job growth
Alongside education gaps, this report also examines how shifts in industry demand may have affected metropolitan unemployment rates, particularly during the Great Recession.
To account for the potential impact of metropolitan industrial profiles on metropolitan unemploy-ment rates, this report constructs a single index to predict total metropolitan job growth based on U.S. job growth in each of the metropolitan area’s significant industries.19
The predicted job growth index how a metropolitan area’s employment level would change if each of its industries grew at the same rate as national employment for those industries.
In practice, the index multiplies the share of total metropolitan jobs for each metro area industry by the national growth rate of jobs in that industry over the period of interest (e.g. the recession); then, the metropolitan-specific products are summed to total predicted job growth for the metropolitan area, weighted by the area’s industry shares. In plain language, the index measures how national trends affect a metro area, given the metro area’s unique mix of industries.
A key advantage of this index is that it is unlikely to be biased by other aspects of the metropolitan area, including its unemployment rate, and it concentrates information for roughly 100 industries in 100 metro areas into one single measure for every metropolitan area. To be sure, metropolitan area trends in industry employment depend on that area’s specific companies and enterprises, only some of which may track their industry peers in other parts of the country.20 Thus, the results discussed below should not be not be interpreted as the effect of job growth on unemployment, but rather the effect of a metro area’s industry mix on unemployment.21
Housing Market Dynamics
The Federal Housing Finance Agency (FHFA) provides time series data on housing prices (using repeated sales of all mortgages securitized by Fannie Mae or Freddie Mac) by quarter for each met-ropolitan area. The report uses these data to show how changes in housing prices have affected metropolitan unemployment. The underlying calculations from the FHFA include all conforming con-ventional mortgages purchased or securitized by Fannie Mae or Freddie Mac, and are based on repeat transactions to adjust for differences in housing quality. An annual growth rate in the housing price index was calculated for each metropolitan area from 2006 up through the first quarter of 2012 for the regression analyses shown in the appendix. The summary measures reported in tables below show the housing growth rate over that entire period, 2006 until the first quarter of 2012.
Control variables
Other control variables are used to account for the fact that metro areas vary in their demographic compositions, which affects their unemployment rates. Thus, the formal analysis, which is described in the methods appendix, adjusts for the percentage of workers aged 65 and older, the median age of the population, and the share of population that is white, black, and foreign-born. These data were gathered for recent years from the U.S. Census Bureau’s American Community Survey.
Data on unemployment rates were obtained from the U.S. Bureau of Labor Statistics (BLS). The data are annual except for the latest available observation, which is from January of 2012 and not seasonally adjusted because of data limitations.22 U.S. and metropolitan employment statistics were obtained from Moody’s Analytics and calculated at the three-digit NAICS level.
Analysis
To analyze the data, the report employs a regression analysis to understand the effects of a potential education gap, housing depreciation, and trends in predicted industry demand, while holding other factors constant, such as unchanging metropolitan area characteristics and year to year trends that affect all metros. The main findings here are supported by that background analysis. The methods appendix describes the details of the more formal techniques.23 Data were collected and analyzed for 100 largest U.S. metropolitan areas by population in 2010. Those metro areas are home to roughly 65 percent of all Americans.
Findings
Advertised job openings in large metropolitan areas require more education than all
existing jobs and more education than the average adult has attained.
As of May 2012, the unemployment rate of workers with a high school diploma or less education is 9.9 percent, whereas the unemployment rate of workers with a bachelor’s degree or higher is 3.9 percent. More educated adults are also much more likely to be in the labor force. The labor force participation rate for those with a high school diploma or less is just 55 percent, compared to 77 percent for those with a bachelor’s degree.
One explanation as to why less educated workers struggle to find work is that there just are not enough job openings available for them. Figure 2 below shows the trend in the educational require-ments of job vacancies since 2006. A mere 24 percent of all jobs in 2012 are available to workers without at least some post-secondary education. The plurality of jobs—43 percent—are available only to highly educated workers with at least a four-year college degree. These trends held fairly steady dur-ing the recession, after a slight increase in the educational requirements of the average job beginndur-ing in 2007. The housing market crash that began in 2006 lowered demand for less educated construc-tion workers in particular. The proporconstruc-tional shift towards higher educaconstruc-tion is modest but notable—the share of vacant jobs for workers with a high school diploma or less decreased by three percentage points, from 27 percent to 24 percent.
The struggles of less educated workers are more apparent when openings data are compared with data on the educational attainment of the unemployed. Figure 3 shows how job opportunities for the unemployed varied by education group both before and after the recession, in 2007 and 2011. In both years, highly educated unemployed workers had many more openings available to them. In 2007, there were 12.0 jobs available (over the entire year) for every one job seeker with a bachelor’s degree or higher. This compares to just 2.9 jobs for workers with a high school diploma or less and 6.5 jobs for those with some college or an associate’s degree. In 2011, there were many fewer jobs available overall, but the gap by education remained. For those with no post-secondary education, the rate was just 1.6 annual openings for every unemployed worker, compared to 5.6 openings for unemployed work-ers with a bachelor’s degree. These findings suggest that the recession did not significantly alter the underlying labor market trend that favors workers with more education.
While roughly 40 percent of the U.S. population aged 25 and older living in large metro areas has a high school diploma or less, only 25 percent of jobs advertised online are available for workers with that level of education. A somewhat higher share (34 percent) of all jobs—vacancies and existing
Figure 2. Job openings in the 100 largest metropolitan areas by level of education required, 2006 to February 2012
Source: Brookings analysis of Conference Board HWOL. Low refers to jobs that require a high school diploma or less, medium refers to some college or an Associate’s degree, and high refers to a bachelor’s degree or higher.
Figure 3. New Annual Job Openings per Unemployed Worker by Education Level
Source: Brookings analysis of Conference Board HWOL, Census Bureau American Community Surveys, and Bureau of Labor Statistics. Population of unemployed workers is limited to those between the ages of 25 and 64. Openings are only new open-ings to avoid over-counting reposted openopen-ings.
0 0.05 0.1 0.15 0.2 0.25 0.3 0.35 0.4 0.45 2006 2007 2008 2009 2010 2011 2012
High school or less Some college or associate’s Bachelors or higher 2.9 6.5 12.0 5.2 1.6 3.0 5.6 2.4 0 2 4 6 8 10 12 14 High school diploma or less Some college or associate's degree Bachelor's degree or higher All Workers Openings per unemployed worke r 2007 2011
jobs—are available to these workers. Similarly, while about 32 percent of all adults have a bachelor’s degree, and 32 percent of all jobs are in occupations that typically require that degree, the same is true for fully 43 percent of advertised vacancies. Insofar as online vacancies have higher-than-average educational requirements, less educated jobseekers may have to depend more on physical searching and social networks, and will have a harder time relying on computer-based methods for job search. Table 1. Job vacancies in January and February of 2012 by Educational Requirements and Minor Occupation
Number of Average year Percent of workers with bachelor’s openings of education, 2012 degree or higher education, 2012
Computer Occupations 859,833 15.4 63%
Health Diagnosing and Treating Practitioners 443,611 16.7 71%
Other Management Occupations 196,199 14.6 47%
Financial Specialists 184,312 15.6 71%
Business Operations Specialists 183,574 15.0 56%
Sales Representatives, Services 178,859 14.5 48%
Engineers 177,581 16.0 79%
Information and Record Clerks 177,194 13.3 19%
Advertising, Marketing, Promotions, Public Relations,
and Sales Managers 168,646 15.3 66%
Supervisors of Sales Workers 164,610 13.6 28%
Source: Brookings analysis of data from the Conference Board’s HWOL series, and the 2010 American Community Survey. Roughly two-thirds of of these openings are new; the rest are repeated for at least one month and so overstate the total number of eventual jobs.
Figure 4. The share of adults aged 25 and older by level of education in large metro areas compared to the share of 2012 job openings by level of education
Source: Brookings analysis of Conference Board HWOL data, the Bureau of Labor Statistics (BLS), and the 2010 American Community Survey. Metro area educational attainment rates are weighted by population. Openings refers to all online vacan-cies, while openings and existing jobs also includes all jobs currently filled, as reported by the BLS.
40% 28% 32% 34% 33% 32% 25% 32% 43% 50% 45% 40% 35% 30% 25% 20% 15% 10% 5% 0% High School or less Some college or associate’s degree Bachelor’s degree or higher Share of adults 25 and older Share of jobs from openings & existing jobs Share of jobs from openings
Many of the occupations advertised most online have relatively high educational requirements. Table 1 lists the 10 minor occupations with the largest number of job openings in the first two months of 2012 in large metro areas. For eight of these ten occupations, the share of workers with a bachelor’s degree or higher is above the share of adults aged 25 and older in large metropolitan areas with a bachelor’s degree or higher (32 percent). The most heavily advertised online job vacancies are in Computer Occupations, which typically demand at least a bachelor’s degree. Other heavily demanded and high-education occupations include Health Diagnosing and Treating Practitioners (in which more than half of the jobs are for registered nurses), Financial Specialists, and Engineers.
Metro areas vary considerably in the level of education required by job openings
posted online.
Even within the 100 largest metropolitan areas, demand for education varies considerably. As Table 2 shows, 56 percent of advertised openings in San Jose and 49 percent in San Francisco, Washington, and Bridgeport metro areas require a bachelor’s degree or higher, while less than one-third do in McAllen, Texas, Honolulu, Youngstown, Ohio, and Cape Coral, Florida.
Current demand for workers with at least a bachelor’s degree—as indicated by online job vacancies— exceeds supply in all but one large metro area, Madison; even there, the margin is just two percentage points. In the average large metro area, the rate of college degree attainment is 10 percentage points
Table 2. Metro area with the highest and lowest level of demand for workers with a bachelor’s degree or higher, relative to all existing jobs and educational attainment rates, 2012
Share of job openings Share of existing jobs Bachelor’s degree or requiring a bachelor’s requiring a bachelor’s higher attainment degree or higher, 2012 degree or higher, 2011 rate, 2010
Large metro areas with the highest level of demand for workers with a bachelor’s degree or higher
San Jose-Sunnyvale-Santa Clara, CA 56% 36% 45%
San Francisco-Oakland-Fremont, CA 49% 32% 43% Washington-Arlington-Alexandria, DC-VA-MD-WV 49% 37% 47% Bridgeport-Stamford-Norwalk, CT 49% 31% 44% Seattle-Tacoma-Bellevue, WA 48% 31% 37% Boston-Cambridge-Quincy, MA-NH 48% 33% 43% Atlanta-Sandy Springs-Marietta, GA 47% 30% 34%
New York-Northern New Jersey-Long Island, NY-NJ-PA 46% 31% 36%
Chicago-Joliet-Naperville, IL-IN-WI 46% 29% 34%
Hartford-West Hartford-East Hartford, CT 45% 32% 35%
Large metro areas with the lowest level of demand for workers with a bachelor’s degree or higher
Oklahoma City, OK 34% 27% 28% New Orleans-Metairie-Kenner, LA 34% 26% 27% Toledo, OH 34% 26% 24% North Port-Bradenton-Sarasota, FL 33% 25% 27% Scranton--Wilkes-Barre, PA 33% 25% 22% Tulsa, OK 33% 26% 25% McAllen-Edinburg-Mission, TX 32% 27% 16% Honolulu, HI 32% 28% 32% Youngstown-Warren-Boardman, OH-PA 31% 23% 19%
Cape Coral-Fort Myers, FL 29% 22% 23%
Average 100 largest metro area 39% 28% 29%
Source: Brookings analysis of data from the Conference Board’s HWOL series, the BLS, and the 2010 American Community Survey. Job openings are vacancies adver-tised online. Attainment rate applies to adults 25 years and older.
lower than the share of advertised vacancies that require a college degree. The gap between supply and demand for each metro is explored more directly in the next section.
A more direct way to measure job opportunities and job competition is through openings per unemployed worker, which also varies widely across metro areas. Metropolitan Omaha, Nebraska, for example, has the most annual job openings per unemployed worker at 5.6. For workers with bachelor’s degrees, the rate is 12.4. Yet, even in this market, there are only 3.6 job openings per worker for those with a high school diploma or less. Table 3 compares the number of job openings by education to the number of workers by education for the metro areas with the 10 most vacancies per unemployed worker—for high and less educated workers in 2011.
A surprising mix of metro areas that includes both healthy and struggling labor markets have the most job vacancies for workers with a bachelor’s degree or higher per unemployed worker. The list includes some metro areas with a large number of overall openings relative to unemployed work-ers—like Omaha and Des Moines. In these metro areas, all unemployed job seekers tend to have a large number of openings available to them, not just the highly educated. Yet, in Bakersfield and Modesto there are roughly 10 times more job openings per unemployed worker for the highly educated than there are for the less educated. In Greenville, there are four times as many. Even in troubled metro economies, there are opportunities for highly educated workers.
The bottom of the table lists the metro areas with the most job openings for every less educated unemployed worker. These are the metro areas with the most job opportunities for unemployed work-ers who have not attended college. They tend to be areas that are generally doing well, like Madison, Raleigh, and Pittsburgh.
Table 3. Metropolitan areas with the most job openings per unemployed worker in 2011 by educational attainment
Workers with high school Worker with bachelor’s
All workers diploma or less, 2011 degree or higher, 2011
Metro areas with most vacancies per unemployed worker with bachelor’s degree or higher
Harrisburg-Carlisle, PA 4.0 4.3 14.5
Des Moines-West Des Moines, IA 4.4 4.1 13.0
Omaha-Council Bluffs, NE-IA 5.6 3.6 12.4
Little Rock-North Little Rock-Conway, AR 3.1 2.5 11.9
Greenville-Mauldin-Easley, SC 2.8 2.1 11.9 Bakersfield-Delano, CA 1.1 0.7 11.5 Tulsa, OK 3.6 3.0 10.7 Honolulu, HI 5.1 4.1 10.3 Baltimore-Towson, MD 3.8 2.4 10.0 Modesto, CA 1.1 0.8 9.9
Metro areas with most vacancies per unemployed worker with high school diploma or less
Madison, WI 4.7 5.0 7.9
Harrisburg-Carlisle, PA 4.0 4.3 14.5
Honolulu, HI 5.1 4.1 10.3
Des Moines-West Des Moines, IA 4.4 4.1 13.0
Minneapolis-St. Paul-Bloomington, MN-WI 4.1 3.9 7.4
Omaha-Council Bluffs, NE-IA 5.6 3.6 12.4
Raleigh-Cary, NC 4.5 3.5 6.6
Oklahoma City, OK 4.3 3.3 8.7
Rochester, NY 2.5 3.1 4.7
Pittsburgh, PA 3.4 3.0 8.0
Average of all 100 large metros 2.6 1.9 6.8
Source: Brookings analysis of data from the Conference Board’s HWOL series, the BLS, and the 2010 American Community Survey. Workers refer to adults between the ages of 25 and 64. Vacancies refer to only new vacancies, advertised online, such that openings reposted after one month were not included.
The results have largely focused on demand from the perspective of job vacancies advertised online. It is worth noting that existing jobs tend to require considerably less education than those advertised online; this partly due to the fact that some businesses—like restaurants—are less likely to advertise on-line, but it also represents a shift in demand. The difference in education requirements between existing jobs and open jobs means that many metro areas will have to adjust to the reality that for every retirement, layoff, or expansion, the replacement jobs or new jobs will require more education. This presents a major challenge to many less educated workers and less educated metros.
Unemployment rates are 2 percentage points higher in large metro areas with a
short-age of educated workers relative to demand, and have been consistently higher since
before the recession.
The preceding analysis implies that there are large mismatches in the supply of and demand for edu-cated workers in many metropolitan areas. The question is: Does this mismatch translate into higher unemployment? The answer appears to be yes.
Metro areas were classified into those with high or low education gaps, depending on whether they were above or below the average of all large metro areas on the education gap index. Those with a high education gap—where demand is much larger than supply—have an average unemployment rate, as of in May 2012. This compares to just 7 percent for metro areas with below average education gaps. Figure 5 presents these results.
Even if the aggregate unemployment rate is lower in metro areas that are well educated for their jobs, some might predict that the unemployment rate for less educated or less experienced work-ers might be higher. Indeed, it would seem that in metro labor markets with a high share of educated workers, less educated or experienced workers would have a difficult time competing.
Paradoxically, however, metro areas with the most highly educated workers relative to demand also have the lowest unemployment rates for both less educated and less experienced workers, as Figure 5 shows. The opportunities for those with the least education are often in the metro area labor markets with the most education. This is not an entirely novel finding. Urban economists have shown that higher-educated workers in high-tech and other exporting sectors stimulate demand for local service jobs that employ less educated workers.24 Moreover, college educated workers are much more likely to employ others in their own business.25 To be sure, living in a metro area with
Figure 5. Average unemployment rates overall, for less educated workers, and for the youth, by Education Gap, in the 100 largest metropolitan areas
Source: Brookings analysis of Conference Board HWOL, BLS, and 2010 American Community Survey. Unemployment rate of less educated workers refers to those with a high diploma or less education. Youth refers to adults between and including the ages of 18 and 24. 7.0 12.7 19.1 8.9 14.4 22.3 0 5 10 15 20 25
Unemployment Rate (May 2012)
%Less Educated Unemployment Rate, 2010
Youth Unemployment Rate, 2010
a relatively low education gap does not solve unemployment. The youth unemployment rate—a measure of inexperienced workers—is still a startling 19.1 percent in metro areas with low educa-tion gaps, and the unemployment rate for workers with no college is still 12.7. Yet, both of these are significantly below—by 3.2 and 1.7 percentage points respectively—comparable unemployment rates in metro areas with high education gaps.
This pattern can be further illustrated by looking at specific metro areas. As Table 4 shows, the 10 metro areas with the lowest education gaps have relatively low unemployment rates for less edu-cated and less experienced workers. Some of these metro areas are not particularly high-skilled labor markets, but they have a strong balance. These include Honolulu, Provo, Rochester, Poughkeepsie, and Charleston.26 The other five metro areas are characterized by both high demand and high supply of education, exemplified by Washington, D.C. The implication is that metro areas succeed when their workers have high educational attainment for their occupations. Whether that is a PhD or Associate’s degree depends on the occupation.
Madison is the only large metro area with more than enough educated workers to meet demand in job openings, but this competition for high-skilled jobs does not appear to harm the highly educated, much less the labor market. The unemployment rate of those with a bachelor’s degree or higher is just Table 4. The education gap and unemployment rates for all workers, less educated workers, and youth
by large metro area, 2010
Education Unemployment Less educated Youth
gap for rate, unemployment unemployment
openings, 2012 January 2012 rate, 2010 rate, 2010
Metro areas with smallest education gap for job openings
Madison, WI -1.1% 5.3 9.2 10.8 Honolulu, HI 0.2% 5.7 8.9 14.3 Provo-Orem, UT 0.5% 5.9 12.8 14.2 Raleigh-Cary, NC 1.3% 8.4 14.6 19.4 Washington-Arlington-Alexandria, DC-VA-MD-WV 1.4% 5.7 10.6 19.3 Rochester, NY 1.8% 8.6 8.8 17.3 Colorado Springs, CO 1.9% 9.6 13.7 19.7 Poughkeepsie-Newburgh-Middletown, NY 2.0% 8.3 9.6 21.3 Charleston-North Charleston-Summerville, SC 2.1% 7.7 14.9 22.9
Minneapolis-St. Paul-Bloomington, MN-WI 2.4% 5.9 10.4 17.8
Average of 10 metro areas with smallest gap 1.3% 7.1 11.4 17.7
Metro areas with largest education gap for job openings
Houston-Sugar Land-Baytown, TX 8.3% 7.6 9.9 17.9
Augusta-Richmond County, GA-SC 8.5% 9.1 14.1 25.3
Riverside-San Bernardino-Ontario, CA 8.9% 12.4 18.3 27.5 Stockton, CA 9.7% 16.6 20.5 28.3 Lakeland-Winter Haven, FL 10.8% 10.5 17.6 23.4 Fresno, CA 11.0% 16.9 18.7 24.1 Modesto, CA 11.8% 16.9 20.1 32.2 El Paso, TX 13.0% 10 9 18 Bakersfield-Delano, CA 13.7% 15 17.4 24.3 McAllen-Edinburg-Mission, TX 13.9% 11.7 11.9 21
Average of 10 metro areas with largest gap 11.0% 12.7 15.8 24.2
Average of 100 largest metro areas 5.1% 8.7 13.5 20.5 Source: Brookings analysis of Conference Board HWOL, BLS, and 2010 American Community Survey. Unemployment rate of less educated workers refers to those with a high diploma or less education. Youth refers to adults between and including the ages of 18 and 24.
3.7 percent in Madison—well below the large metro average of 4.8 percent. There is no evidence that a metro area can suffer from being too educated.
At the bottom of the table, metro areas with large education gaps all have low educational attain-ment rates. Again, five exhibit below-average demand for educated labor, and five exhibit above-average demand. Job openings in Houston, for example, require an above-average of 14.5 years of education, which is above the average for all metro areas, but the average worker in Houston has just 13.3 years (slightly below the metro average of 13.6). In McAllen, by contrast, vacancies require an average of just 13.9 years of education, but the average worker has obtained a mere 12.2 years.
In metro areas with low education gaps, unemployment rates are considerably lower for the aver-age worker, for the less educated, and for young adults. The differences are large, between 4 and 6 percentage points. In healthy labor markets, characterized by a highly educated workforce, all groups do better, even those with the least education and experience.
Notably, a metro area’s education gap does a better job explaining its rate of unemployment than more straightforward measures of educational attainment alone. The simple correlation coefficient between a metro area’s rate of bachelor’s degree attainment and unemployment rate in 2010 is -0.53; the higher the attainment rate, the lower the unemployment rate. The correlation coefficient between its education gap and unemployment rate using openings is stronger, at 0.66. The correlation with the alternative education gap measures—using filled jobs and filled jobs combined with vacant jobs—is also high, at 0.55 and 0.59 respectively. The appendix analyzes these relationships in more detail.
Declines in industry demand and housing prices explain most of the recent cyclical
increases
in metropolitan unemployment rates, but education gaps explain most of the
structural level of metropolitan unemployment over the past few years.
The education gap between job openings and workers clearly relates to unemployment in metro-politan areas. This section explores how its importance ranks alongside other factors that have contributed to recent metropolitan economic woes, notably industry demand and house prices.
Industry performance
Cyclical national trends in demand for employment by industry can strongly affect unemployment at the metropolitan level, depending on each metro area’s unique industrial composition. Job growth has varied widely across national sectors since 2006, translating to potentially considerable variation across metropolitan economies.
For example, manufacturing has been strong recently, with 430,000 net jobs added over those two years, but is still very far from its pre-recession peak. Thus, manufacturing-oriented metro areas like Akron and Detroit fell a long way down but have seen a strong rebound, however incomplete. The energy sector—mining, oil, and gas—is one of the few sectors to fully recover and even surpass pre-recession employment levels, boosting job growth in places like Oklahoma City. Health care and educa-tion were the only major sectors with consistent growth throughout the recession and recovery, giving an advantage to metropolitan areas concentrated in those industries, like Pittsburgh.
While specific companies do better or worse than their same-industry peers, to a large extent, a metro area’s industry dynamics are like stock market prices, in that metro companies have limited influence over national and international market trends. Metropolitan areas with employment in grow-ing industries (those with above-average growth rates) limited the increase in unemployment rates by 0.5 points each year from 2007 to 2012 relative to metro areas with slumping industries (those with below-average growth rates). Moreover, the level of unemployment was 0.3 percentage points lower in metro areas with growing industries over a one-year period, relative to metro areas concentrated in industries with below-average performance.
Housing
Aside from cyclical industry demand, the housing market has greatly affected the depth of recession and pace of recovery. Some parts of the country—namely California, Florida, and Nevada—were hit particularly hard by subprime lending and subsequent foreclosures. Foreclosures and rising unemploy-ment combined to dramatically weaken housing prices, and falling housing prices reduced consumer demand and local tax revenues.27
Metro areas experiencing larger-than average housing price declines from 2006 to 2012 saw unem-ployment rates increase by half a percentage point more than other metro areas for each year they had large price declines. Throughout the recession, but especially in 2008, unemployment rate levels were also significantly higher in metro areas with below average annual housing price growth—by 0.8 percentage points in 2008, and 0.4 percentage points from 2006 to 2012.
Education Gap
How do metropolitan education gaps rank against industry demand and housing price factors in determining metropolitan unemployment? To answer this question, this analysis employs a regression that calculates the individual effect of each factor on unemployment, while holding the other factors constant. To gauge the relative size of the effects of each factor, the analysis compares metro areas that score well (above average) on each indicator to those that score badly (below average).
The analysis separates short-term unemployment rate changes from the long-term unemployment rate.28 Figure 6 focuses on annual changes in unemployment, by comparing large metro areas that are above and below average on each measure. This can be interpreted as the effect on cyclical or short-term unemployment.
Overall, changes in industry demand and house prices account for the bulk of recent increases in metropolitan unemployment rates. One can see that the housing market effect peaked in 2008, when metro areas with below average housing market growth (in the preceding year) experienced a half percentage point increase in unemployment relative to metro areas with above average housing price growth. The industry demand and education effects peaked in 2007, adding nearly 0.7 percent-age points. Across 2006 to 2012, the housing effect explains roughly 34 percent of the increase in unemployment, while the industry demand effect explains roughly 40 percent, and the education gap accounts for 27 percent. In short, education gaps have been less important than housing and industry demand in explaining short-term unemployment rate changes in metro areas.
The education gap has a much stronger relationship with the level of unemployment (i.e., the unem-ployment rate), as opposed to yearly changes in the measure (Figure 7). Before, during, and after the recession, metro areas with an above-average education gap had unemployment rates that were an average of at least two percentage points higher than metro areas with below-average gaps. Here, the
Figure 6. Cyclical Unemployment: Estimated effect of industry demand, education matching, and housing markets on annual changes in metro area unemployment rates
by percentage point, 2007-2012
Source: Brookings analysis of Conference Board HWOL, BLS, Moody’s Economy.com, the Federal Housing Finance Agency and 2010 American Community Survey. Effect compares unemployment in metro areas that score above average on each metric to metro areas that score below average.
0.7 0.6 0.5 0.4 0.3 0.2 0.1 0 2006 2007 2008 2009 2010 2011 2012 Industry Growth Education Gap
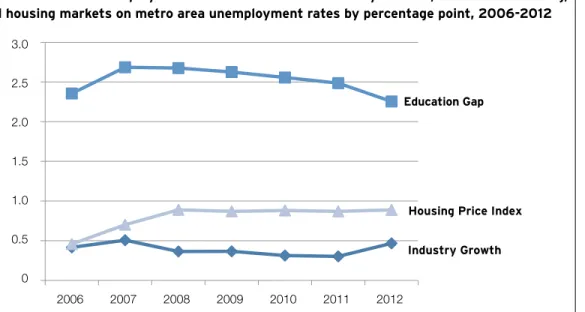
housing and industry demand effects are more muted, though still significant; they have also gained in importance over the last year as industrial recovery has helped lower unemployment. Over the entire period, the education gap accounts for 67 percent of the level of unemployment, while housing accounts for 22 percent and industry demand just 10 percent. In this way, the education gap exerts more of a long-run impact on metropolitan unemployment.
Each metro area can be ranked on the three main factors.29 As one can see in the figures showed above, the relative importance of each depends on whether one is looking at changes in the unemploy-ment rate (short-term performance since the recession started) or the level of unemployunemploy-ment (overall labor market strength).
On recent changes in unemployment, house-price dynamics clearly separate those metro areas at the top and bottom of the list. Table 5 shows the metro areas with the smallest and largest rises in unemployment as predicted by their education gap, house-price trend, and industry growth.30 The top 10 saw unemployment rise an average of 2.5 percentage points from its pre-recession minimum, compared to 6.4 percentage points in the bottom 10. Pittsburgh has the most resilient labor market characteristics of any large metropolitan area. While it scores in the top quintile on all three measures, its greatest strength is in housing prices, which rose 7.3 percent since 2006, even as prices decreased by 15 percent in the average large metro area. All of the metro areas ranked in the top 10 on resilience are in the top 20 on house price growth. Likewise, in the metro areas with the lowest predicted unem-ployment rates—exemplified by Central Valley California—prices have plummeted since 2006.
Turning to the predicted level of unemployment in May of 2012 (Table 6), the rankings change for most metro areas compared to those based on changes in unemployment. Now, the education gap has larger weight, and so Rochester moves into the top spot, because of its well-matched labor force and stable, if low priced, housing markets. Madison is third, despite being hobbled by jobs losses in state government. The major difference between high-ranking metro areas and low-ranking metro areas is the education gap, which is roughly 8 percentage points lower in high-ranking metro areas. This com-pares to a difference of just 5 percentage points in Table 5.
Inland California is home to the six of the ten metro areas with the weakest labor market fundamen-tals, including the four with the lowest scores. Joining them are metro areas in Nevada, Florida, and Texas that are also plagued by relatively low educational attainment rates and weak housing markets,
Figure 7. Structural Unemployment: Estimated effect of industry demand, education matching, and housing markets on metro area unemployment rates by percentage point, 2006-2012
Source: Brookings analysis of Conference Board HWOL, BLS, Moody’s Economy.com, the Federal Housing Finance Agency and 2010 American Community Survey. Effect compares unemployment in metro areas that score above average on each metric to metro areas that score below average.
3.0 2.5 2.0 1.5 1.0 0.5 0 2006 2007 2008 2009 2010 2011 2012 Industry Growth Education Gap
namely Las Vegas, Lakeland, El Paso, and McAllen. Theses metro all have wide education gaps, and with the exception of the Texas metros, their housing markets have suffered severely in recent years. For three of them—Bakersfield, Lakeland, and Las Vegas—the good news is that their main industries have bounced back somewhat during the recovery, but it has not been enough to overcome their other challenges and lower unemployment rates to single digits.
The predicted unemployment rates fit well overall but differ significantly from actual rates for cer-tain metro areas. For Rochester, Buffalo, and Raleigh, the predicted unemployment rates are consid-erably below their actual unemployment rates. There are many reasons why this might be the case, including long-term industrial decline in up-state New York of companies whose industrial peers are doing better in other locations. Another factor is related to state banking laws. North Carolina—along with Rhode Island, California, and Nevada—were among the first states to allow banking consolida-tions, a regulatory decision that resulted in more aggressive sub-prime lending during the most current housing bubble.31 For similar reasons, metro areas in Texas, which only very recently allowed
Table 5. Large metro areas with most recession resilient short-term labor markets based on education matching, housing market performance, and industry demand
Predicted Change in Predicted change
Average Housing Price Industry unemployment rate in unemployment education gap, Growth, Growth, since pre-recession rate since
2010-2012 2006-2012Q1 2010Q1-2012Q1 minimum pre-recession minimum
10 metro areas with most resilient labor markets based on predicted change in unemployment rate
Pittsburgh, PA 3.1% 7.3% 3.0% 2.3 1.6 Tulsa, OK 4.5% 6.1% 3.3% 1.6 1.6 Oklahoma City, OK 3.7% 5.8% 3.0% 0.7 1.8 Buffalo-Niagara Falls, NY 2.6% 9.1% 2.6% 3.6 1.9 Houston-Sugar Land-Baytown, TX 8.7% 9.1% 3.6% 2.6 1.9 Rochester, NY 1.6% 4.0% 2.6% 3.4 1.9 Wichita, KS 6.1% 5.4% 3.2% 2.9 2 Knoxville, TN 3.3% 1.2% 2.8% 2.6 2.1
Austin-Round Rock-San Marcos, TX 3.3% 12.7% 2.2% 2.1 2.2
Greenville-Mauldin-Easley, SC 6.1% 2.6% 3.1% 3 2.3
Average of strongest metros 4.3% 6.3% 2.9% 2.5 1.9
10 metro areas with least resilient labor markets based on predicted change in unemployment rate
Miami-Fort Lauderdale-Pompano Beach, FL 6.8% -44.6% 2.6% 5.1 5.1
Cape Coral-Fort Myers, FL 4.1% -52.2% 2.2% 5.8 5.4
Las Vegas-Paradise, NV 8.0% -60.0% 2.8% 7.6 5.8 Lakeland-Winter Haven, FL 11.4% -43.2% 2.6% 5.6 5.8 Sacramento--Arden-Arcade--Roseville, CA 6.4% -45.3% 1.7% 5.7 5.9 Riverside-San Bernardino-Ontario, CA 9.2% -48.3% 2.3% 6.9 6 Bakersfield-Delano, CA 13.9% -49.9% 2.6% 6.1 6.5 Stockton, CA 10.0% -58.6% 2.0% 7.1 6.9 Fresno, CA 11.1% -48.0% 1.6% 6.9 6.9 Modesto, CA 11.9% -59.7% 2.1% 7.6 7.1
Average of weakest metros 9.3% -51.0% 2.3% 6.4 6.1
Average of 100 largest metro areas 5.3% -15.1% 2.6% 3.5 3.5 Source: Brookings analysis of Conference Board HWOL, BLS, Moody’s Economy.com, the Federal Housing Finance Agency and 2010 American Community Survey. Metro areas are ranked according to the predicted change in unemployment from each metro area’s pre-recession minimum annual unemployment rate to the most current rate as of writing (May of 2012). The education gap measure displayed here uses 2010, 2011, and 2012 openings data but only 2010 educational attainment data.
intra-state branching and consolidates, have done better than expected. There are, of course, other factors also left out of this simple model. The metro areas of Rochester and Buffalo are also both heavily regulated by local governments that have kept affordable housing out of wealthy areas and thereby exacerbated racial and economic inequality.32 These policies weaken the quality of education for lower income workers.
Metro areas with higher education gaps have experienced lower rates of job creation
and job openings over the past few years.
As discussed in the introduction, some analysts have speculated that high unemployment rates during this recovery have been prolonged by a skill mismatch. The logic is as follows: If the skills (or educa-tion) of unemployed workers does not match what employers need, vacant jobs will remain unfilled even as the economy expands, or employers will invest in technology (e.g. computers or machines) to do the work or offshore it. The unemployment rate will remain high.
For this theory to hold, one would expect that the education gap would explain short-term changes in unemployment as well or better than industry demand and housing prices. As discussed above, this is not the case. Growth in industry demand and housing prices has brought down unemployment.
Table 6. The long-term strongest and weakest large metro areas based on education matching, housing market performance, and industry demand
Average Housing Price Predicted Industry Unemployment Predicted education gap, Growth, Growth, Rate, Unemployment Rate,
2010-2012 2006-2012Q1 2010Q1-2012Q1 May 2012 May 2012
10 metro areas with the strongest labor markets based on predicted unemployment rate
Rochester, NY 1.6% 4.0% 2.6% 8 5.5 Pittsburgh, PA 3.1% 7.3% 3.0% 6.6 5.5 Madison, WI -1.2% -4.3% 1.8% 4.9 5.6 Buffalo-Niagara Falls, NY 2.6% 9.1% 2.6% 8.5 5.7 Raleigh-Cary, NC 1.2% 0.4% 2.3% 7.7 5.8 Provo-Orem, UT 1.1% -11.0% 2.7% 5.7 5.9 Tulsa, OK 4.5% 6.1% 3.3% 5.3 5.9 Oklahoma City, OK 3.7% 5.8% 3.0% 4.5 5.9 Knoxville, TN 3.3% 1.2% 2.8% 6.3 6.1 Honolulu, HI 0.9% -4.0% 2.1% 5.6 6.1
Average of strongest metros 2.1% 1.5% 2.6% 6.3 5.8
10 metro areas with the strongest labor markets based on predicted unemployment rate
Sacramento--Arden-Arcade--Roseville, CA 6.4% -45.3% 1.7% 10.4 10.5 El Paso, TX 12.9% 3.5% 2.1% 9.3 10.5 Las Vegas-Paradise, NV 8.0% -60.0% 2.8% 11.8 10.7 McAllen-Edinburg-Mission, TX 15.0% 0.5% 2.5% 10.8 11.2 Riverside-San Bernardino-Ontario, CA 9.2% -48.3% 2.3% 11.8 11.2 Lakeland-Winter Haven, FL 11.4% -43.2% 2.6% 9.2 11.6 Stockton, CA 10.0% -58.6% 2.0% 14.5 12.2 Fresno, CA 11.1% -48.0% 1.6% 14.9 12.6 Bakersfield-Delano, CA 13.9% -49.9% 2.6% 13.6 12.8 Modesto, CA 11.9% -59.7% 2.1% 15.6 13
Average of weakest metros 11.0% -40.9% 2.2% 12.2 11.6
Average of 100 largest metro areas 5.3% -15.1% 2.6% 7.9 7.9 Source: Brookings analysis of Conference Board HWOL, BLS, Moody’s Economy.com, the Federal Housing Finance Agency and 2010 American Community Survey. Predicted unemployment is based on regression of actual unemployment rates on the variables in the first three columns. The education gap measure displayed here uses 2010, 2011, and 2012 openings data but only 2010 educational attainment data.
Additionally, one would expect that jobs have become more difficult to fill during the course of the recession, compared to before the recession, and that metropolitan areas that take longer to fill jobs would have higher unemployment rates. Both of these latter predictions are also not supported by the evidence.
To the first point, the number of monthly hires in the United States as a share of job openings announced in the previous month is just as high, on average, in the recovery period (July 2009 to May 2012)—at 1.40—as it was before the recession (February 2002 to December 2007)—at 1.33.33 Likewise, the correlation between U.S. quarterly job growth and quarterly changes in unemployment is no dif-ferent in this recovery than in previous recoveries.34 Moreover, in the 100 largest metropolitan areas, the percentage of jobs that have gone unfilled for one month or longer has not increased during the recession, as Figure 8 clearly shows. In fact, the share of jobs taking at least one month to fill was roughly the same in 1966, 31 percent.35 Overall, job openings are resulting in the same number of hires and net job creation now as they were before the recession.
To the second prediction, metropolitan areas take longer to fill vacant jobs do not have higher unemployment rates. In fact, more highly educated metro areas tend to have a larger share of jobs, often in science-related fields, that take a month or longer to fill. As Table 7 shows, the metro areas with the highest share of jobs going unfilled include many with relatively low unemployment rates like Dallas, Jackson, Mississippi, Milwaukee, Springfield, Massachusetts, and Washington D.C, whereas those that easily fill jobs include high-unemployment metro areas like Cape Coral, Florida and Las Vegas. The education gap is not correlated with the share of openings that go unfilled.
The evidence offered in the previous findings suggests that skill-mismatch is mostly a long-run problem, with a small cyclical effect. And yet, in explaining that short-term effect, there is another compelling link between education and regional economic success, which is entrepreneurship.36 In 2007, 48 percent of all business owners with paid employees had obtained a bachelor’s degree or higher, compared to just 28 percent of the U.S. population.37
With this in mind, an alternative theory for the success of well-educated metro areas is that human capital—measured by either educational attainment rates or the education gap—raises entrepreneur-ship and business competitiveness, yielding more openings.
Labor economists have noted that the growth rate of college educated Americans has declined, and other scholars have noted a long-term decline in job creation.38 Indeed, 1980 marks an important turning point in the U.S. labor market from an era of rapid growth in educational attainment and job
Figure 8. Share of Vacancies Taking at least One Month to Fill in 100 Largest Metro Areas, 2006-2012 0.45 0.40 0.35 0.30 0.25 0.20 0.10 0.05 0 2006 2007 2008 2009 2010 2011 2012
creation to an era with more modest growth of both educational attainment and job creation. This trend is documented in Figure 9 and cannot be attributed to changes in population growth.
The trend can be seen at the metro scale as well. Large metro areas with above average increases in their bachelor’s degree attainment rates had a larger increase in the number of jobs per capita from 1980 to 2010.39 Metro areas like Boston, Washington DC, Indianapolis, and Seattle experienced a large increase in educational attainment and a large increase in the number of jobs per capita over the thirty year period. Metro areas like Las Vegas, Houston, Wichita, and much of inner California experi-enced the opposite trend.
Job openings are not created out of nothing. Entrepreneurs are often highly educated, and they consider the quality of their potential labor force before deciding to open a business or expand in a given geographic area. Likewise, a business is more likely to survive during a recession if it has a labor force that matches its skill requirements.
Metro areas with a lower education gap appear more entrepreneurial, as evidenced by their higher rate of job openings. In 2011, monthly job openings as a share of existing employment was 0.4 percent-age points higher in metro areas with below averpercent-age education gaps (2.4), compared to those with above average education gaps (2.0). This translates into roughly 41,000 more openings per year for metro areas with stronger human capital.40
Metro areas with a more educated workforce, relative to job openings, score better on measures of job creation. Table 8 lists the large metro areas that score highest and lowest on the education gap measure, using openings. Compared to metro areas that score badly on the education gap, those with low scores exhibit a new job openings rate that is roughly 0.7 percentage points higher and a lower
Table 7. Metropolitan areas with the highest and lowest share of job openings going unfilled after one month
Share of openings unfilled Change in unfilled rate, Unemployment rate, after one month, 2012 2007-2012 May 2012
Metro areas with high unfilled rates
Bridgeport-Stamford-Norwalk, CT 42% -3% 7.5
Augusta-Richmond County, GA-SC 40% -2% 9.0
Milwaukee-Waukesha-West Allis, WI 40% 0% 7.4
San Jose-Sunnyvale-Santa Clara, CA 39% 0% 8.4
Chicago-Joliet-Naperville, IL-IN-WI 38% 0% 8.5 Washington-Arlington-Alexandria, DC-VA-MD-WV 38% -1% 5.3 Springfield, MA 38% 0% 6.8 Scranton--Wilkes-Barre, PA 38% 1% 8.7 Jackson, MS 38% -6% 7.1 Dallas-Fort Worth-Arlington, TX 37% 0% 6.8
Average for metro areas with high unfilled rate 39% -1% 7.6
Metro areas with low unfilled rates
San Antonio-New Braunfels, TX 29% -9% 6.6
Charleston-North Charleston-Summerville, SC 28% -15% 7.9 Akron, OH 28% -11% 6.6 Tucson, AZ 27% -6% 7.2 Orlando-Kissimmee-Sanford, FL 27% -11% 8.3 Raleigh-Cary, NC 27% -5% 7.7 Las Vegas-Paradise, NV 27% -4% 11.8 North Port-Bradenton-Sarasota, FL 26% -15% 8.4 Honolulu, HI 20% -12% 5.6
Cape Coral-Fort Myers, FL 18% -26% 8.7
Average for metro areas with low unfilled rate 26% -11% 7.9 Source: Brookings analysis of Conference Board HWOL data and BLS. 2012 data covers only January and February and was seasonally adjusted by the author.
Table 8. Job Openings Rate in 2011 and Job Growth Rate from First Quarter 2008 to First Quarter 2012 in Large Metropolitan Areas with the Smallest and Largest Education Gaps
New openings per existing job, 2011 Job Growth 2008q1-2012q1
Metro areas with smallest education gap
Madison, WI 2.6% -2.1% Honolulu, HI 2.5% -3.4% Raleigh-Cary, NC 2.2% -2.0% Provo-Orem, UT 3.1% 0.6% Rochester, NY 3.8% -1.3% Washington-Arlington-Alexandria, DC-VA-MD-WV 1.9% 0.1% Charleston-North Charleston-Summerville, SC 3.1% -1.7% Colorado Springs, CO 1.8% -1.1%
Minneapolis-St. Paul-Bloomington, MN-WI 2.8% -0.8%
Poughkeepsie-Newburgh-Middletown, NY 2.7% -3.1%
Average for low gap metros 2.6% -1.5%
Metro areas with largest education gap
Augusta-Richmond County, GA-SC 1.6% 2.5%
Houston-Sugar Land-Baytown, TX 1.8% -3.3% Riverside-San Bernardino-Ontario, CA 1.6% -8.2% Stockton, CA 2.4% -6.6% Fresno, CA 2.1% -9.6% Lakeland-Winter Haven, FL 2.1% -6.3% Modesto, CA 2.8% -8.6% El Paso, TX 1.6% 2.6% Bakersfield-Delano, CA 2.1% -0.6% McAllen-Edinburg-Mission, TX 1.1% 5.5%
Average for high gap metros 1.9% -3.3%
Average for all large metro areas 2.3% -3.7%
Brookings analysis of data from the Conference Board HWOL, BLS, and Moody’s Economy.com.
Figure 9. Long-run Growth in U.S. Higher Education, Population, and Employment in Two Periods, 1950 to 1980 and 1980 to 2010.
Source: Brookings analysis of U.S. Census Current Population Survey, Historical Time Series Tables and BLS Current Popula-tion Survey. EducaPopula-tion data ends in 2011.
0.05 0.01 0.02 0.03 0.02 0.01 0 0.01 0.02 0.03 0.04 0.05 0.06
Bachelor's degree holders Population 25 and older Jobs
A
v
erage annual gr
owth rate
rate of decline in total employment (of 1.8 percentage points) since the start of the recession. Even controlling for predicted industry growth, there is a strong negative correlation between actual job growth and the education gap.
These results suggest that the education gap limits the number of job openings. One implication is that metropolitan areas with low levels of education relative to what their industries need, face a cycli-cal and structural problem: They have too few job openings in the short-term, and over-the long-term, a large number of job seekers are unqualified to fill the jobs that are available.
Discussion
T
he findings from this analysis emphasize the increasing importance of education for vacant jobs—or at least those advertised online—and shed additional light on the causes of recov-ery, or lack thereof, in metropolitan areas and the nation. Each metro area’s problems are a unique combination of cyclical and long-term strengths and weaknesses.In the short term, any mismatch between the supply of and demand for education is not a sufficient argument against further stimulus and expansionary policies. While the demand for highly skilled workers continues to outstrip the supply, this does not mean that there are an abundance of job open-ings that are going unfilled. The share of openopen-ings that are going unfilled is 33 percent in the average large metro, which is almost exactly the same ratio as economists found in the 1960s.41 Openings for higher skilled positions do seem to be harder to fill, but they eventually get filled without apparent harm to regional economies, since metro areas with a high share of jobs going unfilled do not have higher unemployment rates.
Industry trends and house prices still have large and important effects on unemployment rates in metropolitan labor markets. If industry demand and housing can be shored up further, regions will continue to recover, but only up to a point. Potentially, monetary stimulus (increasing the money supply), fiscal stimulus (a combination of increased spending and lower taxes), or other measures to promote demand (e.g. trade agreements) could help, along with actions to stabilize the housing market (e.g., mortgage refinancing).
Under-education and skill mismatch may, however, hurt the economy in the short run by suppress-ing job creation and entrepreneurship. While the decreassuppress-ing growth rate of educated workers is a multi-decade problem for the labor market, it can weaken recovery during cyclical downturns by stifling a rebound in job creation. Consequently, policies to boost entrepreneurship could be immedi-ately beneficial.
As to longer-term issues, the recession did not fundamentally change the structure of the economy in terms of the supply and demand for skills or education. Before the recession, inadequate education was a major problem. It continues to be. There are simply fewer jobs per worker for those with little education.
The severity of the long-run education problem varies considerably across metropolitan economies. By providing local services (e.g. administration, restaurants, daycare, health care) and other tasks that do not require formal education, less educated workers complement the activities of highly edu-cated workers, and so the less eduedu-cated have an easier time finding work in highly eduedu-cated regional labor markets (which is one reason to keep housing affordable in highly educated metros). Thus, the shortage of highly educated workers in a metro area means that there are not enough openings, too many layoffs, and too many less educated, unemployed workers whose knowledge and skills are not in high demand.
From a regional perspective, one of the most effective ways to enjoy the benefits of high educa-tional attainment rates is to provide education. While college graduates are highly mobile, they also tend to stay in the same state as their university. Indeed, 70 percent of college graduates live in the same state at their college five years after graduation and 61 percent 10 years after.42 The share is only slightly less for tech entrepreneurs; 45 percent of the founders of large companies created their business in the same state where they attended school.43 This is one of the reasons why many of the metro areas with the highest college attainment rates also have large research universities, like Austin, Boulder, San Francisco, Boston, and Madison.