Happy Analysts
Ole-Kristian Hope Rotman School of Management
University of Toronto
[email protected] Congcong Li
Singapore Management University
An-Ping Lin
Singapore Management University
MaryJane Rabier
Washington University in Saint Louis
September 18, 2018
ABSTRACT
This paper is the first to investigate the role of work-life balance in financial analysts’ performance and career advancement. Using a large sample of Glassdoor reviews by financial analysts, we find a significant non-linear relation between work-life balance satisfaction and analyst performance and analyst career advancement. Specifically, when work-life balance satisfaction is relatively low, an increase in work-life balance is associated with better analyst performance and career advancement; however, when perceived work-life balance is already high, a further increase in work-life balance is associated with worse analyst performance and career advancement.
We appreciate helpful comments from Qiang Cheng, Artur Hugon, Yihan Liu, Mike Marin, Shibin Tang, Holly Yang, and seminar participants at Singapore Management University and Rotman School of Management (PhD seminar). We thank McGill University, Singapore Management University, University of Toronto, and Washington University in Saint Louis for their financial support. All errors are our own.
Happy Analysts
Abstract
This paper is the first to investigate the role of work-life balance in financial analysts’ performance and career advancement. Using a large sample of Glassdoor reviews by financial analysts, we find a significant non-linear relation between work-life balance satisfaction and analyst performance and analyst career advancement. Specifically, when work-life balance satisfaction is relatively low, an increase in work-life balance is associated with better analyst performance and career advancement; however, when perceived work-life balance is already high, a further increase in work-life balance is associated with worse analyst performance and career advancement.
JEL Classification: D83, G11, G24, J24, J44, M41
Keywords: Analysts, Work-Life Balance, Job Satisfaction, Performance, Promotion, Labor Market, Social Media, Glassdoor, LinkedIn, All-Star
Happy Analysts 1. Introduction
Sell-side financial analysts are widely considered to hold one of the most challenging professions to achieve work-life balance due to long working hours and a competitive work environment. Although financial analysts earn high salaries and have promising career growth prospects, they also bear the costs of high stress levels and limited time for self and family. In recent years, several investment banks have started programs to promote work-life balance among their employees. For example, Morgan Stanley offers month-long paid sabbaticals to junior bankers. Goldman Sachs reduced working hours for their junior employees after the death of the 21-year-old Bank of America Merrill Lynch intern Moritz Erhardt, who passed away after allegedly working nonstop for 72 hours. Although work-life balance (henceforth, WLB) is a universal and important issue, the impact of WLB on analysts’ careers has not been explored before. The recent emergence of social media such as Glassdoor makes such an inquiry possible. This paper investigates the role of WLB of financial analysts in their performance and career advancement.
WLB has been defined as satisfaction at both work and non-work domains with minimum conflicts between these two roles (e.g., Braun and Peus 2016). In addition to work obligations, employees need to deal with the demands of personal and family life. Ex-ante, the role of WLB in analyst performance is unclear. On one hand, WLB can improve job performance through two channels. The first is through lower levels of stress. Employees who can deal with the demands from their personal and family life are less likely to be stressed, which in turn may facilitate job performance such as creative problem solving. The second is through higher levels of job satisfaction. Employees who are satisfied with their employers tend to have a stronger commitment to the employer, which may also improve job performance. On the other hand, WLB may not affect or even hurt job performance. Prior studies suggest
that the relation between job satisfaction and job performance is weak in professions with high performance standards because the pressure for production provides motivation to perform even when the employees are not satisfied with their employers (Judge, Thoresen, Bono, and Patton 2001). Given that financial analysts are among the highest-pressure professionals and are burdened with a large amount of responsibility, WLB may therefore not have an incremental effect on their performance.1 Finally, practices that promote WLB may also hurt analyst performance by encouraging lateness and absenteeism to the workplace, which may result in lower levels of analyst involvement and effort.
We hypothesize that an optimal level of WLB for analysts exists and thus the effect of WLB on analyst performance depends on the current level of WLB relative to the optimal level. While low WLB satisfaction (e.g., extremely long hours in the office) induces stress and inefficiency, high WLB may encourage analysts to allocate too much of their resources such as time, energy, and cognitive effort to personal or family life. Given that these resources are not infinite, the more resources an analyst allocates to her personal life, the fewer resources are left for her work. Therefore, we expect that when the current level of WLB is relatively low, betterment of WLB improves analyst performance through higher efficiency and better mood. In contrast, when the current level of WLB is already high, we expect that an increase in WLB decreases analyst performance because the analyst may shift her focus to personal and family life.
To conduct our analyses, we first obtain the names of all U.S. brokers in the I/B/E/S database between 2008 and 2016. We manually collect all Glassdoor employee review webpages of each broker, identify reviews submitted by analyst employees, and extract data on individual reviews. Glassdoor is the largest online resource for prospective job candidates
1 In other words, these are individuals who self-select into a career with less WLB than in many other
professions, likely because they find satisfaction in the high compensation, excitement of the work, prestige, and/or future career opportunities.
for employee reviews and potential compensation ranges. Glassdoor allows users to anonymously rate the WLB of their firms on a 1 to 5 scale. For each broker and year, we aggregate individual analysts’ ratings to measure WLB satisfaction.
Using a sample of 11,602 Glassdoor reviews by analysts and a sample of I/B/E/S analysts who issued at least one earnings forecast, we first examine whether analysts’ earnings forecast accuracy varies with perceived WLB about their employers. We document a non-linear relation. On average, analysts’ forecast accuracy reaches the highest level when the WLB satisfaction of their employer is around 2.69 out of 5. Positive or negative deviations from this level result in lower forecast accuracy. We also find a non-linear relation between WLB and analysts’ forecast timeliness. For analysts working for brokers with WLB below (above) the inflection point, their forecast timeliness increases (decreases) with WLB satisfaction. Overall, these results suggest that analysts’ performance varies with WLB.
We next investigate the role of WLB in analysts’ career advancement, controlling for analysts’ performance. We focus on two primary career outcomes: whether the analyst is voted as an All-Star by institutional investors and whether the analyst moves to a larger brokerage house (e.g., Hong and Kubik 2003). The results again suggest a non-linear relation. In particular, for analysts working at brokerage houses with WLB below (above) the inflection point, their likelihood of being voted as an All-Star Analyst and being promoted to larger brokerage houses increase (decrease) with WLB. Overall, these results suggest that the WLB shaped by employers has a direct impact on analysts’ career outcomes.
We conduct several additional analyses. In our main analyses, we aggregate individual analysts’ ratings at the broker-year level. We extend our analyses to the broker-office-year level. To obtain such granular data, we manually collect the LinkedIn profiles of the financial analysts in our sample and extract data on their current and historical work locations. We then aggregate a broker’s WLB ratings in a given year and city to create a broker-office-year measure. In this
way, we are able to test the cross-sectional difference of WLB within a broker.2 The broker-office-level results are similar to the results at the broker level. We consistently find a non-linear relation between the broker-office-level WLB and analysts’ performance and career advancement. For offices with WLB lower (higher) than the inflection point, increases in WLB satisfaction result in more (less) accurate and timely forecasts, and higher (lower) likelihood of being voted as All-Star Analysts and being promoted to more resourceful brokers.3
Our regressions include controls for a host of widely documented analyst, brokerage, and firm characteristics. Our inferences are robust after excluding brokers with extremely high or low ratings or excluding brokers with few Glassdoor reviews. Our conclusions are also robust to using an alternative proxy for analysts’ performance (stock-recommendation profitability). We also conduct tests that employ an instrumental-variables approach to better identify causality. Taken together, our results suggest that achieving optimal WLB is important for both analysts’ performance and their career advancement.
We make several contributions to research and practice. First, we provide the first large-sample evidence that reaching the optimal WLB is important, not only for individual financial analysts but also for brokerage firms. Second, we contribute to the debate on WLB in the financial industry. Our findings suggest that shifting too much focus from work to life can hurt analysts’ performance and their career advancement. Third, our findings complement the literature on the interaction of job satisfaction and job performance. Prior studies find that job satisfaction is positively correlated with stock returns (Edmans 2011; Green, Huang, Wen, and Zhou 2018) and that firms with high levels of job satisfaction have low financial reporting risks and are less likely to be subjected to SEC fraud enforcement actions and class action lawsuits (Ji, Rozenbaum, and Welch 2017). Our results suggest that job satisfaction may not always
2 In other words, these analyses fully control for potential brokerage-house effects.
3 In additional analyses we also examine the potential moderating effects of analyst gender, seniority, and
education. We find that gender and seniority matter but that education (i.e., having an MBA degree) does not (see Section 5.2 for details).
benefit job performance. A high-level job satisfaction may imply lower effort and thus hurt employees’ performance and careers.4
2. Literature Review and Hypotheses 2.1 Prior Literature on Work-Life Balance
In the management literature, WLB is an important component of job satisfaction. WLB is the perceived satisfaction between the arrangement of different roles in life (Braun and Peus 2016). WLB is not limited to family life, such as parenting and partnering, but also includes personal activities including sports, travel, and leisure. In addition to work obligations, an employee has to deal with the demands of personal and family life and seeks to achieve satisfying experiences in all life domains. To promote WLB, firms adopt various types of programs such as on-site child care, elder-care services, flextime, job sharing, paid leaves, compressed work weeks, shorter work weeks, and work-from-home programs given recent developments in telecommuting and social media. Overall, these WLB programs fall into three main categories: dependent care, family-stress programs, and flexible work arrangements (see Arthur 2003).
Prior research documents different consequences of WLB. On one hand, WLB can improve an employee’s productivity. WLB is an important way to reduce the potential conflicts between work and personal life. Such conflicts can yield job stress, such as nervousness and anxiety associated with the job, which can affect an employee’s emotional and physical health (Shamir and Salomon 1985; Netemeyer, Maxham, and Pullig. 2005; Jennings and McDougald 2007; Trefalt 2013). In this regard, WLB programs provide relief for non-work concerns.
4 Our study also adds to the growing literature on information aggregation and the wisdom of the crowd.
Research has examined the role of information aggregation from the online investing community in investment strategies (Chen, De, Hu, and Hwang 2014), and the role of online customer reviews in driving stock returns (Huang 2018). Our findings suggest that the aggregated opinions of individual financial analysts on their employers are associated with individual analysts’ performance.
Employees may feel that they are receiving special treatment and in return contribute more effort to their employers. Konrad and Mangel (2000) and Bloom, Kretschmer, and Van Reenen (2011) find that work-life programs improve a firm’s productivity when a higher percentage of professional employees are employed. Arthur (2003) documents a positive stock-market reaction to firms announcing WLB programs in the Wall Street Journal. He finds that stock returns increase 0.36% on the day of a work-family announcement. Netemeyer et al. (2005) show that WLB programs improve the performance of customer-service employees by reducing their job stress. In addition, prior studies find that long hours do not lead to greater productivity and may actually hurt work efficiency (Major, Klein, and Ehrhart 2002). For example, Lazear’s (1981) model suggests that an efficient employment contract that maximizes productivity should have restrictions on the number of hours of work.
However, WLB programs can also hurt an employee’s productivity. According to the competing-demands theory, both working and personal life have demands on resources such as time, energy, and cognitive effort (Konrad and Mangel 2000). All these resources are not infinite and can drain at some point. The more resources an employee allocates to personal life, the fewer resources are left for work. For example, Blau (1985) suggests that WLB programs can reduce work effort, encourage lateness, and even cause absenteeism. Using samples of New Zealand firms, Guthrie (2001) and Rich, Lepine, and Crawford (2010) find that work involvement has a positive association with firm productivity. To the extent that WLB programs reduce the level of work involvement, these programs may hurt employees’ performance (Perry-Smith and Blum 2000). Moreover, corporate management may fear that their WLB programs provide flexibility, which can result in less stable employment patterns and lower organizational commitment from employees. Some prior studies suggest that the shift to more flexible job functions (e.g., working-at-home) can reduce employees’ social
connections and dissatisfy the social needs of employees and thus hurt their performance (Shamir and Salomon 1985).
In recent years, researchers have started to investigate the role of job satisfaction, including WLB, in capital-market settings. For example, Edmans (2011) and Green et al. (2018) find a positive association between employee satisfaction and stock returns. Ji et al. (2017) document that firms with low levels of job satisfaction are more likely to be subjected to SEC fraud enforcement actions and securities class action lawsuits. Khavis and Krishnan (2018) show that better WLB is associated with higher audit quality.5
2.2 Work-Life Balance for Financial Analysts
The investment banking industry, including sell-side equity research, is well-known for its long working hours. It is common for equity-research analysts to work 70 to 110 hours each week during the earnings season. Importantly, these hours refer to their time spent in the office regardless of whether or not they are doing real work (i.e., “face time” is considered important in this industry). There are three reasons for financial analysts to stay long hours in the office. First, analysts sell their time and attention to clients. When a client pays the brokerage firm large fees to advise on a deal, or when an institutional investor calls about the prospects of a firm the brokerage firm follows, the analysts are expected to do whatever the client wants at any time of the day. Analysts also need to spend time marketing themselves and their covered firms to their clients. Second, in the middle of their service, random events, requests, and problems arise. Other industries with unpredictable work demands handle these issues by hiring teams working in shifts, but this approach does not work as well in the banking industry. Third,
5 Khavis and Krishnan (2018) use a sample of Glassdoor reviews by audit employees to construct WLB
ratings for audit firms. They examine the linear association between accounting-firm-level WLB and audit quality, as measured by clients’ propensity of financial restatements and the likelihood of receiving a going-concern opinion, and they find a positive association between WLB and audit quality. See also Buchheit, Dalton, Harp, and Hollingsworth (2016).
working long hours is deeply embedded into the culture of financial service firms. Given this long-hour practice, it is challenging for analysts to rest enough and/or spend time on their own personal interests or family.
After the financial crisis, investment banks had to cut costs and had difficulty relying on large bonuses to keep their junior employees. Instead, the banks needed to find other ways, such as improving WLB, to retain their financial analysts. In recognition of these issues, in recent years, brokerage firms have started various programs to promote WLB among their employees. For example, UBS permits investment bankers to take at least two hours of personal time each week. JPMorgan Chase asks their employees to take weekends off unless they are working on a major deal. Morgan Stanley offers month-long paid sabbaticals to junior bankers. Goldman Sachs has reduced working hours for their junior employees after a Bank of America Merrill Lynch intern died after allegedly working 72 hours without sleep.
2.3 Hypotheses
2.3.1 Work-Life Balance and Analysts’ Performance
The effect of WLB satisfaction on an analyst’s performance is unclear. WLB can improve analysts’ job performance through two channels. The first is through lower levels of stress. Analysts who can balance their multiple roles in personal and family life are less likely to be stressed and in a bad mood at work, which in turn can facilitate job performance such as creative problem solving (Organ 1977; Petty, McGee, and Cavender 1984; Ostroff 1992; Fisher 2003). The second is through higher levels of job satisfaction. Analysts who are satisfied with WLB may have a stronger commitment to their employer, which in turn improves job
performance (Futrell and Parasuraman 1984; Banker, Konstans, and Mashruwala 2000; Judge et al. 2001; Harter, Frank, and Hayes 2002).
It is also possible that WLB satisfaction may not improve or even hurt an analyst’s job performance. Some prior research suggests that the relation between job satisfaction and job performance is weak in professions with high performance standards because the pressure for production provides motivation to perform even when the employees are not satisfied with their employers (Brayfield and Crockett 1955; Judge et al. 2001; Christen, Iyer, and Soberman 2006). Given that financial analysts are among the highest-pressure professionals and are burdened with a large amount of responsibility, WLB may not have an incremental effect on their performance. Furthermore, WLB might hurt job performance because analysts have limited resources including time, energy, and effort (Konrad and Mangel 2000). When they allocate more resources to “life,” they have to allocate fewer resources to work. In this regard, at some point further WLB satisfaction may decrease an analyst’s work involvement and thus hurt their performance.
Prior studies suggest that an optimal level of work hours might exist (Lazear 1981; Major et al. 2002). Based on the above discussion, we hypothesize that the effect of WLB on an analyst’s performance depends on the current level of WLB relative to the optimal level. We expect that when WLB satisfaction is relatively low, an increase in WLB satisfaction can improve an analyst’s efficiency and mood and thus lead to better performance. In contrast, when the WLB satisfaction is already high, we expect that a further increase in WLB causes an analyst to shift too much focus to personal and family life, thus leading to worse performance. Summarizing the preceding discussion, our first hypothesis is (stated in the alternative form):
H1: Additional work-life balance improves analysts’ performance when work-life balance is low, but decreases analysts’ performance when work-life balance is high.
2.3.2 Work-Life Balance and Analysts’ Career Advancement
WLB satisfaction has the potential to also influence the career outcomes of financial analysts. Analysts are known to frequently interact with their clients and are expected to meet customer requests and demands. In a recent survey by Brown, Call, Clement, and Sharp (2015), consistent with Groysberg, Healy, and Maber (2011) and Yin and Zhang (2014), 83% of financial analysts indicate that broker or client votes of approval are important for analyst career opportunities. Analysts’ interactions with clients have a high degree of discretion and thus provide opportunities for attitudes and motives to affect their behavior (Judge et al. 2001). Therefore, analysts with better WLB can potentially pass their good mood onto their clients and build better client relationships. Similarly, analysts with better WLB may also build closer relationships with other connections who can in turn provide financial analysts with information about job opportunities and help reduce information asymmetry between analysts and potential employers (Li, Lin, and Lu 2018). Taken together, analysts with better WLB satisfaction are likely to communicate better with clients and other connections, and these happier clients and connections are more likely to help them win All-Star awards or get promoted to larger firms (Cook 2005). However, the more analysts allocate their time, energy, and effort to their personal life, the fewer resources are left for them to maintain their relationships with clients and connections. For example, Shamir and Salomon (1985) indicate that the shift to more flexible job functions (e.g., working-at-home) can reduce the time to maintain employees’ social connections.
Overall, our prediction is that the effect of WLB on an analyst’s career advancement depends on the current level of WLB satisfaction relative to the optimal level. We expect that
when the level of WLB satisfaction is relatively low, increases in WLB satisfaction enhance the likelihood of financial analysts to be voted as All-Stars or to be promoted to a larger brokerage firm. In contrast, when the level of WLB satisfaction is already high, we expect that further WLB satisfaction decreases the likelihood of financial analysts to be voted as All-Stars or obtain a position with a larger brokerage firm. To summarize, our second hypothesis is as follows (stated in the alternative form):
H2: Additional work-life balance helps analysts’ career advancement when work-life balance is low, but hurts analysts’ career advancement when work-life balance is high.
3. Sample Selection and Variable Measurement 3.1 Sample-Selection Procedures
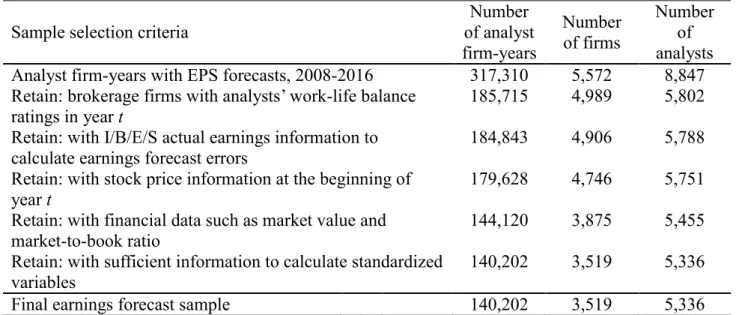
Table 1 summarizes the sample-selection procedures. We obtain the names of all of the U.S. brokers in the I/B/E/S database between 2008 and 2016. We manually collect 11,602 Glassdoor employee review webpages submitted by analysts of these brokers and extract data from individual reviews.6 We then merge these Glassdoor reviews with the I/B/E/S dataset and further restrict the sample to meet the following criteria: (1) with I/B/E/S information to calculate earnings forecast errors; (2) with financial data such as market value and market-to-book ratio; (3) with sufficient information to calculate control variables. These procedures result in an initial sample of 140,202 analyst-firm-year observations consisting of 5,336 analysts and 3,519 firms for the tests of analyst performance. 7
6 To identify the relevant Glassdoor employee reviews, we search for the following keywords in an
employee’s job title: analyst, associate, capital market, derivative, equity, fixed income, quantitative, research, securities, and valuation. Therefore, analysts here broadly refer to employees in a brokerage firm’s research department.
7 It is unlikely that all of the I/B/E/S analysts in our sample submit a review to Glassdoor. Some of these
Glassdoor reviews may be submitted by analysts who are not in the I/B/E/S database or by other members in an analyst team.
3.2 Main Variables
3.2.1 Work-Life Balance Ratings
Glassdoor is the largest online resource for prospective job candidates for employee reviews and compensation information. Glassdoor allows users to anonymously rate various aspects of their firms on a 1 to 5 scale, for instance, overall rating, company benefits, WLB, and senior management.8 We aggregate all ratings for each broker in a given year to create a
broker-year measure.
Table 2 presents the summary statistics of Glassdoor ratings for the broker-year combinations in our sample. During our sample period, there are 551 broker-years with analyst employee ratings. Comparing the ratings by analyst employees with those by non-analyst employees, we find that analyst employees have lower ratings for WLB but higher ratings for senior management, culture and values, career opportunities, and outlook.9 Untabulated analyses show that analysts tend to provide more comprehensive reviews that cover both the good and the bad about the company, suggesting that their ratings are based on more careful evaluations. In addition, analysts’ ratings for a given broker seem to be quite stable over time. Our WLB measure is the average WLB rating submitted by analyst employees for a given brokerage firm in year t.10,11 We focus on WLB satisfaction instead of other aspects in
8 These employee reviews are anonymous; therefore, they cannot match to individual analysts.
9 We collect an additional 55,012 non-analyst employee reviews for this analysis. The comparison is based
on 464 broker-years with both analyst and non-analyst employee ratings.
10 In an untabulated analysis, we compare the ratings by current analyst employees with those by former
analyst employees. We find that the ratings by the two groups are similar in all aspects. Therefore, to increase the precision of the WLB measure, we use both current and former analyst employee ratings to measure WLB at the broker level.
11 Although we are unable to match individual analysts’ WLB ratings to their performance and career
outcomes, given that individual analysts’ WLB is affected by their employers, it is important to study the effect of broker-level WLB before going further into analyst-level WLB. The use of aggregated ratings is both consistent with prior literature and appropriate because analysts within the same firm are sufficiently homogenous so that the aggregation process can remove random individual differences and result in a more accurate broker-level measure (Hofstede, Neuijen, Ohayv, and Sanders 1990; Ostroff 1992, 1993). In Section 5.1 we examine performance and career outcomes at the broker-office level.
job satisfaction of financial analysts for three reasons. First, job satisfaction is a broad definition that includes compensation, benefits, job growth, WLB, and culture. Focusing on one aspect, such as WLB, allows us to isolate the effects from other aspects of job satisfaction (see Section 5.5). Second, WLB is a universal and important issue in the financial industry. Unlike other professions that may more easily accommodate a home-based work style (e.g., some IT engineers who can work with a computer no matter where they are), working long and potentially uncertain hours in the office is the culture in the financial services industry, and it is important to understand how WLB may affect analyst performance. Third, the implications of WLB in the financial services industry is unclear, because there are tradeoffs in implementing WLB programs. As such, our study has implications for both academia and practice.
3.2.2 Analyst Performance Measures
We construct two primary proxies for analyst performance: earnings forecast accuracy and earnings forecast timeliness. Earnings forecast accuracy is measured by Forecast Error, defined as the absolute value of the analyst’s initial earnings forecast for firm j minus firm j’s
actual EPS in year t scaled by the stock price at the beginning of the year. Following Clement and Tse (2003), Forecast Error is standardized to range from 0 to 1 to control for firm-year effects. Specifically, the standardized relative Forecast Error for analyst i following firm j in year t is calculated as [Forecast Errori,j,t – min(Forecast Errorj,t)]/[max(Forecast Errorj,t) –
min(Forecast Errorj,t)], where max(Forecast Errorj,t) and min(Forecast Errorj,t) denote, respectively, the largest and smallest earnings forecast errors of all of the analysts following firm j in year t. By construction, a higher value of relative Forecast Error indicates that the earnings forecast is less accurate.
Earnings forecast timeliness is measured by Forecast Timeliness, defined as the natural logarithm of the number of days between the analyst’s initial earnings forecast for firm j and the announcement date of firm j’s actual EPS in year t. Forecast Timeliness is also standardized to range from 0 to 1 for a given firm and year. By construction, a higher value of relative
Forecast Timeliness indicates that the earnings forecast is issued earlier in a year and therefore is timelier. Prior studies find that timelier earnings forecasts are associated with larger market reactions (e.g., Shroff, Venkataraman, and Xin 2014).
3.2.3 Analyst Career Outcome Measures
To examine the role of WLB in analysts’ career advancement, we rely on Institutional Investor’s All-Star Analyst award status and a promotion measure constructed based on the
brokerage firm size. Each year, Institutional Investor magazine asks institutional investors to vote for the top sell-side equity analysts. We create an indicator variable (AA Award) that is set to one if the analyst is ranked in the top three or as a runner-up in her industry by Institutional Investor in year t and zero otherwise. For analyst promotion, we follow Hong and Kubik (2003) and create an indicator variable (Promotion) that is set to one if the analyst moves to a top-decile-size brokerage firm in year t and zero otherwise.12
3.2.4 Control Variables
Following the analyst literature (e.g., Clement 1999; Jacob, Lys, and Neale 1999; Lim 2001; Clement and Tse 2003), in our tests of analyst performance, we control for earnings forecast frequency (Forecast Frequency), brokerage firm size (Broker Size), number of firms followed (Number of Firms), number of industries followed (Number of Industries), and firm
12 We acknowledge that this measure does not consider within-brokerage firm advancements. However, it is
a common proxy for promotion in the analyst literature (e.g., Leone and Wu 2007; Kumar 2010; Hilary and Hsu 2013; Li, Lin, and Lu 2018). In Section 5.7 we consider additional career outcomes.
experience (Firm Experience), all of which are standardized to range from 0 to 1. In our tests of career advancement, we additionally control for average firm size (Size), average market-to-book ratio (MTB), and average market beta (Beta) of the firms in the analyst’s research
portfolio. We also control for forecast characteristics such as average relative forecast accuracy (Forecast Accuracy), average relative forecast boldness (Forecast Boldness), and average forecast optimism (Forecast Optimism). The Appendix contains a complete list of variable definitions.
3.3 Descriptive Statistics
Panel A of Table 3 presents descriptive statistics for the variables used in the analyst performance tests. In line with prior findings, the median analyst issues four earnings forecasts for a firm, follows seventeen firms within three two-digit SIC industries, and has four years of client-firm-specific experience.
Panel B of Table 3 presents descriptive statistics for the variables used in the analyst career-outcome tests. In this sample, 11.9% of the analysts are awarded All-Stars and 1.9% of the analysts move to a top-decile-size brokerage firm. We winsorize the continuous variables at the top and bottom 1%.
4. Research Design and Empirical Results
4.1 Work-Life Balance and Earnings Forecast Accuracy
H1 predicts that WLB satisfaction will have a non-linear relation with analyst performance. To test this hypothesis, we first examine the effect of WLB satisfaction on analysts’ earnings forecast errors, controlling for other determinants including brokerage firm size, number of firms followed, number of industries followed, firm experience, forecast frequency, and forecast timeliness. As mentioned in Section 3, we rely on standardized
earnings forecast errors to control for firm-year effects.13 Specifically, we estimate the following quadratic model (e.g., McConnell and Servaes 1990; Himmelberg et al. 1999; Collin-Dufresne et al. 2001; Wyatt 2005; Hillary and Huang 2018):
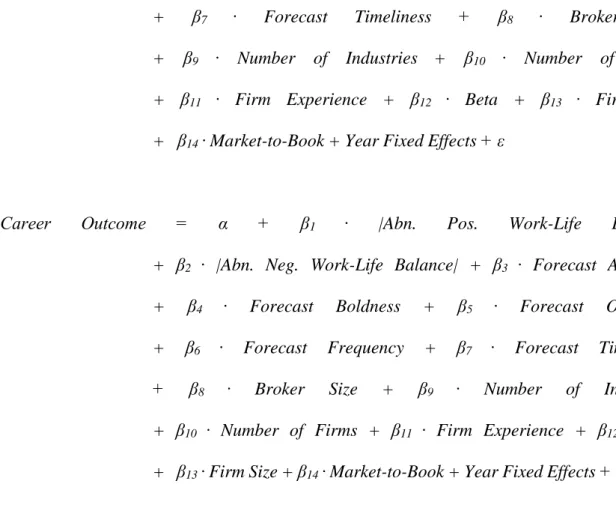
Forecast Error = α + β1 ∙ Work-Life Balance + β2 ∙ Work-Life Balance2
+ β3 ∙ Broker Size + β4 ∙ Number of Industries + β5 ∙ Number of Firms + β6 ∙ Firm Experience
+ β7 ∙ Forecast Frequency + β8 ∙ Forecast Timeliness + ε (1A)
where Work-Life Balance denotes the average WLB rating submitted by analysts for a given brokerage firm in year t. Work-Life Balance2 is the squared term of Work-Life Balance. We include the squared term because we expect a non-linear relation between Work-Life Balance
and Forecast Error. A positive (negative) coefficient on Work-Life Balance2would indicate a convex (concave) relation between WLB and analyst forecast error.14
Column 1 of Table 4 reports the result from estimating Equation (1A) without the squared term of Work-Life Balance. In this specification, Work-Life Balance is positive and significant. More importantly, column 3 of Table 4 reports the full result from estimating Equation (1A). The result shows that a U-shaped relation exists between WLB and analysts’ forecast error. Both coefficients of Work-Life Balance and Work-Life Balance2are statistically significant at the 1% level, with negative and positive signs, respectively. These findings are consistent with our hypothesis that the association between WLB satisfaction and forecast accuracy is different at high and low levels of WLB satisfaction.
13 In untabulated tests, we explicitly control for firm size, market-to-book ratio, and firm performance, and
our inferences are robust.
14 In robustness tests, we use spline specifications that include three piecewise-linear terms (Morck et al.
1988; Cho 1998; Himmelberg et al. 1999; Davies et al. 2005). Our conclusions are unaltered with this alternative specification.
We provide a descriptive plot in Panel A of Figure 1 to help with the interpretation of these results. When Work-Life Balance is lower than the inflection point (there are 91 broker-years in this case), Forecast Error decreases with Work-Life Balance. However, after the inflection point (there are 460 broker-years in this case), Forecast Error increases with Work-Life Balance. To calculate the inflection point, we begin with estimating the partial derivative of Table 4, column 3, with respect to Work-Life Balance and setting it equal to zero. At the inflection point, the marginal effect of Work-Life Balance should be equal to zero (since the inflection point is the apex of the curve). The partial derivative is equal to -0.0340 + 2 × 0.0063 × Work-Life Balance = 0. Solving for Work-Life Balance gives us 2.69.
To help interpret the economic magnitude of the effect we document, we further create two variables: |Abn. Pos. Work-Life Balance| (|Abn. Neg. Work-Life Balance|) is the absolute value of the difference between a brokerage firm’s rating and the WLB level at the inflection point when the broker’s rating is higher (lower) than the inflection point. Then we estimate the following model:
Forecast Error = α + β1 ∙ |Abn. Pos. Work-Life Balance|
+ β2 ∙ |Abn. Neg. Work-Life Balance| + β3 ∙ Broker Size
+ β4 ∙ Number of Industries + β5 ∙ Number of Firms
+ β6 ∙ Firm Experience + β7 ∙ Forecast Frequency
+ β8 ∙ Forecast Timeliness + ε (1B)
In column 5 of Table 4, we find the coefficient estimates on |Abn. Pos. Work-Life Balance| and |Abn. Neg. Work-Life Balance| are both positive and significant, consistent with our prior finding that the inflection point of Work-Life Balance is estimated to be approximately 2.69 out of 5. These results suggest that a positive (negative) one-point deviation from the
inflection point of Work-Life Balance is associated with a 1.13% (0.95%) increase in the relative Forecast Error, which is approximately 3.5% (2.9%) of the standard deviation of the relative Forecast Error. We interpret these estimates to be both plausible and economically significant.
4.2 Work-Life Balance and Earnings Forecast Timeliness
We next examine whether WLB satisfaction has a non-linear relation with earnings forecast timeliness. To test this hypothesis, we regress Forecast Timeliness on WLB and its squared term, controlling for brokerage firm size, number of firms followed, number of industries followed, and firm experience. We estimate the following models:
Forecast Timeliness = α + β1 ∙ Work-Life Balance + β2 ∙ Work-Life Balance2
+ β3 ∙ Broker Size + β4 ∙ Number of Industries
+ β5 ∙ Number of Firms+ β6 ∙ Firm Experience + ε (2A)
Forecast Timeliness = α + β1 ∙ |Abn. Pos. Work-Life Balance|
+ β2 ∙ |Abn. Neg. Work-Life Balance| + β3 ∙ Broker Size
+ β4 ∙ Number of Industries + β5 ∙ Number of Firms + β6 ∙ Firm Experience + ε (2B)
Column 2 of Table 4 reports the result from estimating Equation (2A) without the squared term of Work-Life Balance. We find that coefficient estimate on Work-Life Balance is insignificant. On the surface, the result seems to suggest that the WLB rating does not have an association with Forecast Timeliness. Column 4 of Table 4 reports the full result from estimating Equation (2A). The result shows that an inverted U-shaped relation exists between
WLB satisfaction and analysts’ earnings forecast timeliness. Both coefficients of Work-Life Balance and Work-Life Balance2are statistically significant at the 1% level (with positive and negative signs, respectively).
In Panel B of Figure 1, we can see that when WLB is relatively low, Forecast Timeliness is lower than at the inflection point of WLB, indicating that earnings forecasts are issued later in a year. However, after the inflection point, we also find lower Forecast Timeliness than at the inflection point. To help interpret the economic magnitude, we estimate Equation (2B) and report the results in column 6 of Table 4. We find that the coefficient estimates on |Abn. Pos. Work-Life Balance| and |Abn. Neg. Work-Life Balance| are both negative and significant, consistent with the existence of an optimal WLB level. In economic terms, a positive (negative) one-point deviation from the inflection point is associated with a 1.91% (1.94%) decrease in the relative Forecast Timeliness, which is approximately 6.0% (6.1% of the standard deviation of Forecast Timeliness).
4.3 Work-Life Balance and Analyst Career Outcomes
H2 predicts that WLB satisfaction has a non-linear relation on analysts’ career outcomes. We examine whether additional WLB satisfaction helps analysts to be voted as All-Stars or to be promoted to a large brokerage firm when the current WLB is relatively low, and whether additional WLB decreases the likelihood for analysts to be voted as All-Stars or to be promoted to a large brokerage firm when the current WLB satisfaction is already high. To test this hypothesis, we estimate the following probit models:
Career Outcome = α + β1 ∙ Work-Life Balance + β2 ∙ Work-Life Balance2
+ β3 ∙ Forecast Accuracy + β4 ∙ Forecast Boldness
+ β7 ∙ Forecast Timeliness + β8 ∙ Broker Size
+ β9 ∙ Number of Industries + β10 ∙ Number of Firms + β11 ∙ Firm Experience + β12 ∙ Beta + β13 ∙ Firm Size
+ β14 ∙ Market-to-Book + Year Fixed Effects + ε (3A)
Career Outcome = α + β1 ∙ |Abn. Pos. Work-Life Balance|
+ β2 ∙ |Abn. Neg. Work-Life Balance| + β3 ∙ Forecast Accuracy + β4 ∙ Forecast Boldness + β5 ∙ Forecast Optimism
+ β6 ∙ Forecast Frequency + β7 ∙ Forecast Timeliness
+ β8 ∙ Broker Size + β9 ∙ Number of Industries + β10 ∙ Number of Firms + β11 ∙ Firm Experience + β12 ∙ Beta
+ β13 ∙ Firm Size + β14 ∙ Market-to-Book + Year Fixed Effects + ε (3B)
where Career Outcome denotes AA_Award or Promote. AA_Award is an analyst’s All-American Research Team status, an indicator variable set to one if the analyst is ranked in the top three or as a runner-up by Institutional Investor in her industry in year t, and zero otherwise.
Promotion proxies for analyst promotion to a large brokerage firm and is measured as an indicator variable set to one if the analyst moves to a top-decile-size brokerage firm in year t, and zero otherwise. All other variables are defined in the Appendix.
Table 5 reports the results from estimating Equation (3A) and (3B).15 In columns 1 and 2, before including Work-Life Balance2, the coefficient estimate on Work-Life Balance is insignificant. However, columns 3 and 4 show that an inverted U-shaped relation exists between WLB satisfaction and analysts’ career outcomes. Both coefficients of Work-Life
15 The lower sample size in Table 5 compared with Table 4 is explained by the fact that whereas the
Balance and Work-Life Balance2 are statistically significant at the 5% level or better. These results are consistent with H2 that WLB satisfaction has a non-linear effect on analysts’ career advancement.
In columns 5 and 6 of Table 5, we find the coefficient estimates on |Abn. Pos. Work-Life Balance| and |Abn. Neg. Work-Life Balance| are both negative and significant, consistent with the existence of optimal work-life balance level. In economic terms, a positive (negative) one-point deviation from the estimated inflection point is associated with a 4.6% (5.2%) decrease in the likelihood of winning an All-Star Analyst award, which is approximately 14.2% (16.1%) of the standard deviation of winning an AA Award.16 Similarly, a positive (negative) one-point deviation from the estimated inflection point is associated with a 2.2% (2.7%) decrease in the likelihood of being promoted to a large brokerage firm, which is approximately 16.2% (19.9%) of the standard deviation of Promotion.17
In the tests of career advancement, we control for analysts’ performance at the portfolio level such as earnings forecast accuracy and timeliness, as well as other earnings forecast characteristics such as boldness, optimism, and frequency. The results suggest that, earnings forecast timeliness is valued by both institutional investors and prospective employers. Earnings forecast frequency (accuracy) is additionally valued by institutional investors (prospective employers). Importantly, even after controlling for analysts’ performance, WLB satisfaction still has an incremental effect on analysts’ career advancement. We also control for analysts’ research-portfolio characteristics and consistently find that analysts who follow more firms and larger firms tend to have better career outcomes (which is consistent with prior literature).
16 Alternatively, these numbers correspond to 38.7% and 43.7% of the mean AA Award, respectively. 17 Alternatively, these numbers correspond to 115.8% and 142.1% of the mean Promotion, respectively.
5. Additional Analyses and Robustness Tests
5.1 Work-Life Balance Measured at the Broker-Office Level
In our main analyses, we focus on broker-level WLB to examine the role of WLB in an analyst’s performance and career path. We extend our study to the broker-office level. We manually collect the LinkedIn profiles of financial analysts in our sample and extract data on their current and historical locations. We then aggregate all analyst employees’ WLB ratings in a given year and city to create a broker-office-year measure. In this way, we are able to test the cross-sectional difference of WLB within a broker. We re-estimate Equations (1) – (3) using the office-level WLB ratings.
In columns 1 and 2 of Table 6, Panel A, we find a non-linear U-shaped relation between WLB satisfaction and analysts’ performance - both coefficients of Work-Life Balance and
Work-Life Balance2are statistically significant. In columns 3 and 4, we further find that both coefficient estimates of |Abn. Pos. Work-Life Balance| and |Abn. Neg. Work-Life Balance| are statistically significant.
In columns 1 and 2 of Table 6, Panel B, we consistently find an inverted U-shaped relation between WLB satisfaction and analysts’ career outcomes, with both coefficients of
Work-Life Balance and Work-Life Balance2being statistically significant. In columns 3 and 4, the coefficient estimates on |Abn. Pos. Work-Life Balance| and |Abn. Neg. Work-Life Balance| are significant in three out of four cases.
Overall, the results at the broker-office-level are similar to those at the broker level. We document a non-linear association between WLB satisfaction and analysts’ performance and career advancement. In particular, for analysts working at offices with relatively low (high)
level of perceived WLB, an increase in WLB can benefit (hurt) their performance and career outcomes.18
5.2 Potential Moderating Effects of Personal Characteristics
We further explore potential moderating effects of analyst-specific personal characteristics. We examine the role of gender, level of seniority, and education (i.e., whether or not the analyst has an MBA degree).
To investigate the moderating effect of gender, we construct a matched sample of male and female analysts because females only account for 10% of the analysts in our sample. Specifically, each female analyst is randomly matched with a male analyst working for the same broker and who follows the same industry in the same year. Then, we modify Equations (1), (2), and (3) by including a Female indicator and its interactions with Work-Life Balance,
Work-Life Balance2, |Abn. Pos. Work-Life Balance|, and |Abn. Neg. Work-Life Balance|. In columns 1 and 3 of Table 7, Panel A, we find that WLB satisfaction affects both female and male analysts’ earnings forecast accuracy. However, in columns 2 and 4 of Table 7, Panel A, we find that unlike male analysts, female analysts’ earnings forecast timeliness is not affected by WLB satisfaction. Furthermore, the results of Table 7, Panel B, collectively suggest that female analysts’ career advancement is less affected by WLB satisfaction. This is consistent with Kumar (2010) who suggests that female analysts are a special group of competitive and less risk-averse females who choose to pursue a career in a male-dominated industry. Due to this self-selection process, females are likely to be more skillful and stronger than male counterpart analysts.
18 In untabulated tests, we control for WLB in different cities by including city fixed effects in all regressions.
When we focus on the level of seniority of the analysts, we find that junior analysts’ performance and external promotion are less affected by WLB relative to senior analysts (untabulated). This is likely because junior analysts have higher motivation to perform. Finally, we do not find any differential effects for analysts with and without an MBA degree (untabulated).
5.3 Alternative Performance Measure: Stock-Recommendation Profitability
In this section, we use stock-recommendation profitability as an alternative measure for analysts’ performance. We estimate the following OLS models separately for buy and sell recommendations, where buy (sell) recommendations include analysts’ strong buy and buy (hold, sell, and strong sell) recommendations.
BHAR = α + β1 ∙ Work-Life Balance + β2 ∙ Work-Life Balance2
+ β3 ∙ Broker Size + β4 ∙ Number of Industries + β5 ∙ Number of Firms
+ β6 ∙ Firm Experience + β7 ∙ Firm Size + β8 ∙ Market-to-Book + β9 ∙ Beta
+ Industry Fixed Effects + ε (4A)
BHAR = α + β1 ∙ |Abn. Pos. Work-Life Balance| + β2 ∙ |Abn. Neg. Work-Life Balance|
+ β3 ∙ Broker Size + β4 ∙ Number of Industries + β5 ∙ Number of Firms
+ β6 ∙ Firm Experience + β7 ∙ Firm Size + β8 ∙ Market-to-Book + β9 ∙ Beta
+ Industry Fixed Effects + ε (4B)
where BHAR is the natural logarithm of one plus the buy-and-hold market-adjusted return to the analyst’s stock recommendation for firm j. The window for calculating BHAR is the analyst’s [current recommendation date + 2 days, next recommendation date – 2 days].
Following Cohen, Frazzini, and Malloy (2010), we let a recommendation expire if it is not revised or reiterated within 365 days.
In column 1 of Table 8, we find that an inverted U-shaped relation exists between WLB and buy-recommendation profitability. In column 2, the results show that the coefficient estimates on |Abn. Pos. Work-Life Balance| and |Abn. Neg. Work-Life Balance| are both negative and significant, suggesting that deviations from the inflection point of WLB level are associated with less profitable buy recommendations and thus worse analyst performance. However, in columns 3 and 4, we do not find significant effects for analysts’ sell recommendations.19
5.4 Excluding Extreme Ratings
Our inferences are unaltered after excluding broker-years with extremely high or low ratings or with few reviews (untabulated). Specifically, our conclusions hold after excluding (1) broker-years with a rating lower than 2 or higher than 4, (2) broker-years with a rating lower than 2.5 or higher than 3.5, or (3) broker-years with fewer than 2, 3, 4, or 5 Glassdoor reviews.20
5.5 Controlling for Other Glassdoor Ratings
Glassdoor also allows users to rate other aspects of their firms, including Company Benefits, Senior Management, Culture & Values, Career Opportunities, Approval of CEO, Outlook, and Recommend to a Friend. In order to ensure that our WLB measure is not merely
19 A possible explanation is that the literature consistently shows a much stronger market response to sell
recommendations (i.e., there may be less room for incremental effects of WLB).
20 Specifically, in the analyst-career-outcome sample, 92.04% of the analyst-years are associated with a WLB
rating between 2 and 4, 60.8% are associated with a rating between 2.5 and 3.5, and 70.93% are associated with a rating calculated based on 5 or more Glassdoor reviews. The percentages are similar for the analyst-performance sample.
a subset of these other ratings, we include all ratings in the same regression. No inferences are affected (untabulated).21
5.6 Potential Remaining Endogeneity (IV)
Although our empirical tests include a number of control variables motivated by prior research and we use standardized measures that embed firm-year controls, we acknowledge that analyst performance could also affect their WLB satisfaction. Therefore, we employ an instrumental-variable approach to better identify causality (i.e., to control for unobservable potentially correlated omitted variables). Our instruments are Best State, an indicator for brokerage firms located in the best state for living (Massachusetts; USA Today 2016) and Worst Traffic City, an indicator for brokers located in the worst city for traffic (Los Angeles; TomTom Traffic Index). These instruments satisfy both the relevance (with F-statistics well above the critical value) and exclusion criteria (with both instruments being statistically insignificant when added to the original model, consistent with the instruments being uncorrelated with the error term).
In the first stage, we regress Work-Life Balance and Work-Life Balance2 on Best State,
Worst Traffic City, and all the other independent variables in the corresponding regression models. We obtain the predicted values from the first stage. In the second stage, we regress proxies for performance and career advancement on predicted Work-Life Balance and Work-Life Balance2. In untabulated tests, our conclusions are unaltered.
21 We also test whether these other Glassdoor ratings have a moderating effect on WLB. Not surprisingly,
there is some evidence that the effects for WLB are attenuated when the employer’s overall ratings or career opportunities are high.
5.7 Alternative Career Outcome Measures
Although we rely on a long line of analyst research in choosing to focus on analysts being awarded the All-Star status and being promoted to larger brokerage firms, clearly other outcome variables exist. For example, the motivation behind some of the WLB programs in banks is not only to improve performance but also to increase employee retention. Consequently, we additionally test for the effects on analyst retention.22 In untabulated
analyses we observe that U-shaped relations exist also for employee retention.
Further, we examine whether analysts tend to move to brokerage firms with high WLB satisfaction. We find that when their current WLB satisfaction is low (high), analysts are indeed attracted (not attracted) by alternative employers who value WLB (untabulated).
5.8 Alternative Specification for Non-Linearity
Given the possibility of a non-linear association, we test our hypothesis using quadratic regressions in the main analyses (McConnell and Servaes 1990; Himmelberg et al. 1999; Collin-Dufresne et al. 2001; Wyatt 2005; Hillary and Huang 2018). In robustness tests, we use spline regressions to ensure that our assumption of nonlinearity is appropriate (Morck et al. 1988; Cho 1998; Himmelberg et al. 1999; Davies et al. 2005). Spline regressions do not assume the association to be of a specific form, thus they are useful in establishing the characteristics of a non-linear association. In untabulated tests, our inferences are unaffected. Spline regressions require specifying knots at which the slope of the function changes and thus may be affected by the choice of knots. In contrast, the quadratic regressions do not impose such requirements. Therefore, spline regressions and quadratic regressions complement each other
22 Specifically, analyst retention is an indicator variable set to one if the analyst works for the same brokerage
and increase the reliability of our inferences.
6. Conclusion
This study investigates the role of financial analysts’ work-life balance in their performance and career advancement. Using an extensive sample of Glassdoor reviews by financial analysts, we find that when work-life balance satisfaction is relatively low, an increase in work-life balance satisfaction improves performance and is associated with better career advancement of analysts; however, when work-life balance satisfaction is already high, an increase in work-life balance satisfaction is associated with worse performance and career advancement. Collectively, our results suggest a significant non-linear effect of work-life balance on analysts’ performance and career advancement.
Our paper contributes to the debate on work-life balance in the financial industry. The findings suggest that shifting too many resources from work or personal life can hurt analysts’ performance and career advancement. This study also contributes to the literature on the interaction of job satisfaction and job performance, as well as the growing literature on information aggregation and the wisdom of the crowd. Overall, our article provides the first large-sample evidence that reaching the optimal work-life balance is important not only for individuals but also for employers in the brokerage industry.
References
Arthur, M. M. 2003. Share price reaction to work-family initiatives: An institutional perspective. The Academy of Management Journal 46: 497-505.
Banker, R. D., C. Konstans, and R. Mashruwala. 2000. A contextual study of links between employee satisfaction, employee turnover, customer satisfaction and financial performance. Working Paper.
Bloom, N., T. Kretschmer, and J. Van Reenen. 2011. Are family-friendly workplace practices a valuable firm resource? Strategic Management Journal 32: 343-367.
Braun, S., and C. Peus. 2016. Crossover of work-life balance perceptions: Does authentic leadership matter? Journal of Business Ethics: 1-19.
Brayfield, A. H. and W. H. Crockett. 1955. Employment attitudes and employee performance.
Psychological Bulletin 52: 396-424.
Brown, L. D., A. C. Call, M. B. Clement, and N. Y. Sharp. 2015. Inside the “black box” of
sell‐side financial analysts. Journal of Accounting Research 53 (1): 1-47.
Buchheit, S., D. W. Dalton, N. L. Harp, and C. W. Hollingsworth. 2016. A contemporary analysis of accounting professionals’ work-life balance. Accounting Horizons 30 (1): 41-62.
Chen, H., P. De, Y. J. Hu, and B. Hwang. 2014. Wisdom of crowds: The value of stock opinions transmitted through social media. Review of Financial Studies 28: 2009-2049.
Cho, M. 1998. Ownership structure, investment, and the corporate value: An empirical analysis.
Journal of Financial Economics 47: 103-121.
Christen, M., G. Iyer, and D. Soberman. 2006. Job satisfaction, job performance, and effort: A reexamination using agency theory. Journal of Marketing 70: 137-150.
Clement, M. B. 1999. Analyst forecast accuracy: Do ability, resources, and portfolio complexity matter? Journal of Accounting & Economics 27: 285-303.
Clement, M. B., and S. Y. Tse. 2003. Do investors respond to analysts’ forecast revisions as if forecast accuracy is all that matters? The Accounting Review 78: 227-249.
Cohen, L., A. Frazzini, and C. Malloy. 2010. Sell-side school ties. Journal of Finance 65: 1409-1437.
Collin-Dufresne, P., R. S. Goldstein, and J. S. Martin. 2001. The determinants of credit spread changes. Journal of Finance 56: 2177-2207
Cook, J. M. 2005. Happy people, happy clients. Journal of Accountancy 200: 38-40.
Davies, J. R., D. Hillier, and P. McColgan. 2005. Ownership structure, managerial behavior, and corporate value. Journal of Corporate Finance 11: 645-660.
Edmans, A. 2011. Does the stock market fully value intangibles? Employee satisfaction and equity prices. Journal of Financial Economics 101: 621-640.
Fisher, C. D. 2003. Why do lay people believe that satisfaction and performance are correlated? Possible sources of a commonsense theory. Journal of Organization Behavior 24: 753-777.
Futrell, C. M., and A. Parasuraman. 1984. The relationship of satisfaction and performance to salesforce turnover. Journal of Marketing 48: 33-40.
Green, T. C., R. Huang, Q. Wen, and D. Zhou. 2018. Crowdsourced employer reviews and stock returns. Journal of Financial Economics, forthcoming.
Guthrie, J. P. 2001. High-involvement work practices, turnover, and productivity: Evidence from New Zealand. The Academy of Management Journal 44: 180-190.
Harter, J. K., L. S. Frank, and T. L. Hayes. 2002. Business-unit-level relationship between employee satisfaction employee engagement, and business outcomes: A meta-analysis.
Journal of Applied Psychology 87: 268-279.
Hilary, G., and C. Hsu. 2013. Analyst forecast consistency. Journal of Finance 68: 271-297. Hilary, G., and S. Huang. 2018. Zombie Board: Board tenure and firm performance. Journal
of Accounting Research, forthcoming.
Himmelberg, C. P., R. G. Hubbard, and D. Palia. 1999. Understanding the determinants of managerial ownership and the link between ownership and performance. Journal of Financial Economics 53: 353-384.
Hofstede, G., B. Neuijen, D. D. Ohayv, and G. Sanders. 1990. Measuring organizational cultures: A qualitative and quantitative study across twenty cases. Administrative Science Quarterly 35: 286-316.
Hong, H., and J. D. Kubik. 2003. Analyzing the analysts: Career concerns and biased earnings forecasts. Journal of Finance 58: 313-351.
Huang, J. 2018. The customer knows best: The investment value of consumer opinions. Journal of Financial Economics 128: 164-182.
Jacob, J., T. Z. Lys, and M. A. Neale. 1999. Expertise in forecasting performance of security analysts. Journal of Accounting and Economics 28: 51-82.
Jennings, J. E., and M. S. McDougald. 2007. Work-family interface experiences and coping strategies: Implications for entrepreneurship research and practice. Academy of Management Review 32: 747-760.
Ji, Y., O. Rozenbaum, and K. Welch. 2017. Corporate culture and financial reporting risk: Looking through the Glassdoor. Working Paper.
Judge, T. A., C. J. Thoresen, J. E. Bono, and G. K. Patton. 2001. The job satisfaction-job performance relationship: A qualitative and quantitative review. Psychological Bulletin
127: 376-407.
Khavis, J. A., and J. Krishnan. 2018. Employee satisfaction in accounting firms, work-life balance, turnover, and audit quality. Working Paper.
Konrad, A. M., and R. Mangel. 2000. The impact of work-life programs on firm productivity.
Strategic Management Journal 21: 1225-1237.
Kumar, A. 2010. Self-selection and the forecasting abilities of female equity analysts. Journal of Accounting Research 48: 393-435.
Lazear, E. P. 1981. Agency, earnings profiles, productivity, and hours restrictions. The American Economic Review 71: 606-620.
Leone, A., and J. S. Wu. 2007. What does it take to become a superstar? Evidence from institutional investor rankings of financial analysts. Working paper.
Li, C., A. Lin, and H. Lu. 2018. Analyzing the analysts: The effects of technical and social skills on analyst careers. Working Paper.
Lim, T. 2001. Rationality and analysts’ forecast bias. Journal of Finance 56: 369-385.
McConnell, J., and H. Servaes. 1990. Additional evidence on equity ownership and corporate value. Journal of Financial Economics 27: 595-612.
Major, V. S., K. J., Klein, and M. G. Ehrhart. 2002. Work time, work interference with family, and psychological distress. Journal of Applied Psychology 87: 427-436.
Morck, R., A. Shleifer, and R. W. Vishny. 1988. Management ownership and market valuation: An empirical analysis. Journal of Financial Economics 20: 293-315.
Netemeyer, R. G., J. G. Maxham III, and C. Pullig. 2005. Conflicts in the work-family interface: Links to job stress, customer service employee performance, and customer purchase intent. Journal of Marketing 69: 130-143.
Organ, D. W. 1977. A reappraisal and reinterpretation of satisfaction-causes-performance hypothesis. The Academy of Management Review 2: 46-53.
Ostroff, C. 1992. The relationship between satisfaction, attitudes, and performance: An organizational level analysis. Journal of Applied Psychology 77: 963-974.
Ostroff, C. 1993. Comparing correlations based on individual-level and aggregated data.
Journal of Applied Psychology 78: 569-582.
Perry-Smith, J. E., and T. C. Blum. 2000. Work-family human resources bundles and perceived organizational performance. The Academy of Management Journal 43: 1107-1117. Petty, M. M., G. W. McGee, and J. W. Cavender. 1984. A meta-analysis of the relationships
between individual job satisfaction and individual performance. Academy of Management Review 9: 712-721.
Rich, B. L., J. A. Lepine, and E. R. Crawford. 2010. Job engagement: Antecedents and effects on job performance. The Academy of Management Journal 53: 617-635.
Shamir, B., and I. Salomon. 1985. Work-at-home and the quality of working life. Academy of Management Review 10: 455-464.
Shroff, P., R. Venkataraman, and B. Xin. 2014. Timeliness of analysts’ forecasts: The information content of delayed forecasts. Contemporary Accounting Research 31: 202-229.
Trefalt, S. 2013. Between you and me: Setting work-nonwork boundaries in the context of workplace relationships. The Academy of Management Journal 56: 1802-1829.
Wyatt, A. 2005. Accounting recognition of intangible assets: Theory and evidence on economic determinants. The Accounting Review 80: 967-1003.