22
Economic Value Added (EVA) and Shareholders Wealth
Creation: A Factor Analytic Approach
A.Vijayakumar*
Erode Arts and Science College, Erode, Tamilnadu, India * E-mail of the corresponding author: drvijayponne_erode@bsnl.in
Abstract
Corporate performance is affected by various factors ranging from company specific, industry specific and economic variables. There had been wide acceptance on the objective of the firm to maximize the value. Among the set of popular value based management, Economic Value Added (EVA) is the most prominent. Therefore, in this study, an attempt has been made whether EVA has got a better predictive power of selected automobile companies in India. In order to disclose the factors contribute much towards shareholders wealth maximization, factor analysis has been done. The results of the study showed that out of the eight variables, three factors have been extracted and these three factors put together explain 69.902 per cent of the total variance. Further, sales and profit after tax are found to have a stronger relationship with EVA.
Key Words
Economic value added, Factor analysis, Shareholders wealth, Value based management and Market value added
1. Introduction
Corporate performance measurement is one of the emerging areas of research in finance among the researchers all over the world. Several studies are carried to find out what influences the share price (market price) of a company. Corporate performance is affected by various factors ranging from company specific, industry specific and economic variables. For long, there had been wide acceptance on the objective of the firm to maximize the value or wealth maximization. While the principle that fundamental objective of the business concerns is to increase the value of its shareholder’s investment is widely accepted, there is substantially less agreement about how this is accomplished (Rappaport, 1986). As the lenders (debt and others), can protect themselves contractually, the objective can be narrowed down to maximizing stockholders value or stockholders wealth. When financial markets are efficient, the objective of maximizing stockholder wealth can be narrowed even further – to maximizing stock prices (Damodaran, 1996).
Even through stock price maximization as an objective is the narrowest of the value maximization objectives, it is the most prevalent one. It is argued that the stock prices are the most observable of all measures that can be used to judge the performance of a publicly traded firm. Besides this, the stock price is a real measure of stockholder wealth, since stockholders can sell their stock and receive the price now. While the responsibility of firm value maximization has to be fixed with the managers, using stock prices as a measure of periodic measure of corporate performance throws a serious problem. While many argue that the stock prices are not under the full control of the managers, there are many others who believe that stock price maximization leads to a short-term focus for manager-as the stock prices are determined by traders, short-term investors and analysts, all of whom hold the stock for short-periods and spend their time trying to forecast next quarter’s earnings.
According to Rappaport (1986), within a business, there are seven drivers (sales growth rate, operating profit margin, income tax rate, working capital investment, fixed capital investment, cost of
23
capital and forecast duration) that can be managed to create value. The theory suggests that improvement in these value drivers leads to an increase in shareholders’ value. So, traditionally periodic corporate performance is most often measured using some variant of historical accounting income (eg. Net Profit, EPS) or some measures based on the accounting income (eg. ROI / ROCE). However, it had long been recognized that accounting income is not a consistent predictor of firm value creation and the traditional measures are not appropriate for evaluation of corporate performance.
An appropriate measure of corporate performance on one hand should be highly correlated to share holder return and on the other hand should be able to signal the extent of periodic wealth creation. A search for such a measure had been the trigger for the rapidly growing literature on Value Based Management (VBM). Among the set of popular VBM systems, a variant of the traditional residual income measure known as Economic Value Added (EVA) is arguably the most prominent. Therefore, the present study examines whether Economic Value Added has got any association with the shareholders wealth creation.
2. Review of Literature
Stern (1990) observed that EVA as a performance measure captures the true economic profit of an organization. EVA-based financial management and incentive compensation scheme gives managers better-quality information and superior motivation to make decisions that will create the maximum shareholder wealth in an organization. Grant (1996) found that EVA concept might have everlastingly changed the way real profitability is measured. EVA is a financial tool that focuses on the difference between company's after tax operating profit and its total cost of capital. Luber (1996) confirmed that a positive EVA over a period of time will also have an increasing MVA while negative EVA will bring down MVA as the market loses confidence in the competence of a company to ensure a handsome return on the invested capital.
Banerjee (1997) has conducted an empirical research to find the superiority of EVA over other traditional financial performance measures. ROI and EVA have been calculated for sample companies and a comparison of both showing the superiority of EVA over ROI. KPMG - BS study (1998) assessed top 100 companies on EVA, Sales, PAT and MVA criteria. The Survey has used the BS - 1000 list of companies using a composite index comprising sales, profitability and compounded annual growth rate of those companies covering the period 1996-97. Sixty companies have been found able to create positive Shareholder Value whereas 38 companies have been found to destroy it. Bao and Bao (1999) revealed that the EVA is positively and significantly correlated with the firm value. Banerjee (2000) attempted to find out whether Market Value of firm if the function of Current Operational Value (COV) and Future Growth Value (FGV). Based on the analysis of his data he comes to the conclusion that in many cased there was a considerable divergence between MVA and the sum total of COV and FGV.
Mangala and Simpy (2002) discussed the relationship between EVA and Market Value among various companies in India. The results of the analysis confirm stern's hypothesis and concluded that the company's current operational value was more significant in contributing to change in market value of share in Indian context. Manorselvi and Vijayakumar (2007) in their study revealed that the traditional measures of performance do not reflect the real value addition to shareholders wealth and EVA has to be explained shareholders value addition. Vijayakumar (2008) empirically indicated that Net Operating profit After Tax (NOPAT) and Return on Net Worth (RONW) are the most significant variable with MVA followed by EVA and EPS. Vijayakumar (2010), in his study supports the hypothesis of Stern and Stewart's that MVA of firm was largely positively associated with EVA in all the selected sectors of Indian Automobile industry. It appears that the concept of EVA, as an emerging concept of financial management
24
is fairly clear in the minds of almost all these researches whose studies have been reviewed above. In a fast changing business environment, the investor friendly financial performance measures may be the need of hour.
3. Measurement of Economic Value Added (EVA)
EVA introduced by Stern Stewart & Company is an incarnation of Residual Income concept. Stewart defined ‘EVA as an estimate of true economic profit, the amount by which earnings exceed or fall short of required minimum rate of return investors could get by investing in other securities of comparable risk’. It is the net operating profit minus the appropriate charge for the opportunity cost of capital invested in an enterprise (both debt and equity).
Expressed as a formula, EVA for a given period can be written as: EVA = NOPAT - Cost of Capital Employed
= NOPAT – (WACC x CE) (1)
Where
NOPAT - Net Operating Profit After Taxes but before financing costs WACC - Weighted Average Cost of Capital; and
CE - Capital Employed
(or)
equivalently, if rate of return is defined as NOPAT / Capital, this turns into a perhaps more revealing formula:
EVA = (Rate of Return – Cost of Capital) X Capital (2)
Where
Rate of return - NOPAT / Capital
Capital Employed - Total of balance sheet minus non-interest bearing debt in the beginning of the year.
Cost of Capital - [Cost of equity X proportion of equity from capital] + [(cost of debt X proportion of debt from capital) X (1-tax rate)]
Cost of capital or weighted average cost of capital is the average cost of both equity capital and interest bearing debt.
3.1 Cost of debt (Kd)
Cost of debt refers to the average rate of interest the company pays for its debt obligations. Cost of debt (Kd) has been computed as:
Kd = Total interest expenses X (1-Effective tax rate) /
Beginning total borrowings (3)
While calculating beginning borrowing all short-term as well as long-term borrowings has to be included as all debts are interests bearing. Therefore, interest paid in the financial year has been considered as total interest expenses.
25
To find out cost of equity (Ke), Capital Assets Pricing Model (CAPM) has been used. This model
holds that firms’ equity cost is the composition of risk free rate of return for a stock plus premium representing the volatility of share prices. According to this model, Ke is the shareholders’ expected rate of
return and this expected rate of return (Rj) is as follows:
Rj = Rf + β X (Rm – Rf)
(4) Where, Rf - Risk free rate of return,
Rm - Market rate of return, and
β - Sensitivity of the share price in relation to the market index
The interest rate of Government securities has been considered as a proxy for risk free rate of return. The market rate of return has been calculated by using Index Numbers of Security Prices (Bombay Stock Exchange) from year to year basis. The yearly return of the index numbers has been computed by using the following formula:
Rm = [(Index number for current year – Index number for previous
Year) / (Index number of previous year) ] x 100 (5)
Beta (β) is the risk-free co-efficient which measures the volatility of a given script of a company with respect to volatility of market. It is calculated by comparing return on a share to return in the stock market. Mathematically, beta is the statistical measure of volatility. It is calculated as covariance of daily return on the stock market indices and the return on daily share prices of a particular company, divided by variance of return on daily stock market indices. The Beta co-efficient has been calculated as follows:
βj = COVim / σm2
(6)
where, βj - is the Beta of the security in the question
COVim - stands for co-variance between the return of security and return of market, and
σm2 - stands for the variance of market return 3.3. Market Value Added (MVA)
While EVA measures shareholder value addition of firm in terms of its real economic performance, MVA measures market’s assessment of firm’s value. MVA thus measures value by the management over and above the capital invested in the company by investors.
Market Value Added (MVA) = Market value of company - Capital employed (7)
For a public limited company, its market value is calculated as market value of its equity (number of shares outstanding times their share price) plus book value of debt (since market value of debt is generally not available). Capital employed is effectively the book value of investments in the business made-up of debt and equity. Effectively, the formula becomes
Market Value Added (MVA) = Market value of equity - Book value of equity (8)
26
These items have been obtained from balance sheet statement of companies. Data for the market price existing on the close of financial year has been collected from the Economic Times, CMIE Prowess and Capitaline databases.
4. Sampling Selection
Keeping in view the scope of the study, it is decided to include all the companies under automobile industry working before or from the year 1996-97 to 2008-09. There are 26 companies operating in the Indian automobile industry. But, owing to several constraints such as non-availability of financial statements or non-working of a company in a particular year etc., it is compelled to restrict the number of sample companies to 20. Out of 20 selected companies under Indian Automobile Industry, three Multinational Companies (MNC’s) namely Hyundai Motors India Ltd, Honda Siel Cars India Ltd and Ford India Private Ltd were omitted because these companies established their operations in India in different accounting years. The companies under automobile industry are classified into three sectors namely; Commercial vehicles, Passenger cars and Multi-utility vehicles and Two and three wheelers. For the purpose of the study all the three sectors have been selected. It accounts for 73.23 per cent of the total companies available in the Indian automobile industry. The selected 20 companies include 5 under commercial vehicles, 3 under passenger cars and multi-utility vehicles and 9 under two and three wheeler sectors. It is inferred that sample company represents 98.74 percentage of market share in commercial vehicles, 79.76 percentage of market share in passenger cars and Multi-utility vehicles and 99.81 percentage of market share in two and three wheelers. Thus, the findings based on the occurrence of such representative sample may be presumed to be true representative of automobile industry in the country.
The study is mainly based on secondary data. The major source of data analyzed and interpreted in this study related to all those companies selected is collected from “PROWESS” database, which is the most reliable on the empowered corporate database of Centre for Monitoring Indian Economy (CMIE). Besides prowess database, relevant secondary data have also been collected from BSE Stock Exchange Official Directory, CMIE Publications, Annual Survey of Industry, Business newspapers, Reports on Currency and Finance, Libraries of various Research Institutions, through Internet etc.
5. Analysis of EVA
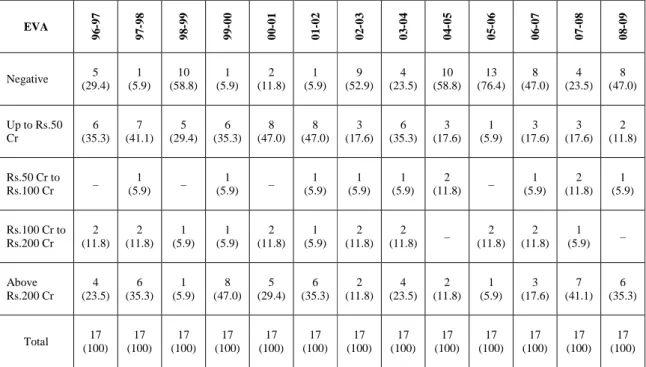
The concept of EVA is well established in financial economics but only recently this term has moved into the main stream of corporate finance, as more and more companies have started adopting it as the base for business planning and financial performance monitoring. There is grouping evidence that EVA, not EBIT, determines the value of a firm. Effective use of capital is the key to value. The present part of analysis examines in detail the EVA of sample companies. A ranking has been done with respect to EVA. Various statistical measures like mean, standard deviation, range, variance, skewness and kurtosis have been computed to understand the central tendency and dispersion of EVA of sample companies. Kendall tau-b has been used to test the association between the selected financial variables. Multiple regressions have been adopted to find out the best predictor from among the independent variables. EVA based frequency distribution of sample companies is shown by Table 1. It is clear from the Table 1 that during the first six years of the study period, 29.4 per cent in 1996-97, 5.9 percent in 1997-98, 58.9 per cent in 1998-99, 5.9 per cent in 1999-2000, 11.8 per cent in 2000-2001 and 5.9 per cent in 2001-02 have registered negative EVA. Looking at the Table 1, it is also inferred that around 53 per cent to 76 per cent of the sample companies have registered negative EVA during the year 2002-03 to 2008-09.
Around 29 per cent to 47 per cent of the companies during the first six years of the study period and around 6 per cent to 35 per cent of the sample companies during the last six years under study are
27
generating positive EVA, but it has been up to 50 crores. About 6 per cent to 12 per cent of the sample companies from 1996-97 to 2001-02 and about the same percentage of the sample companies from 2003-04 to 2008-09 reported an EVA of over Rs. 100 crores to Rs. 200 crores. Table 1 reveal that the number of companies generating EVA in the range of above Rs. 200 crores has drastically come down during 2002-03 to 2006-07.
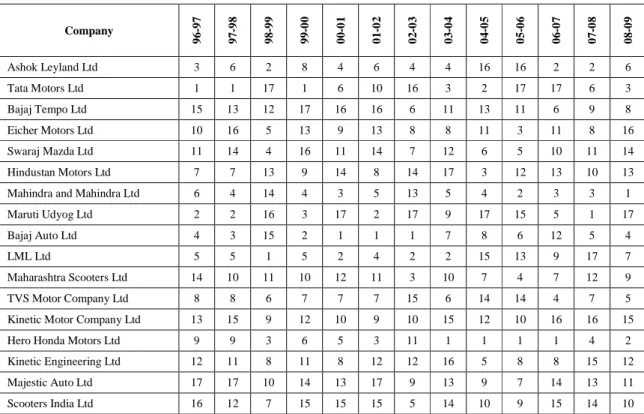
5.1. Trends in EVA-Based Rankings
Trends in EVA of sample companies (year-wise ranking) and Trends in EVA of top 5 and last five of the sample companies are portrayed by Table 2 and Table 5. The top five companies include Bajaj Auto Ltd, Hero Honda Motors Ltd, Mahindra and Mahindra Ltd, Ashok Leyland Ltd and Tata Motors Ltd. Out of the these five companies, one company namely Mahindra and Mahindra Ltd belongs to passenger cars and multiutility vehicles sector, two companies namely Bajaj Auto Ltd and Hero Honda Motors Ltd belongs to two and three wheelers sector and the remaining two companies namely Ashok Leyland Ltd and Tata Motors Ltd belongs to commercial vehicles sector. In four out of thirteen years Hero Honda Motors Ltd and three out of thirteen years Tata Motors Ltd and Bajaj Auto Ltd have been holding the first rank. However in the terminal years, Tata Motors Ltd and Bajaj Auto Ltd EVA performance is quite discouraging. Among the last five companies namely Maruti Udyog Ltd, Kinetic Motor Company Ltd, Majestic Auto Ltd, Kinetic Engineering Ltd and Scooters India Ltd which all belongs to two and three wheelers sector.
5.2. Results and Discussion on statistical analysis of EVA
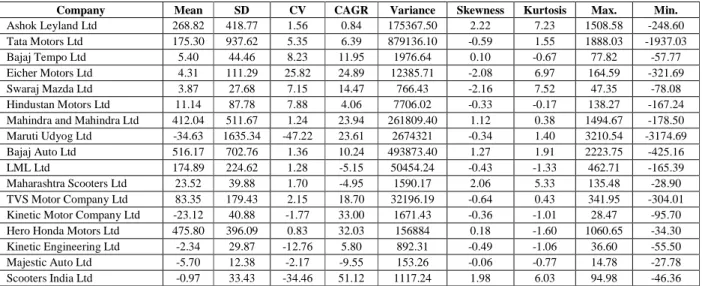
Different statistical measures have been computed for understanding the central tendency and dispersion of EVA of sample companies. For this purpose, statistical value of the mean, range, standard deviation, variance, skewness and kurtosis have been computed. Kurtosis and skewness have been calculated to show about the distribution (Symmetric/ Asymmetric). Kurtosis is measures of the “peakedness” or the “flatness” of a distribution. A kurtosis value near zero (o) indicates a shape close to normal. A positive value for the kurtosis indicates a distribution more peaked than normal. Negative kurtosis indicates a shape flatter than normal. An extreme negative kurtosis (eg.<–5.0) indicates a distribution where more of the values are in the tails of the distribution that around the mean. A kurtosis value between ± 1.0 is considered excellent for most psychometric purposes and a value between ± 2.0 in many cases also acceptable. Skewness measures to what extent a distribution of values deviates from symmetry around the mean. A value of zero represents a symmetric or evenly balanced distribution. A positive skewness indicates a greater number of smaller values. A negative skewness indicates a greater number of larger values. A skewness value between ± 1 is considered excellent and a value between ± 2 is in many cases acceptable.
Company-wise statistical analysis of EVA is offered by Table 3 where it is observed that out of the selected seventeen companies, twelve companies (71 per cent) have registered positive mean EVA, whereas Bajaj Auto Ltd stands first in the list with the higher average followed by Hero Honda Motors Ltd, Mahindra and Mahindra Ltd, Ashok Leyland Ltd and Tata Motors Ltd. The values of range show the high volatility in EVA and that of standard deviation and variance display the variation scale from central tendency and dispersion. Fourty one per cent companies (7 out of 17) have their EVA positively skewed and 58 per cent companies (10 out of 17) indicate positive kurtosis reflecting that the observations cluster more and with longer tails.
28
Various statistical tools like mean, standard, deviation, variance, range, skewness and kurtosis show inconsistent results to get a grip over EVA’s behaviour. Supplementary information based on statistical analysis is considered necessary to understand the behaviour patterns of the EVA measure. The generic research task of this part is to observe and assess how the EVA measure is related with the long established but traditional measures. In this section, an attempt has been made to bring out the basic analysis of relationship between selected financial measures and EVA of selected companies during the study period. These measures include Turnover, Return on Sales (ROS), Return on Total Assets (ROTA), Return on Capital Employed (ROCE), Earnings Per Share (EPS), Market Price Per Share (MP) and Market Value Added (MVA). These measures are mainly used to appraise the financial performance of a corporate. Kendall’s tau-b has been considered appropriate tool to measure the relationship of EVA with selected financial variables, since it is based on the ranked variables.
5.4. Kendall’s TAU-B
It is a non parametric measure of association for ordinal or ranked variables that takes ties into account. The sign of the coefficient indicates the direction of the relationship, and its absolute value indicates the strength, with large absolute values indicating stronger relationships. The relationship of EVA with the selected financial variables has been analyzed and are presented in the Table 4. Table 4 puts forward the synoptic description of the relationship of EVA with select financial variables for the selected Indian Automobile Companies during the study period. Glancing all the way through the Table 4, it is noticed that the correlation between EVA and sales is found at above moderate level in Kinetic Motor Company Ltd and Hero Honda Motors Ltd and significant at 1 per cent level. On the other hand, the correlation between these variables in Maruti Udyog Ltd, Bajaj Auto Ltd and Scooters India Ltd recorded negative trend but significant at 5 per cent level only in Scooters India Ltd. Below moderate level of relationship was found during the study period for the remaining companies with regard to EVA with sales. The correlation coefficient explaining the relationship between EVA and ROS reveals that below moderate level of relationship was found with regard to EVA with ROS except Kinetic Motor Company Ltd but significant at 1 per cent level. The correlation co-efficient explaining the relationship between EVA with ROTA reveals that below moderate level relationships exists in all the selected companies except Kinetic Motor Company Ltd and Hero Honda Motors Ltd. However, in case of Tata Motors Ltd, Bajaj Auto Ltd, Maharashtra Scooters Ltd and TVS Motor Company Ltd, an adverse relationship is noticed. The table further reveals that there exists below moderate degree but positive correlation in ten out of seventeen companies as regards EVA and ROCE. The degrees of negative correlation observed between EVA and ROCE in Tata Motors Ltd, Mahindra and Mahindra Ltd, Maharashtra Scooters Ltd, TVS Motor Company Ltd and Hero Honda Motors Ltd. It is noticed that the degree of correlation is superior and positive in Kinetic Motor Company Ltd but significant at 1 per cent level. Further, there exists low degree of positive correlation (8 out of 17) and low degree of negative correlation (6 out of 17) between EVA and EPS over the study period. The correlation between EVA and EPS is found at above moderate level only in case of Kinetic Engineering Ltd, Hero Honda Motors Ltd and Scooters India Ltd, with 1 per cent and 5 per cent level of significance.
The relationship between EVA and MP shows that insignificant below moderate level of relationship was found in all the selected companies. Similarly, the correlation between EVA and MVA is though negative in twelve out of seventeen companies, the strength is below moderate level / low in all the companies except LML Ltd during the study period but significant at 5 per cent level. Hence, it is concluded that there exists significant positive relationship between EVA with Sales, ROS, ROTA, ROCE and EPS in the case of Kinetic Motor Company Ltd. Further, EVA is significantly associated with ROS in
29
case of Swaraj Mazda Ltd, with MVA in LML Ltd (but negative), with ROTA in TVS Motor Company Ltd, with ROTA and EPS in Hero Honda Motors Ltd, with ROS and EPS in Kinetic Engineering Ltd and with sales (negative) and EPS in Scooters India Ltd during the study period.
5.5. Factor Analysis
Eight functional parameters which signify the wealth maximisation of shareholders have been considered for the study viz., Earnings Per Share (EPS), Sales (S), Profit After Tax (PAT), Market Price (MP), Market Value Added (MVA), Return on Sales (ROS), Return on Total Assets (RTA) and Return on Capital Employed (ROCE). In order to disclose which among these factors contribute much towards shareholders wealth maximisation, factor analysis has been done. Factor analysis is a multivariate statistical technique used to condense and simplify. This technique is helpful to identify the underlying factors that determine the relationship between the observed variables and provides an empirical classification scheme of clustering of statements into groups called factors. It is often used in data reduction to identify a small number of factors that explain most of the variance observed in a much larger number of manifest variables.
To test the acceptability of data, the following steps were taken. The correlation matrices were computed. It revealed that there is enough correlation to go ahead for factor analysis. Kaiser-Meyer-Olkin measure of sampling adequacy (KMO) and Bartlett’s test of sphericity have been applied, to the resultant correlation matrix to test whether the relationship among the variables has been significant or not. A KMO measure which is more than 0.6 is considered ‘mediocre’ and is acceptable. A measure <0.5 is not acceptable. The overall significance of correlation matrices is tested with Bartlett’s Test of Sphericity providing support for the validity of the factor analysis of the data set. It also tests whether the correlation matrix is an identity matrix (factor analysis would be meaningless with an identity matrix). A significance value <0.05 indicates that these data do not produce an identity matrix and are thus approximately multivariate normal and acceptable for factor analysis.
Communalities represent the proportion of the variance explained by the component or factor. This is similar to the R2 in regression analysis. The higher the loading, the more important is the factor. However, Comrey (1973) suggested that anything above 0.44 could be considered salient, with increased loading becoming more vital in determining the factor. After the standards indicated that the data are suitable for factor analysis, Principal Component Analysis is employed for extracting the data, which allowed determining the factor underlying the relationship between a numbers of variables. Rotation is necessary when extraction technique suggests that there are two or more factors. The rotation of factors is designed to give an idea of how the factors initially extracted differ from each other and to provide a clear picture of which items loads on which factor. An orthogonal rotation is performed using Varimax with Kaiser Normalisation. Factor analysis has been done in the present part of analysis for the Indian automobile industry as a whole and for the entire three sectors.
5.5.1. Whole Industry
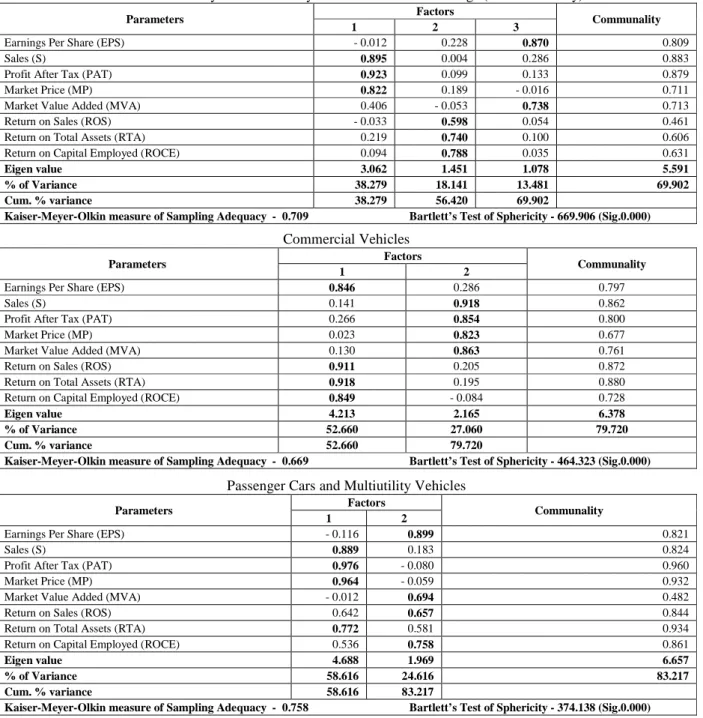
Table 6 demonstrates that the principal component analysis and rotated factor loading method is used for stimulating factor for whole Indian automobile industry. The result of the test shows that with the significant value of 0.000 there is significant relationship among the variable chosen. KMO test yields a result of 0.709 which state that factor analysis can be carried out appropriately for the eight variables that are taken for the study. Table 6 gives the rotated factor loadings, communalities, eigen values and the percentage of variance explained by the factors. Out of the eight variables, three factors have been
30
extracted and these three factors put together explain the total variance of these factors to the extent of 69.902 per cent and total Eigen value of the factors is 5.591. The communalities vary from 46 per cent to 88 per cent suggesting that the extracted factors are sufficient to account for most of the variations existing in the data. This inference is confirmed by the total variation explained by the analysis, which is 69.902 per cent.
The varimax rotation results are also given in the Table 6. The three factors were identified as it accounted the maximum percentage variance. The three variables such as sales, profit after tax and market price were grouped together as Factor I and accounts for 38.28 per cent of the total variance. The perusal of factor loadings on Factor I reveals that this factor has clearly brought together different variables relating to wealth maximisation of the enterprises. Factor II explains 18.14 per cent of the total variations in the variable sets. The significant loadings on this factor are return on sales, return on total assets and return on capital employed. An examination of the factor loading reveals that significant loadings on this factor include the elements relating to firm’s internal performances. The variables Earnings Per Share and Market Value Added are constituted as factor III and accounted for 13.48 per cent. Thus, the factor analysis condensed and simplified the 8 variables and grouped them into 3 factors explaining 69.90 per cent. Sales and Profit After Tax are found to have a stronger relationship.
5.5.2. Commercial Vehicles
Using all the eight variables, factor analysis was performed for commercial vehicles sector and the results are presented in Table 7. Table 7 gives the rotated factor loadings, communalities, eigen values and the percentage of variance explained by the factors. The results of Bartlett’s Test (sig.0.000) and KMO test (0.669) shows that factor analysis can be carried out appropriately for these eight variables that are taken for the study. From the table, it is observed that out of eight variables, two factors are identified by the rotation method. The total percentage of variation in the factors show 79.720 per cent and total Eigen value of the factors is 6.378. Table 113 also depicts that clustering of stimulating wealth maximization. Two factors were identified which accounted for the maximum percentage variance. The four variables viz., Earnings per share Return on sales, Return on total assets and Return on capital employed were grouped together as Factor I and accounted for 52.66 per cent of the total variance. The remaining four variables viz., Sales, Profit after tax, Market Price and Market Value Added are constituted as factor II and accounted for 27.06 percent of the total variance. The communalities vary from 68 per cent to 88 per cent suggesting that the extracted factors are sufficient to account for most of the variations existing in the data. Return on total assets, Return on sales and sales are found to have a stronger relationship.
5.5.3. Passenger Cars and Multiutility Vehicles
Table 8 gives the rotated factor loadings, communalities, eigen values and the percentage of variance explained by the factors for passenger cars and multiutility vehicles sector of Indian automobile industry. The KMO test (0.758) and Bartlett’s Test of Sphericity (Sig.0.000) states that factor analysis can be carried out appropriately for these eight variables that are taken for the study. Out of the eight variables, two factors have been extracted and these two factors put together explain the total variance of these variables to the extent of 83.217 per cent. In order to reduce the number of factors and enhance the interpretability, the factors were rotated. The results of varimax rotation are also presented in Table 8. Two factors were identified which accounted for the maximum percentage variance. Factor I explains 58.616 per cent of the total variance with eigen value of 4.688. The significant loadings on this factor are sales, profit after tax, market price and return on total assets. The remaining four variables Earnings Per Share, Market Value Added, Return on Sales and Return on Capital Employed constituted the Factor II and accounted for 24.616 per cent of the total variance with eigen value of 1.969. The high value of communality ranging 48
31
per cent to 96 per cent suggesting that the extracted factors are sufficient to account for most of the variations existing in the data and this is confirmed by the total variation explained by the analysis, which is 83.217 per cent. Profit After Tax, Market Price and Earnings Per Share are found to have stronger relationship.
5.5.4. Two and Three wheelers
Table 9 demonstrates that principal component analysis and rotated factor loading method is used for stimulating factors for the two and three wheelers sector of the Indian automobile industry. From the table, it is observed that out of eight variables, three factors are identified by the rotation method. The total percentages of variation in the factors show 68. 513 per cent and total eigen value of the factors is 5.481. The results of KMO test (0.638) and Bartlett’s Test of Sphericity (sig.0.000) confirms that factor analysis can be carried out appropriately for the variables selected for the study. The varimax rotation results are also given in the Table 9 From the table, it is observed that three factors were identified as being maximum per cent variance accounted. The three variables viz., Sales, Profit after tax and Market price were cluster together as Factor I and accounts 38. 398 per cent of the total variance. Variables return on sales, return on total assets and return on capital employed are constituted as Factor II and accounts 16.847 per cent of the total variance. Variables Earnings Per Share and Market Value Added constituted as Factor III and accounts 13.267 per cent of the total variance. The high communality values (49 per cent to 89 per cent) suggesting that extracted factors are sufficient to account for most of the variations existing in the data. Stronger relationships between variables are noticed with regard to Sales, Market Value Added and Market Price.
6. Conclusion
The results of the study showed that 53 per cent to 76 per cent of the sample companies have registered negative EVA during the terminal years of the study period. The top five companies in generating EVA include Bajaj Auto Ltd, Hero Honda Motors Ltd(two and three wheelers sector), Mahindra and Mahindra Ltd (passenger cars and multiutility vehicles sector), Ashok Leyland Ltd and Tata Motors Ltd(commercial vehicles sector). Below moderate level relationship was found during the study period with regard to EVA with the selected financial variables. The results of factor analysis showed that out of the eight variables, three factors have been extracted and these three factors put together explain 69.902 per cent of the total variance. Further, the results showed that sales and profit after tax are found to have a stronger relationship with EVA.
References
Bacidore, J.M., Boquist, J.A., Milboum, T.T., and Thakor, A.V. (1997). "The search for the vest financial performance measure". Financial Analysis Journal, Vol. 53(3), pp. 11-20.
Banerjee, Ashok (2000). "Linkage between Economic value added and market value: An analysis",
Vikalpa, Vol. 25(3), pp. 23 -36.
Bao, B.H., and Bao, D.H. (1999). "The Association between Firm value and Economic Value Added",
Indian Accounting Review, Vol. 3(2), pp.161 -64.
Comrey, A.L. (1973). "A First Course in Factor Analysis", New York : Academic Press.
Grant, J. (1996). "Foundation of EVA for Investment Management; Just in Time, EVA", Journal of
Financial Management. Vol. 23(1), pp. 41 - 45.
KPMG-BS (1998). "Corporate India: An Economic value scoreboard". The Strategy. PP.22-25. Luber, R.B. (1996). "Who are the real wealth creators", Fortune, pp. 2 -3.
32
Mangala, Deepa and Joura Simpy (2002). "Linkage between economic value added and market value: An analysis in Indian context", Indian Management Studies Journal, pp. 55-65.
Manor Selvi, A. and Vijayakumar, A. (2007). "Performance of Indian Automobile Industry: Economic Value Added Approach", Management and Labour Studies, Vol. 32(4), pp. 451 - 467.
Stem Stewart (1990). "One way to build value in your firm. Executive compensation", Financial
executive, pp. 51 -54.
Vijayakumar, A. (2008). "Linkage between Market Value Added (MVA) and other Financial variables: An analysis in Indian Automobile Industry", Management and Labour Studies, Vol. 33(4), pp. 504-521.
Vijayakumar, A. (2010). "Economic Value Added (EVA) and Market Value Added (MVA)-An empirical study of relationship". College Sadhana, Vol. 2(2), pp.141-148.
Dr.A.Vijayakumar is a Associate Professor in the Faculty of Commerce, Erode Arts and Science College, Erode. He Obtained his B.Com Degree in 1984 from Madras University, M.Com Degree in 1986, M.Phil Degree in 1990 and Ph.D Degree in 1997 from Bharathiar University. He has also completed PGDCA from Bharathiar University in 2003. He has completed 25 years of teaching. He has been guiding 50 M.Phil’s and 7 Ph.D’s during his service so far. He has published 20 research articles in international journals and 100 research articles in national level journals. He has published more than 20 books in the field of commerce and management.
Table 1. EVA – Frequency Distribution of Sample Companies (1996-97 to 2008-09)
EVA 9 6 -9 7 9 7 -9 8 9 8 -9 9 9 9 -0 0 0 0 -0 1 0 1 -0 2 0 2 -0 3 0 3 -0 4 0 4 -0 5 0 5 -0 6 0 6 -0 7 0 7 -0 8 0 8 -0 9 Negative (29.4) 5 (5.9) 1 (58.8) 10 (5.9) 1 (11.8) 2 (5.9) 1 (52.9) 9 (23.5) 4 (58.8) 10 (76.4) 13 (47.0) 8 (23.5) 4 (47.0) 8 Up to Rs.50 Cr 6 (35.3) 7 (41.1) 5 (29.4) 6 (35.3) 8 (47.0) 8 (47.0) 3 (17.6) 6 (35.3) 3 (17.6) 1 (5.9) 3 (17.6) 3 (17.6) 2 (11.8) Rs.50 Cr to Rs.100 Cr – 1 (5.9) – 1 (5.9) – 1 (5.9) 1 (5.9) 1 (5.9) 2 (11.8) – 1 (5.9) 2 (11.8) 1 (5.9) Rs.100 Cr to Rs.200 Cr 2 (11.8) 2 (11.8) 1 (5.9) 1 (5.9) 2 (11.8) 1 (5.9) 2 (11.8) 2 (11.8) – 2 (11.8) 2 (11.8) 1 (5.9) – Above Rs.200 Cr 4 (23.5) 6 (35.3) 1 (5.9) 8 (47.0) 5 (29.4) 6 (35.3) 2 (11.8) 4 (23.5) 2 (11.8) 1 (5.9) 3 (17.6) 7 (41.1) 6 (35.3) Total (100) 17 (100) 17 (100) 17 (100) 17 (100) 17 (100) 17 (100) 17 (100) 17 (100) 17 (100) 17 (100) 17 (100) 17 (100) 17
33
Table 2. Trends in EVA (Year--wise)
Company 9 6 -9 7 9 7 -9 8 9 8 -9 9 9 9 -0 0 0 0 -0 1 0 1 -0 2 0 2 -0 3 0 3 -0 4 0 4 -0 5 0 5 -0 6 0 6 -0 7 0 7 -0 8 0 8 -0 9 Ashok Leyland Ltd 3 6 2 8 4 6 4 4 16 16 2 2 6 Tata Motors Ltd 1 1 17 1 6 10 16 3 2 17 17 6 3 Bajaj Tempo Ltd 15 13 12 17 16 16 6 11 13 11 6 9 8 Eicher Motors Ltd 10 16 5 13 9 13 8 8 11 3 11 8 16 Swaraj Mazda Ltd 11 14 4 16 11 14 7 12 6 5 10 11 14 Hindustan Motors Ltd 7 7 13 9 14 8 14 17 3 12 13 10 13 Mahindra and Mahindra Ltd 6 4 14 4 3 5 13 5 4 2 3 3 1 Maruti Udyog Ltd 2 2 16 3 17 2 17 9 17 15 5 1 17
Bajaj Auto Ltd 4 3 15 2 1 1 1 7 8 6 12 5 4
LML Ltd 5 5 1 5 2 4 2 2 15 13 9 17 7
Maharashtra Scooters Ltd 14 10 11 10 12 11 3 10 7 4 7 12 9 TVS Motor Company Ltd 8 8 6 7 7 7 15 6 14 14 4 7 5 Kinetic Motor Company Ltd 13 15 9 12 10 9 10 15 12 10 16 16 15 Hero Honda Motors Ltd 9 9 3 6 5 3 11 1 1 1 1 4 2 Kinetic Engineering Ltd 12 11 8 11 8 12 12 16 5 8 8 15 12 Majestic Auto Ltd 17 17 10 14 13 17 9 13 9 7 14 13 11 Scooters India Ltd 16 12 7 15 15 15 5 14 10 9 15 14 10
34
Table 3. Company -wise statistical analysis of EVA
Company Mean SD CV CAGR Variance Skewness Kurtosis Max. Min. Ashok Leyland Ltd 268.82 418.77 1.56 0.84 175367.50 2.22 7.23 1508.58 -248.60 Tata Motors Ltd 175.30 937.62 5.35 6.39 879136.10 -0.59 1.55 1888.03 -1937.03 Bajaj Tempo Ltd 5.40 44.46 8.23 11.95 1976.64 0.10 -0.67 77.82 -57.77 Eicher Motors Ltd 4.31 111.29 25.82 24.89 12385.71 -2.08 6.97 164.59 -321.69 Swaraj Mazda Ltd 3.87 27.68 7.15 14.47 766.43 -2.16 7.52 47.35 -78.08 Hindustan Motors Ltd 11.14 87.78 7.88 4.06 7706.02 -0.33 -0.17 138.27 -167.24 Mahindra and Mahindra Ltd 412.04 511.67 1.24 23.94 261809.40 1.12 0.38 1494.67 -178.50 Maruti Udyog Ltd -34.63 1635.34 -47.22 23.61 2674321 -0.34 1.40 3210.54 -3174.69 Bajaj Auto Ltd 516.17 702.76 1.36 10.24 493873.40 1.27 1.91 2223.75 -425.16 LML Ltd 174.89 224.62 1.28 -5.15 50454.24 -0.43 -1.33 462.71 -165.39 Maharashtra Scooters Ltd 23.52 39.88 1.70 -4.95 1590.17 2.06 5.33 135.48 -28.90 TVS Motor Company Ltd 83.35 179.43 2.15 18.70 32196.19 -0.64 0.43 341.95 -304.01 Kinetic Motor Company Ltd -23.12 40.88 -1.77 33.00 1671.43 -0.36 -1.01 28.47 -95.70 Hero Honda Motors Ltd 475.80 396.09 0.83 32.03 156884 0.18 -1.60 1060.65 -34.30 Kinetic Engineering Ltd -2.34 29.87 -12.76 5.80 892.31 -0.49 -1.06 36.60 -55.50 Majestic Auto Ltd -5.70 12.38 -2.17 -9.55 153.26 -0.06 -0.77 14.78 -27.78 Scooters India Ltd -0.97 33.43 -34.46 51.12 1117.24 1.98 6.03 94.98 -46.36 Source : Computed
Table 4. EVA with selected Financial variables (whole sample) – Kendall’s tau b
Company Sales ROS ROTA ROCM EPS MP MVA
Ashok Leyland Ltd 0.103 0.000 0.103 0.000 -0.077 -0.179 -0.128 Tata Motors Ltd 0.000 -0.090 -0.103 -0.128 -0.039 -0.077 -0.026 Bajaj Tempo Ltd 0.256 0.179 0.205 0.256 0.142 -0.256 -0.205 Eicher Motors Ltd 0.179 0.179 0.000 0.179 0.103 0.065 -0.206 Swaraj Mazda Ltd 0.026 0.436* 0.359 0.308 0.333 -0.154 0.206 Hindustan Motors Ltd 0.410 0.231 0.128 0.179 0.116 0.090 -0.385 Mahindra and Mahindra Ltd 0.282 -0.051 0.000 -0.103 0.179 0.179 0.051 Maruti Udyog Ltd -0.103 0.245 0.179 0.179 0.333 - 0.128 Bajaj Auto Ltd -0.205 0.154 -0.154 0.000 -0.256 -0.333 0.065
LML Ltd 0.333 0.103 0.308 0.359 0.256 0.128 -0.513*
Maharashtra Scooters Ltd 0.000 -0.231 -0.231 -0.205 -0.231 -0.103 0.282 TVS Motor Company Ltd 0.179 -0.245 -0.462* -0.410 -0.308 -0.385 -0.154 Kinetic Motor Company Ltd 0.718** 0.821** 0.727** 0.818** 0.718** 0.385 -0.256 Hero Honda Motors Ltd 0.641** 0.000 0.503* -0.026 0.564** 0.385 -0.410 Kinetic Engineering Ltd 0.333 0.487* 0.154 0.282 0.452* -0.051 -0.128 Majestic Auto Ltd 0.179 0.179 0.179 0.103 -0.077 -0.333 -0.282 Scooters India Ltd -0.462* 0.385 0.256 0.308 0.538* -0.333 -0.410 ** - Significant at 0.01 level; * - Significant at 0.05 level; Source : Computed.
35
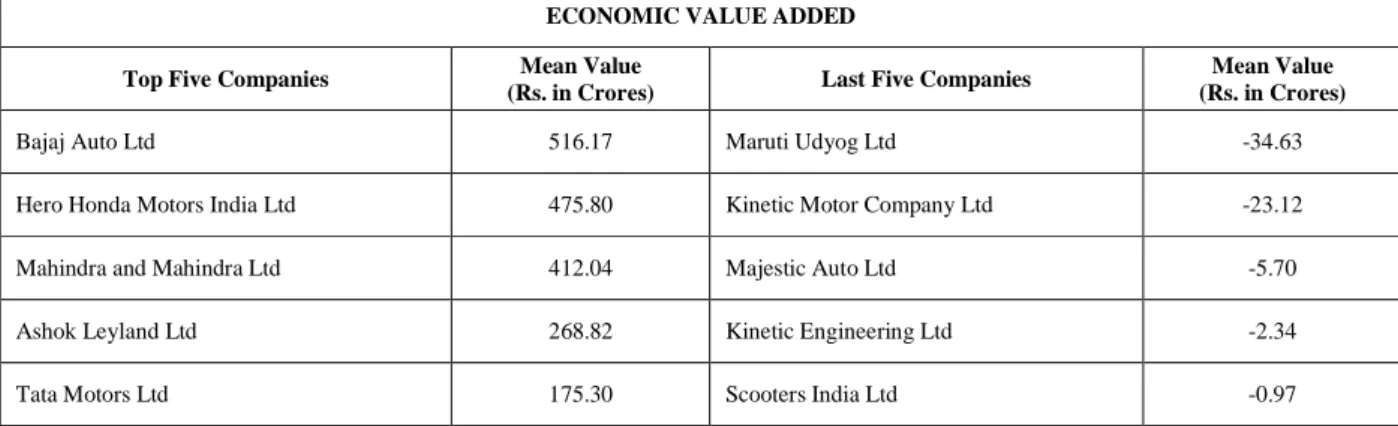
Table 5. Ranking based on thirteen years average of EVA
ECONOMIC VALUE ADDED
Top Five Companies Mean Value
(Rs. in Crores) Last Five Companies
Mean Value (Rs. in Crores)
Bajaj Auto Ltd 516.17 Maruti Udyog Ltd -34.63
Hero Honda Motors India Ltd 475.80 Kinetic Motor Company Ltd -23.12
Mahindra and Mahindra Ltd 412.04 Majestic Auto Ltd -5.70
Ashok Leyland Ltd 268.82 Kinetic Engineering Ltd -2.34
36
Table 6. Summary of Factor Analysis – Rotated factor loadings (Whole Industry)
Parameters Factors Communality
1 2 3
Earnings Per Share (EPS) - 0.012 0.228 0.870 0.809
Sales (S) 0.895 0.004 0.286 0.883
Profit After Tax (PAT) 0.923 0.099 0.133 0.879
Market Price (MP) 0.822 0.189 - 0.016 0.711
Market Value Added (MVA) 0.406 - 0.053 0.738 0.713
Return on Sales (ROS) - 0.033 0.598 0.054 0.461
Return on Total Assets (RTA) 0.219 0.740 0.100 0.606
Return on Capital Employed (ROCE) 0.094 0.788 0.035 0.631
Eigen value 3.062 1.451 1.078 5.591
% of Variance 38.279 18.141 13.481 69.902
Cum. % variance 38.279 56.420 69.902
Kaiser-Meyer-Olkin measure of Sampling Adequacy - 0.709 Bartlett’s Test of Sphericity - 669.906 (Sig.0.000)
Commercial Vehicles
Parameters Factors Communality
1 2
Earnings Per Share (EPS) 0.846 0.286 0.797
Sales (S) 0.141 0.918 0.862
Profit After Tax (PAT) 0.266 0.854 0.800
Market Price (MP) 0.023 0.823 0.677
Market Value Added (MVA) 0.130 0.863 0.761
Return on Sales (ROS) 0.911 0.205 0.872
Return on Total Assets (RTA) 0.918 0.195 0.880
Return on Capital Employed (ROCE) 0.849 - 0.084 0.728
Eigen value 4.213 2.165 6.378
% of Variance 52.660 27.060 79.720
Cum. % variance 52.660 79.720
Kaiser-Meyer-Olkin measure of Sampling Adequacy - 0.669 Bartlett’s Test of Sphericity - 464.323 (Sig.0.000)
Passenger Cars and Multiutility Vehicles
Parameters Factors Communality
1 2
Earnings Per Share (EPS) - 0.116 0.899 0.821
Sales (S) 0.889 0.183 0.824
Profit After Tax (PAT) 0.976 - 0.080 0.960
Market Price (MP) 0.964 - 0.059 0.932
Market Value Added (MVA) - 0.012 0.694 0.482
Return on Sales (ROS) 0.642 0.657 0.844
Return on Total Assets (RTA) 0.772 0.581 0.934
Return on Capital Employed (ROCE) 0.536 0.758 0.861
Eigen value 4.688 1.969 6.657
% of Variance 58.616 24.616 83.217
Cum. % variance 58.616 83.217
37
Two and Three wheelers
Parameters Factors Communality
1 2 3
Earnings Per Share (EPS) 0.314 0.367 0.512 0.496
Sales (S) 0.946 0.027 0.005 0.896
Profit After Tax (PAT) 0.819 0.142 0.425 0.871
Market Price (MP) 0.842 0.168 - 0.014 0.737
Market Value Added (MVA) - 0.016 0.002 0.938 0.880
Return on Sales (ROS) - 0.055 0.707 - 0.048 0.505
Return on Total Assets (RTA) 0.257 0.648 0.206 0.529 Return on Capital Employed (ROCE) 0.126 0.736 0.095 0.566
Eigen value 3.072 1.348 1.061 5.481
% of Variance 38.398 16.847 13.267 68.513
Cum. % variance 38.398 55.246 68.513
Kaiser-Meyer-Olkin measure of Sampling Adequacy - 0.638 Bartlett’s Test of Sphericity - 337.060 (Sig.0.000)
Extraction Method : Principal Component Analysis Rotation Method : Varimax with Kaiser Normalization Source: Compiled from Annual Reports.