Alcohol Intake and Sickness Absence: A Curvilinear Relation
Jussi Vahtera1, Kari Poikolainen2, Mika Kivimäki3, Leena Ala-Mursula4, and Jaana Pentti1
1 Finnish Institute of Occupational Health, Turku, Finland. 2 Finnish Foundation for Alcohol Studies, Helsinki, Finland.
3 Department of Psychology, Division of Applied Psychology, University of Helsinki, Helsinki, Finland. 4 Development and Service Center of Occupational Health, City of Oulu, Oulu, Finland.
Received for publication December 3, 2001; accepted for publication June 21, 2002.
Little is known about the U-shaped relation between alcohol intake and health beyond findings related to cardiovascular disease. Medically certified sickness absence is a health indicator in which coronary heart disease is only a minor factor. To investigate the relation between alcohol intake and sickness absence, records regarding medically certified sick leaves from all causes were assessed for 4 years (1997–2000) in a cohort of 1,490 male and 4,952 female municipal employees in Finland. Hierarchical Poisson regression, adjusted for self-reported behavioral and biologic risk factors, psychosocial risk factors, and cardiovascular diseases, was used to estimate the rate ratios and their 95% confidence intervals, relating sickness absence to each level of alcohol consumption. For both men and women, a significant curvilinear trend was found between level of average weekly alcohol consumption and sickness absence. The rates of medically certified sickness absence were 1.2-fold higher (95% confidence interval: 1.1, 1.3) for never, former, and heavy drinkers compared with light drinkers. The U-shaped relation between alcohol intake and health is not likely to be explained by confounding due to psychosocial differences or inclusion of former drinkers in the nondrinkers category. Moderate alcohol consumption also may reduce health problems other than cardiovascular disease.
behavior; cardiovascular diseases; health; personality; sick leave; social support
Abbreviation: CI, confidence interval.
Curvilinear, U- or J-shaped relations have been found between alcohol intake and mortality. Typically, abstainers have slightly higher mortality than moderate drinkers, while heavy drinkers have a much higher mortality rate than the former two groups (1). Curvilinearity is almost exclusively due to the decreased death rate from coronary heart disease among drinkers. No clear pattern was discovered in earlier studies on the relation between alcohol intake and other health outcomes, such as sickness absence (2, 3). Sickness absence is important as an indicator of ill health as well as a measure of the use of health services (4). In the United States, the total number of days lost because of sickness absence is estimated to represent 3–7 percent of regularly scheduled workdays (5), signifying a loss of approximately 550 million workdays each year (6). Because coronary heart disease remains a minor factor in sickness absence (7, 8), a
linear, rather than curvilinear, association might be expected between alcohol intake and sickness absence.
We studied the association between alcohol intake and medically certified sickness absence in a large employee cohort. We sought to control for psychosocial factors along with demographic and lifestyle factors since such factors have been suspected to explain why moderate drinkers have better health than abstainers (9) and research points to the potential importance of these factors. Poor social networks, lack of social interaction, and hostility have been demon-strated to be associated with sickness absence and mortality (10, 11). In nondrinkers and heavy drinkers, levels of hostility, mental distress, and anxiety are known to be higher and social support lower than in moderate drinkers (12). We also studied the potential confounding role of former drinkers in the relation between alcohol intake and health.
Correspondence to Dr. Jussi Vahtera, Finnish Institute of Occupational Health, Hämeenkatu 10, FIN-20500 Turku, Finland (e-mail: [email protected]).
Many health problems not only cause sickness absence but may also require persons to give up drinking.
MATERIALS AND METHODS Participants
Data were drawn from the 10 Town Study, an ongoing cohort study exploring the relations between behavioral and psychosocial factors and health in persons from 10 Finnish municipalities(13). In 1997, 6,442 identifiable, full-time, permanent municipal workers (1,490 men and 4,952 women) agreed to participate in the study and responded to a questionnaire inquiring about alcohol intake, health risk behaviors, cardiovascular risk factors or diseases, social support, psychological traits, and self-reported health; the response rate was 67 percent. The sample did not differ from the eligible population—all 24,351 permanent, full-time municipal employees in the towns—in terms of age (mean age of respondents, 46.1 years for men and 44.8 years for women; the corresponding ages of the eligible population were 45.3 years and 45.0 years). The proportion of men (23 percent) and the rate of medically certified sickness absence (per 100 person-years, 61.2 for men and 84.2 for women) were slightly lower in the sample than in the eligible popula-tion (28 percent men; absence rate per 100 person-years, 70.4 for men and 89.1 for women). The study was approved by the Ethics Committee of the Finnish Institute of Occupa-tional Health.
Measures
The subjects reported their habitual frequency and amount of beer, wine, and spirits intake. This information was trans-formed into grams of alcohol per week (14, 15). One unit of pure alcohol (12 g) was equal to a 12-cl glass of wine, a single 4-cl measure of spirits, or a 33-cl bottle of beer. Subjects who reported no alcohol intake (nondrinkers) were divided into former drinkers (if they had ever in their lifetime consumed at least one unit of alcohol) and lifelong abstainers (16). We classified respondents into six categories based on their weekly alcohol intake (never drinkers, former drinkers, 1–50 g, 51–100 g, 101–275 g, and >275 g) (3, 17).
Information relating to all medically certified (>3 days) sickness absences was derived from employers’ records from January 1, 1997, to December 31, 2000 (8). These records do not contain any diagnostic information. The mean length of follow-up was 3.5 (standard deviation, 0.9) years, altogether 22,271 person-years. The sickness absence records were checked for inconsistencies. Overlapping or consecutive spells of sickness absence were combined. Employers participating in the 10 Town Study record each sick-leave period of every employee, including the dates on which each spell started and ended. In accordance with regu-lations, each sick-leave certificate must be forwarded for recording. In Finland, municipal employers receive statutory compensation from the Finnish Social Insurance Institution for loss of salary due to sick leave. To receive the full compensation to which employers are entitled, they are obli-gated to keep precise records of sick leaves. Employees
receive their full salary during sick leave periods beginning on the first day, and medical certificates are always required for sick leaves of more than 3 days, a focus of this study.
Covariates were measured in standard ways. Information on the age at which the respondent started smoking and quit smoking, as well as the number of cigarettes smoked per day, was used to measure pack-years (number of years of smoking × number of cigarettes smoked per day/20). Seden-tary lifestyle was indicated by leisure-time physical activity corresponding to less than half an hour of fast walking per week (18). Self-reported weight and height were used to calculate body mass index (kg/m2) and short stature (<170
cm for men and <160 cm for women). Cardiovascular risk factors and diseases were measured by breathlessness (yes or no) (19) and by self-reported myocardial infarction, angina, cerebrovascular disease, hypertension, diabetes, and high serum cholesterol level, information derived from a checklist of 18 common chronic diseases or conditions diagnosed by a physician(20).
Social network was measured by using the Brief Social Support Questionnaire (21) (six items; range, 1–5) and work-related social support by using a standard survey instrument of Statistics Finland (22). The latter measures social support received from the supervisor (seven items; Cronbach’s alpha = 0.91; range, 1–5) as well as from work-mates (10 items; Cronbach’s alpha = 0.91; range, 1–5). The following psychological traits and states were assessed: opti-mism (23) (six items; Cronbach’s alpha = 0.73; range, 1–4); sense of coherence (24) (13 items; Cronbach’s alpha = 0.82; range, 1–13); hostility (20) (three items; Cronbach’s alpha = 0.77; range, 1–7); trait anxiety (25) (six items; Cronbach’s alpha = 0.84; range, 1–4); and psychological distress (26) (12 items; Cronbach’s alpha = 0.89; range, 1–4).
Other predictors of health were age, marital status (single vs. cohabiting), and income. We used employers’ records to obtain data on a participant’s occupational title, coded in 797 Statistics Finland categories. Average monthly income figures, itemized separately for women and men by occupa-tional title, were received from Statistics Finland (i.e., offi-cial Finnish government statistics).
Statistical analyses
Analysis of variance was used to study the associations of continuous variables with level of alcohol consumption; logistic regression was used to analyze the associations of dichotomous variables (marital status, sedentary lifestyle, and short stature) with level of alcohol consumption. All analyses were adjusted for age and income.
Poisson regression models were used to calculate the rate of sickness absences per 100 person-years and the corresponding rate ratios and their 95 percent confidence intervals by level of alcohol consumption, as in our earlier studies (8, 15). We calculated the number of periods of sick leave and the follow-up period in person-years for each employee. In Poisson regression models, sickness absence was first adjusted for demographics. Additional adjustments were made for those behavioral and biologic risk factors, psychosocial risk factors, and cardiovascular diseases significantly associated with alcohol consumption. Use of the Poisson model implies that
the between-employee variance in the rates of sick leave equals the expected rate of sick leave. In this study, the disper-sion in medically certified sick leaves did not significantly deviate from the assumptions used for Poisson models.
Next, we studied whether the associations of average level of alcohol consumption depended on beverage type (wine, beer, or spirits) by assessing the independent effects of each type of drink on sickness absence. Finally, the tests for curvi-linear trend were performed by adding a quadratic term for alcohol consumption to the models (27). Curvilinearity was tested before and after excluding former drinkers from the nondrinkers category.
The SAS software package (SAS Institute, Inc., Cary, North Carolina) was used to perform all analyses. Poisson regression models were calculated by using the SAS GENMOD procedure.
RESULTS
Of the men in our study, 1.4 percent were never drinkers, 5.5 percent were former drinkers, and 13 percent were heavy
drinkers who consumed more than 275 g of alcohol a week. The corresponding figures for women were 3.0 percent, 14.4 percent, and 1.8 percent. Table 1 shows that, compared with light-drinking men (51–100 g alcohol per week), male never and former drinkers were older and had lower incomes, and former drinkers were more psychologically distressed. Heavy-drinking men had higher levels of distress, a higher body mass index, and breathlessness more often, and they smoked more. Heavy drinking was also associated with having one or more of the following health problems: hyper-tension, increased serum cholesterol levels, or cardiovas-cular diseases (p = 0.03).
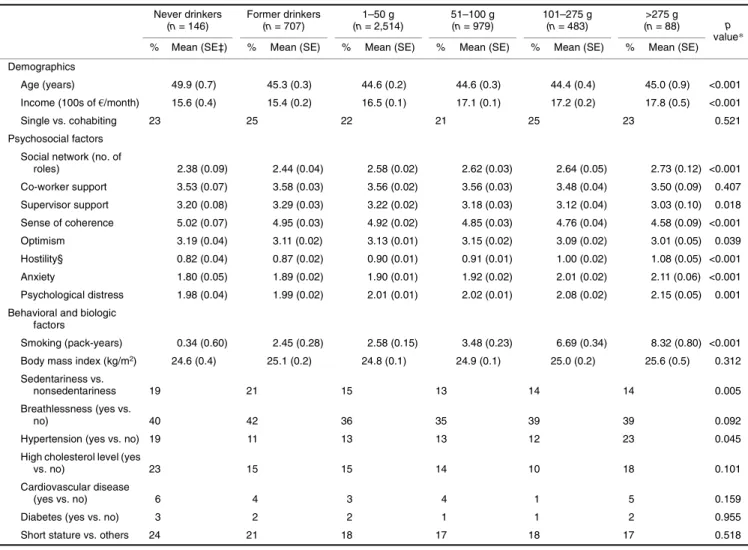
For women, the findings were similar to those for men regarding the associations of alcohol intake with age, income, and smoking (table 2). Compared with light-drinking women, female never and former drinkers had smaller social networks and a more sedentary lifestyle, and heavy drinkers had lower levels of supervisory support, a weaker sense of coherence, less optimism, and higher levels of hostility, anxiety, and psychological distress; hyperten-sion was also more frequent.
TABLE 1. Mean scores* (standard errors) or percentages of demographic, psychosocial, and behavioral and biologic factors, by level of average alcohol consumption† in men, 10 Town Study, Finland, 1997–2000
* Age- and income-adjusted analysis of variance for continuous and logistic regression for dichotomous variables was used. † Grams of absolute alcohol per week.
‡ SE, standard error. § Logarithmic transformation. Never drinkers (n = 21) Former drinkers (n = 81) 1–50 g (n = 323) 51–100 g (n = 396) 101–275 g (n = 467) >275 g (n = 192) p value* % Mean (SE‡) % Mean (SE) % Mean (SE) % Mean (SE) % Mean (SE) % Mean (SE) Demographics
Age (years) 50.1 (1.8) 48.3 (1.0) 45.6 (0.5) 45.6 (0.4) 45.4 (0.4) 47.4 (0.6) <0.001 Income (100s of $/month) 20.3 (1.4) 18.0 (0.8) 20.0 (0.4) 21.0 (0.3) 20.6 (0.3) 21.3 (0.5) 0.004
Single vs. cohabiting 14 21 18 15 14 17 0.907
Psychosocial factors
Social network (no. of roles) 1.73 (0.24) 1.99 (0.13) 2.02 (0.04) 2.06 (0.06) 2.11 (0.05) 2.16 (0.08) 0.413 Co-worker support 3.54 (0.17) 3.40 (0.09) 3.41 (0.05) 3.51 (0.04) 3.31 (0.04) 3.37 (0.06) 0.020 Supervisor support 3.08 (0.20) 3.08 (0.11) 3.03 (0.05) 3.13 (0.05) 3.02 (0.04) 3.03 (0.07) 0.577 Sense of coherence 5.17 (0.18) 4.72 (0.10) 4.87 (0.05) 4.90 (0.04) 4.79 (0.04) 4.79 (0.06) 0.087 Optimism 3.23 (0.10) 3.04 (0.06) 3.05 (0.03) 3.11 (0.02) 3.05 (0.02) 3.06 (0.04) 0.295 Hostility§ 0.80 (0.10) 0.85 (0.06) 0.86 (0.03) 0.92 (0.02) 0.95 (0.02) 0.94 (0.04) 0.126 Anxiety 1.93 (0.12) 1.90 (0.06) 1.91 (0.03) 1.93 (0.03) 1.99 (0.02) 2.00 (0.04) 0.144 Psychological distress 1.92 (0.10) 2.08 (0.05) 1.97 (0.03) 1.96 (0.02) 2.05 (0.02) 2.05 (0.03) 0.017 Behavioral and biologic factors
Smoking (pack-years) 0.2 (2.7) 7.7 (1.5) 5.9 (0.7) 8.0 (0.7) 11.0 (0.6) 11.4 (1.0) <0.001 Body mass index (kg/m2) 24.9 (0.7) 25.0 (0.4) 25.8 (0.2) 26.1 (0.2) 26.0 (0.2) 26.6 (0.2) 0.008 Sedentariness vs.
nonsedentariness 10 18 15 13 17 22 0.158
Breathlessness (yes vs. no) 14 30 22 26 26 35 0.025
Hypertension (yes vs. no) 29 12 13 14 17 21 0.079
High cholesterol level (yes
vs. no) 33 22 20 22 29 33 0.063
Cardiovascular disease
(yes vs. no) 14 7 5 5 7 3 0.070
Diabetes (yes vs. no) 0 5 4 3 4 2 0.596
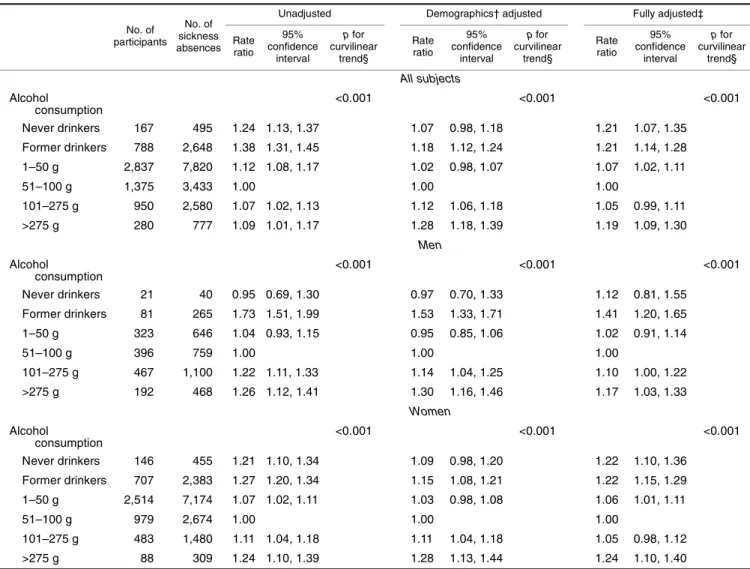
Table 3 shows that, compared with the rates for male and female light drinkers, the rates of medically certified sick-ness absences were 1.2-fold higher (95 percent confidence interval (CI): 1.1, 1.3) for never, former, and heavy drinkers after we adjusted for demographics, behavioral and biologic risk factors, psychosocial risk factors, and cardiovascular diseases. No sex differences were observed. For both men and women, there was a significant curvilinear trend between level of average weekly alcohol consumption and sickness absence, before and after we excluded former drinkers from the nondrinkers category.
As depicted in table 4, the relation between alcohol consumption and sickness absence was dependent on type of alcohol beverage. Nonconsumption of alcohol was associ-ated with increased risk of sickness absence for men and women, but only in relation to wine and beer. For spirits, nonconsumption of alcohol was associated with a decreased risk of sickness absence. After we controlled for intake of
other beverage types, demographics, behavioral and biologic risk factors, psychosocial risk factors, and cardiovascular diseases, the association of sickness absence with wine and beer was curvilinear, but with spirits it was linear for both sexes, regardless of whether former drinkers were excluded from the nondrinkers category.
To explore the role of beverage type further, we analyzed in the fully adjusted models three small subsamples consisting of those subjects who consumed no more than one of the three beverage types and nondrinkers. In relation to wine, male (n = 98) and female (n = 843) nondrinkers had 1.42-fold higher (95 percent CI: 1.06, 1.90) and 1.18-fold higher (95 percent CI: 1.11, 1.26), respectively—and, in relation to beer, male (n = 97) nondrinkers had 1.30-fold higher (95 percent CI: 1.04, 1.61)—rates of sickness absence compared with the rates for consumers of wine (35 men, 773 women) and beer (76 men). For male spirits and female beer and spirits drinkers, the corre-sponding rate ratios were nonsignificant.
TABLE 2. Mean scores* (standard errors) or percentages of demographic, psychosocial, and behavioral and biologic factors, by level of average alcohol consumption† in women, 10 Town Study, Finland, 1997–2000
* Age- and income-adjusted analysis of variance for continuous and logistic regression for dichotomous variables was used. † Grams of absolute alcohol per week.
‡ SE, standard error. § Logarithmic transformation. Never drinkers (n = 146) Former drinkers (n = 707) 1–50 g (n = 2,514) 51–100 g (n = 979) 101–275 g (n = 483) >275 g (n = 88) p value* % Mean (SE‡) % Mean (SE) % Mean (SE) % Mean (SE) % Mean (SE) % Mean (SE) Demographics
Age (years) 49.9 (0.7) 45.3 (0.3) 44.6 (0.2) 44.6 (0.3) 44.4 (0.4) 45.0 (0.9) <0.001 Income (100s of $/month) 15.6 (0.4) 15.4 (0.2) 16.5 (0.1) 17.1 (0.1) 17.2 (0.2) 17.8 (0.5) <0.001
Single vs. cohabiting 23 25 22 21 25 23 0.521
Psychosocial factors Social network (no. of
roles) 2.38 (0.09) 2.44 (0.04) 2.58 (0.02) 2.62 (0.03) 2.64 (0.05) 2.73 (0.12) <0.001 Co-worker support 3.53 (0.07) 3.58 (0.03) 3.56 (0.02) 3.56 (0.03) 3.48 (0.04) 3.50 (0.09) 0.407 Supervisor support 3.20 (0.08) 3.29 (0.03) 3.22 (0.02) 3.18 (0.03) 3.12 (0.04) 3.03 (0.10) 0.018 Sense of coherence 5.02 (0.07) 4.95 (0.03) 4.92 (0.02) 4.85 (0.03) 4.76 (0.04) 4.58 (0.09) <0.001 Optimism 3.19 (0.04) 3.11 (0.02) 3.13 (0.01) 3.15 (0.02) 3.09 (0.02) 3.01 (0.05) 0.039 Hostility§ 0.82 (0.04) 0.87 (0.02) 0.90 (0.01) 0.91 (0.01) 1.00 (0.02) 1.08 (0.05) <0.001 Anxiety 1.80 (0.05) 1.89 (0.02) 1.90 (0.01) 1.92 (0.02) 2.01 (0.02) 2.11 (0.06) <0.001 Psychological distress 1.98 (0.04) 1.99 (0.02) 2.01 (0.01) 2.02 (0.01) 2.08 (0.02) 2.15 (0.05) 0.001 Behavioral and biologic
factors
Smoking (pack-years) 0.34 (0.60) 2.45 (0.28) 2.58 (0.15) 3.48 (0.23) 6.69 (0.34) 8.32 (0.80) <0.001 Body mass index (kg/m2) 24.6 (0.4) 25.1 (0.2) 24.8 (0.1) 24.9 (0.1) 25.0 (0.2) 25.6 (0.5) 0.312 Sedentariness vs.
nonsedentariness 19 21 15 13 14 14 0.005
Breathlessness (yes vs.
no) 40 42 36 35 39 39 0.092
Hypertension (yes vs. no) 19 11 13 13 12 23 0.045
High cholesterol level (yes
vs. no) 23 15 15 14 10 18 0.101
Cardiovascular disease
(yes vs. no) 6 4 3 4 1 5 0.159
Diabetes (yes vs. no) 3 2 2 1 1 2 0.955
DISCUSSION
We found a curvilinear, U-shaped relation between alcohol intake and medically certified sickness absence for men and women. Never, former, and heavy drinkers had higher rates of sickness absence compared with light drinkers. For both sexes, curvilinearity was significant even when drinkers were compared with never drinkers instead of all nondrinkers. By type of alcohol beverage, nondrinking was associated with an increased risk of sickness absence in relation to wine and beer only.
To our knowledge, this is the first study to discover a curvilinear relation between alcohol intake and sickness absence. A previous study found that employees consuming 270 g of alcohol or more per week had a higher number of both absence spells and sickness days than those drinking less, with no adjustment made (2). Another study found that
male never drinkers and daily drinkers had more short sick-ness absence spells than those men drinking once or twice a week, after the authors adjusted for age and employment grade (3). No significant relation was revealed between average alcohol intake and absence.
Sickness absence has been considered a good measure of health in the working population when health is understood to be a combination of social, psychological, and physical functioning (4, 7, 8). Recorded sickness absence data contain information on the health problems employees face in their everyday life. Thus, the quality of such data in terms of coverage, accuracy, and consistency over time is likely to be higher than that attainable via self-reports. Since the process of recording sick leave is routine, the impact of measurement on the responses being obtained is minimized.
TABLE 3. Associations of level of average alcohol consumption* with medically certified sickness absences, expressed as rate ratios and their 95% confidence intervals, relative to light drinkers (51–100 g/week), 10 Town Study, Finland, 1997–2000
* Grams of absolute alcohol per week. † Sex, age, and income.
‡ Adjusted for demographics, behavioral and biologic risk factors, psychosocial risk factors, and cardiovascular diseases.
§ Average consumption of alcohol (grams per week; logarithmic transformation) was used in the analyses. When the nondrinkers category was restricted to lifelong abstainers, the fully adjusted test for curvilinear trend for alcohol was p = 0.01 for men and p = 0.002 for women.
No. of participants
No. of sickness absences
Unadjusted Demographics† adjusted Fully adjusted‡
Rate ratio 95% confidence interval p for curvilinear trend§ Rate ratio 95% confidence interval p for curvilinear trend§ Rate ratio 95% confidence interval p for curvilinear trend§ All subjects Alcohol consumption <0.001 <0.001 <0.001 Never drinkers 167 495 1.24 1.13, 1.37 1.07 0.98, 1.18 1.21 1.07, 1.35 Former drinkers 788 2,648 1.38 1.31, 1.45 1.18 1.12, 1.24 1.21 1.14, 1.28 1–50 g 2,837 7,820 1.12 1.08, 1.17 1.02 0.98, 1.07 1.07 1.02, 1.11 51–100 g 1,375 3,433 1.00 1.00 1.00 101–275 g 950 2,580 1.07 1.02, 1.13 1.12 1.06, 1.18 1.05 0.99, 1.11 >275 g 280 777 1.09 1.01, 1.17 1.28 1.18, 1.39 1.19 1.09, 1.30 Men Alcohol consumption <0.001 <0.001 <0.001 Never drinkers 21 40 0.95 0.69, 1.30 0.97 0.70, 1.33 1.12 0.81, 1.55 Former drinkers 81 265 1.73 1.51, 1.99 1.53 1.33, 1.71 1.41 1.20, 1.65 1–50 g 323 646 1.04 0.93, 1.15 0.95 0.85, 1.06 1.02 0.91, 1.14 51–100 g 396 759 1.00 1.00 1.00 101–275 g 467 1,100 1.22 1.11, 1.33 1.14 1.04, 1.25 1.10 1.00, 1.22 >275 g 192 468 1.26 1.12, 1.41 1.30 1.16, 1.46 1.17 1.03, 1.33 Women Alcohol consumption <0.001 <0.001 <0.001 Never drinkers 146 455 1.21 1.10, 1.34 1.09 0.98, 1.20 1.22 1.10, 1.36 Former drinkers 707 2,383 1.27 1.20, 1.34 1.15 1.08, 1.21 1.22 1.15, 1.29 1–50 g 2,514 7,174 1.07 1.02, 1.11 1.03 0.98, 1.08 1.06 1.01, 1.11 51–100 g 979 2,674 1.00 1.00 1.00 101–275 g 483 1,480 1.11 1.04, 1.18 1.11 1.04, 1.18 1.05 0.98, 1.12 >275 g 88 309 1.24 1.10, 1.39 1.28 1.13, 1.44 1.24 1.10, 1.40
The outcome measure in our study, number of sickness absences, has been shown to be more stable and less suscep-tible to error than other measures of absenteeism (28). Infec-tions, musculoskeletal disorders, and injuries have been found to account for the majority of all medically certified spells of absence in men and women, the proportion of cardiovascular causes being no more than 0.5–4 percent (7, 8). Thus, the diagnostic distribution can differ widely among patients in primary care, those in hospitals, and mortality statistics for the deceased. In spite of these differences, our finding of a curvilinear relation is by and large in line with most studies on alcohol intake, mortality, hospitalization, and hospital admissions (1, 29–31). This result is not surprising when bearing in mind that long sick leaves based on a physician’s examination reflect employees’ health fairly well and that these absences are associated with other health measures and common predictors of health, such as age and socioeconomic status (4, 8).
Although the possibility of confounding by an unknown factor can never be excluded, a major bias remains unlikely. In addition to major demographic and lifestyle factors, we also had the uncommon opportunity to control for major psychosocial factors. Moreover, we controlled for self-reported hypertension, diabetes, and high cholesterol level. Because our sample of employees had regular health exami-nations and occupational medical care, we believe these self-reports to be accurate. If some unknown health problems caused certain persons to abstain from alcohol throughout life, then the higher rate of sickness absences among never drinkers would be due to selection rather than the positive effects of moderate drinking. Such selection should operate early in life. Severe illness or mental disorder in early
child-hood might produce this effect. Because our cohort consisted of workers who had health checkups at the beginning of their career; practically no differences existed between former drinkers and lifelong abstainers in relation to demographic, behavioral, or psychosocial factors; and short stature and several major psychosocial factors were controlled for, it is implausible that such a selection would have biased the present results. Furthermore, the results were replicable after we excluded former drinkers from the nondrinkers category. Self-reported alcohol intake figures are underestimates (32). The present results may therefore have overestimated the effects of alcohol consumption on sickness absences. However, overestimation was unlikely in the comparisons between light drinkers and never drinkers.
The high rate of medically certified sickness absences among heavy drinkers may be due to a greater incidence of alcohol-induced diseases, a more severe course of these or other diseases, poorer treatment or compliance with it, or inferior functional capacity because of excessive alcohol consumption. Likewise, the higher rate of sickness absences among never drinkers and former drinkers than among light drinkers may result from a lack of the protective effects of alcohol intake. Our findings suggest that light alcohol intake reduces the incidence of not only cardiovascular disease but also other health problems.
Our finding of lower sickness absence rates among light drinkers than among abstainers might be explained by several potentially beneficial effects of moderate alcohol intake. The antiatherogenic effects of moderate alcohol intake are well known. Randomized trials have shown bene-ficial effects on lipids and hemostatic factors (17). There is some evidence for a protective effect of alcohol on infectious
TABLE 4. Rate ratios and their 95% confidence intervals for medically certified sickness absences, by average consumption of wine, beer, and spirits,* adjusted for demographics, behavioral and biologic risk factors, psychosocial risk factors, and cardiovascular diseases, 10 Town Study, Finland, 1997–2000
* Grams of absolute alcohol per week.
† When the nondrinkers category was restricted to lifelong abstainers from any type of alcohol, the test for curvilinear trend for wine was p < 0.001 for both sexes and, for beer, p = 0.004 for men and p = 0.01 for women.
‡ The test for linear trend for spirits was p = 0.01 for men and p < 0.001 for women. When the nondrinkers categories was restricted to lifelong abstainers, the corresponding p values were p = 0.02 and p < 0.001.
Average consumption (g) Men Women No. of participants Rate ratio 95% confidence interval p for curvilinear trend No. of participants Rate ratio 95% confidence interval p for curvilinear trend Wine† <0.001 <0.001 0 400 1.25 1.14, 1.37 1,504 1.18 1.14, 1.23 1–50 866 1.00 3,090 1.00 >50 181 1.15 1.02, 1.31 294 1.08 1.00, 1.17 Beer† 0.002 0.006 0 224 1.25 1.11, 1.40 2,213 1.09 1.05, 1.13 1–50 806 1.00 2,394 1.00 >50 439 1.05 0.96, 1.15 262 1.05 0.97, 1.13 Spirits‡ 0.305 0.174 0 346 0.96 0.86, 1.06 2,953 0.94 0.91, 0.98 1–50 948 1.00 1,897 1.00 >50 179 1.14 1.02, 1.28 24 1.24 1.00, 1.53
diseases. At concentrations above 15 percent, alcohol inacti-vates most vegetative organisms. Intake of beverages containing 10 percent or more alcohol has been found to reduce the risk of an oyster-borne hepatitis A infection (33). When viruses were experimentally introduced into healthy volunteers, moderate alcohol intake was found to protect nonsmokers from clinical symptoms of common cold (34). Evidence suggesting other putative mechanisms has been reviewed elsewhere (35).
The curvilinear pattern was significant with respect to wine and beer drinking; for spirits drinking, an increasing linear trend emerged. The results are similar to those observed with respect to cardiovascular mortality in a Danish cohort (36). However, a recent review of the studies on alcoholic beverage type and risk of coronary heart disease showed that the evidence in favor of wine is not consistent and that the beneficial effect is mainly due to ethyl alcohol (37). The present findings may be explained by differences in drinking patterns. Drinkers of spirits may favor hard, intoxicating drinking, while the patterns of wine and beer drinkers may be more moderate.
In conclusion, the relation between alcohol intake and recorded sickness absence, including an element of physi-cian judgment, appears curvilinear. This relation does not seem to be explained by confounding due to cardiovascular risk factors or diseases, psychosocial differences, or inclu-sion of former drinkers in the nondrinkers category. The risk of sickness absence tends to be increased by heavy drinking and decreased by moderate consumption. Furthermore, differences seem to prevail between beer, wine, and spirits drinking.
ACKNOWLEDGMENTS
This study was supported by the Finnish Work Environ-ment Foundation, the Academy of Finland (projects 44968 and 77560), The Finnish Local Government Pensions Insti-tution, and the participating towns.
REFERENCES
1. Poikolainen K. Alcohol and mortality: a review. J Clin Epide-miol 1995;48:455–65.
2. Jenkins R. Sex differences in alcohol consumption and its asso-ciated morbidity in young civil servants. Br J Addict 1986;81: 525–35.
3. Marmot MG, North F, Feeney A, et al. Alcohol consumption and sickness absence: from the Whitehall II study. Addiction 1993;88:369–82.
4. Marmot MG, Feeney A, Shipley M, et al. Sickness absence as a measure of health status and functioning: from the UK White-hall II study. J Epidemiol Community Health 1995;49:124–30. 5. Johns G. How often were you absent? A review of the use of
self-reported absence data. J Appl Psychol 1994;79:574–91. 6. Sigman A. The state of corporate health care. Personnel
Man-age 1992;February:24–31.
7. Feeney A, North F, Head J, et al. Socioeconomic and sex differ-entials in reason for sickness absence from the Whitehall II
study. Occup Environ Med 1998;55:91–8.
8. Vahtera J, Kivimäki M, Pentti J. Effect of organisational down-sizing on health of employees. Lancet 1997;350:1124–8. 9. Skog OJ. The J-curve, causality and public health. Addiction
1995;90:490–2.
10. Kawachi I, Kennedy BP. Health and social cohesion: why care about income inequality? BMJ 1997;314:1037–40.
11. Vahtera J, Kivimäki M, Uutela A, et al. Hostility and ill health: role of psychosocial resources in two contexts of working life. J Psychosom Res 2000;48:89–98.
12. Roberts R, Brunner E, Marmot M. Psychological factors in the relationship between alcohol and cardiovascular morbidity. Soc Sci Med 1995;41:1513–16.
13. Vahtera J, Kivimäki M, Pentti J. The role of extended weekends in sickness absenteeism. Occup Environ Med 2001;58:818–22. 14. Kaprio J, Koskenvuo M, Langinvainio H, et al. Genetic influ-ences on use and abuse of alcohol: a study of 5638 adult Finnish twin brothers. Alcohol Clin Exp Res 1987;11:349–56. 15. Kivimäki M, Vahtera J, Pentti J, et al. Factors underlying the
effect of organisational downsizing on health of employees: longitudinal cohort study. BMJ 2000;320:971–5.
16. Wannamethee SG, Shaper AG. Lifelong teetotallers, ex-drink-ers and drinkex-drink-ers: mortality and the incidence of major coronary heart disease events in middle-aged British men. Int J Epide-miol 1997;26:523–31.
17. Rimm EB, Williams P, Fosher K, et al. Moderate alcohol intake and lower risk of coronary heart disease: meta-analysis of effects on lipids and haemostatic factors. BMJ 1999;319:1523– 8.
18. Kujala UM, Kaprio J, Sarna S, et al. Relationship of leisure-time physical activity and mortality. JAMA 1998;279:440–4. 19. Rose GA, Blackburn H. Cardiovascular survey methods.
Monogr Ser World Health Organ 1968;56:1–188.
20. Koskenvuo M, Kaprio J, Rose RJ, et al. Hostility as a risk factor for mortality and ischemic heart disease in men. Psychosom Med 1988;50:330–40.
21. Sarason IG, Sarason BR, Shearin EN, et al. A brief measure of social support: practical and theoretical implications. J Soc Pers Relat 1987;4:497–510.
22. Lehto AM. Quality of working life and equity. Helsinki, Fin-land: Statistics Finland, 1991.
23. Scheier MF, Carver CS, Bridges MW. Distinguishing optimism from neuroticism (and trait anxiety, mastery, and self-esteem): a reevaluation of the Life Orientation Test. J Pers Soc Psychol 1994;67:1063–78.
24. Antonovsky A. Unraveling the mystery of health: how people manage stress and stay well. San Francisco, CA: Jossey-Bass, 1987.
25. Spielberger CD, Gorsuch RL, Lushene R, et al. Manual for the State-Trait Anxiety Inventory (form Y). Palo Alto, CA: Con-sulting Psychologists Press Inc, 1983.
26. Goldberg D. The detection of psychiatric illness by question-naire. London, United Kingdom: Oxford University Press, 1972. (Maudsley monograph no. 21).
27. Cohen J, Cohen P. Applied multiple regression/correlation analysis for the behavioural sciences. 2nd ed. Erlbaum, NJ: Hillsdale, 1983.
28. Zaccaro SJ, Craig B, Quinn J. Prior absenteeism, supervisory style, job satisfaction, and personal characteristics: an investi-gation of some mediated and moderated linkages to work absenteeism. Organ Behav Hum Dec 1991;50:24–44.
29. Longnecker MP, MacMahon B. Associations between alco-holic beverage consumption and hospitalization, 1983 National Health Interview Survey. Am J Public Health 1988;78:153–6. 30. Armstrong MA, Klatsky AL. Alcohol use and later
31. Poikolainen K, Vartiainen E, Korhonen HJ. Alcohol intake and subjective health. Am J Epidemiol 1996;144:346–50.
32. Alanko T. An overview of techniques and problems in the mea-surement of alcohol consumption. In: Smart R, Cappell H, Gla-ser F, et al, eds. Research advances in alcohol and drug problems. Vol 8. New York, NY: Plenum, 1984:209–26. 33. Desenclos JCA, Klontz KC, Wilder MH, et al. The protective
effect of alcohol on the occurrence of epidemic oyster-borne hepatitis A. Epidemiology 1992;3:371–4.
34. Cohen S, Tyrrell DAJ, Russell MAH, et al. Smoking, alcohol consumption, and susceptibility to the common cold. Am J
Public Health 1993;83:1277–83.
35. Poikolainen K. The other health benefits of moderate alcohol intake. Contemp Drug Problems 1994;21:91–9.
36. Grønbæk M, Deis A, Sørensen TIA, et al. Mortality associated with moderate intakes of wine, beer, or spirits. BMJ 1995;310: 1165–9.
37. Rimm EB, Klatsky A, Grobbee D, et al. Review of moderate alcohol consumption and reduced risk of coronary heart dis-ease: is the effect due to beer, wine, or spirits? BMJ 1996;312: 731–6.