Managing and Analysing Camera Trapping Data:
An Advanced Toolbox
Inaugural-Dissertation
to obtain the academic degree
Doctor rerum naturalium (Dr. rer. nat.)
submitted to the Department of Biology, Chemistry and Pharmacy
of Freie Universität Berlin
by
Jürgen Niedballa
from Dresden, Germany
Diese Dissertation wurde am Leibniz-Institut für Zoo- und Wildtierforschung in Berlin im Zeitraum vom September 2013 bis September 2017 unter der Leitung von Dr. Andreas Wilting und Prof. Dr. Heribert Hofer angefertigt und am Institut für Biologie der Freien Universität Berlin eingereicht. 1. Gutachter: Prof. Dr. Heribert Hofer
2. Gutachter Prof. Dr. Florian Jeltsch
Jürgen Niedballa1, Rahel Sollmann2,3, Alexandre Courtiol1, Andreas Wilting1 (2016): camtrapR: an R package for efficient camera trap data management. Methods in Ecology and Evolution 7(12): 1457– 1462 (https://doi.org/10.1111/2041-210X.12600)
Jürgen Niedballa1, Rahel Sollmann4, Azlan bin Mohamed1, Johannes Bender1, Andreas Wilting1 (2015): Defining habitat covariates in camera-trap based occupancy studies. Scientific Reports 5: 17041 (https://doi.org/10.1038/srep17041)
Jürgen Niedballa1, Andreas Wilting1, Rahel Sollmann4, Heribert Hofer1, Alexandre Courtiol1. Assessing spatiotemporal interactions between species from camera trapping data
1 Leibniz Institute for Zoo and Wildlife Research, Alfred-Kowalke-Str. 17, 10315 Berlin, Germany
2 North Carolina State University, Department of Forestry and Environmental Resources, Campus Box 8008, Raleigh, NC 27695-7646, USA
3 Present address: USDA Forest Service, Pacific Southwest Research Station, 1731 Research Park Drive, Davis, CA 95618, USA.
4 Department of Wildlife, Fish and Conservation Biology, 1088 Academic Surge, University of California, Davis, One Shields Avenue, Davis, CA 95616, USA
Acknowledgements 1
Chapter 1
General introduction 3
Chapter 2
camtrapR: an R package for efficient camera trap data management 18
Chapter 3
Defining habitat covariates in camera-trap based occupancy studies 36
Chapter 4
Assessing spatiotemporal interactions between species from camera trapping data 64
Chapter 5 General discussion 101 Summary 115 Zusammenfassung 117 Curriculum vitae 119 Selbständigkeitserklärung 121
A
CKNOWLEDGEMENTS
This thesis would not have been possible without the support of many, many people.
First of all my special thanks go to my supervisor Andreas Wilting for his guidance, motivation, his drive and support, and for giving me the freedom I needed to give my best throughout the writing of this thesis. I also wish to thank him for all the possibilities working in this project offered for growth on the professional and personal level. I sincerely appreciate it and will never forget it.
I further wish to thank Rahel Sollmann and Alexandre Courtiol for their guidance on the proper use of the methods I applied and the insights I gained during our discussions, and for extensive help with my manuscripts. Alexandre, I want to also thank you for introducing me to the art of creating R packages.
I wish to thank all colleagues from the ScreenForBio project, my fellow PhD students Azlan bin Mohamed, John Mathai, Andrew Tilker and Roshan Guharajan for the mutual support and for working together to make this project a success. I am particularly grateful to John and Azlan for their support during our time in Sabah and to John for being a great friend. I also thank Jan Axtner, Lisa Hörig, Johannes Bender, Tejas Bhagwat, Seth Timothy Wong for their help and support. Not least I thank our field assistants in Sabah, Azrie, Alex, Bendy, Jeff, Jereo and Len for making sure me and all other team members always returned safe and sound from the jungle.
I thank Prof. Heribert Hofer for inspiring and fruitful discussions and new ideas that arose from them. Furthermore I further thank Prof. Heribert and Prof. Florian Jeltsch for evaluating this thesis.
Stephanie Kramer-Schadt deserves a big thank you for first inviting me to IZW back in 2011 as an intern and for revealing to me the beauty and power of GIS work and scripting. I further wish to thank Pierre Gras enjoyable and rewarding discussions about R and GIS.
Many thanks go to all fellow PhD students at IZW, past and present, for the friendly and welcoming atmosphere you created at the institute, and I wish each and every one of you all the best for your future. In particular, I wish to thank Michaela Wetzel, Saskia Wutke, Juliane Maaß, Renata Martins, Riddhi Patel, Paula Ortega Peréz, Deniz Mengüllüoğlu, Niccolo Alfano, Linn Sophia Lehnert, Sara Troxell, Anne Seltmann, Susanne Pribbenow, Sónia Jesus Fontes and Milena Stillfried for making my
time at IZW really worthwhile. I am also grateful to Linn Sophia Lehnert and Milena Stillfried for proof-read parts of this thesis.
My gratitude extends to all users and testers of the camtrapR package, An The Truong Nguyen, Seth Timothy Wong, Ruben Portas, Jörg Melzheimer, and further to all users of the package near and far who contributed to the package with their constructive feedback, feature requests and bug reports. You are the ones for whom I wrote the package, and if it makes your life easier, I am happy.
I further wish to thank our institute admin team. Without your relentless work, nothing at all would be possible at the institute. In particular I wish to thank Katrin Hohnstädter and Daniel Spitzer for their help and patience when handling admin issues. Wolfgang Tauche, Paul Sobtzick and Luca Flauaus came to my rescue more than once with their IT support whenever it was most needed. Thank you!
I am grateful to Mike Meredith and Marc Kéry for statistical advice and for organising an unforgettable workshop on community modelling in Kuala Lumpur.
I thank the German Federal Ministry of Education and Reseach (BMBF) for funding our junior research group.
A deep heartfelt thank you goes to my entire family, particularly my parents Renate and Stefan. Thank you for always having been there for me with everything I needed throughout my life, for supporting me unconditionally and never questioning me, my ideas or my plans. I also thank Thomas and Sabine for their support throughout my life, and also Manuela, Georg, Sara, Max, Jannick and Konrad.
My deepest gratitude and love goes to Kelly for being the most loving, understanding, inspiring and uplifting partner I could ever have wished for. Love and light to you.
Last but surely not least I wish to thank my closest friends Franz, René, Hans, Christian and Mitsuki for their support and friendship.
Thank you very much to all of you! Vielen herzlichen Dank euch allen!
C
HAPTER
1
General introduction
Camera trapping for wildlife studies
Automatic camera traps revolutionised ecological inference about wildlife populations over the past decades due to their ability to continuously, simultaneously, and cost-efficiently survey animals in their natural environment over extensive periods of time and large areas with relatively low requirements of manpower (Kucera & Barrett 2011) . Even elusive, cryptic and rare species can be surveyed with their help, in some cases providing initial baseline data for species with virtually unknown ecology (Mathai et al. 2017).
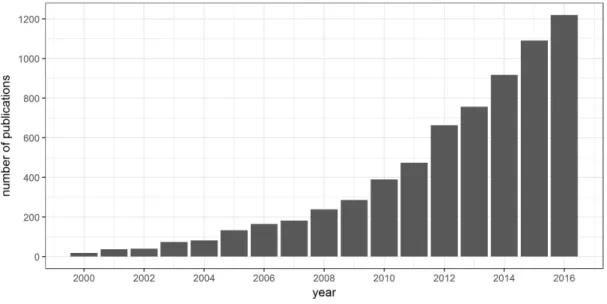
The data camera traps collect are not only aesthetically appealing, but offer intriguing insights into the ecology and behaviour of wildlife, typically medium to large sized mammals. Consequently, the use of camera traps and publications about camera trapping surveys has seen a sharp increase over the past decades (see Figure 1.1 and McCallum 2012). Applications of camera trapping data are found in species management, conservation and ecological research. In the latter, inference ranges from the individual level (e.g. movement parameters; Royle et al. 2014) through population and metapopulation level (e.g. occupancy status, local abundance and population density, changes of occupancy over time; Karanth 1995; Nicholson & Van Manen 2009; Sollmann et al. 2012; Wilting et al. 2012; Mohamed et al. 2013) to community level inference as in species inventories, species interaction studies or community ecology (MacKenzie et al. 2006; Burton et al. 2012; Sunarto et al.
2013; Sollmann et al. 2017). Further applications of camera traps are in behavioural studies, e.g. for species activity patterns, the monitoring of denning behaviour or behavioural patterns that are difficult to infer from individual observations (Cutler & Swann 1999; Sunarto et al. 2013; Ancrenaz et al. 2014).
In the days when analog photography was the only available technology for camera trapping studies the amount of data was limited by technological constraints such as the maximum number of exposures available on film and consequently the manpower needed to keep cameras functional (Kays & Slauson 2008; Kucera & Barrett 2011). With the advent of digital photography in the 2000s and its application in camera trapping, the amount of data collected in camera trapping studies increased rapidly and began to pose a whole new challenge in terms of data management compared to film equipment used earlier, which is by now virtually non-existent in camera trapping. For
illustration, in a typical camera trapping study involving dozens to hundreds of cameras that are deployed for weeks to months, hundreds of thousands or even millions of images can be collected (e.g. Swanson et al. 2015), making manual data management impractical and efficient data management imperative. Fortunately, standardised storage of metadata in the images captured by camera traps, most essentially date and time, allows for their automated extraction. Consequently, various software toolboxes have been developed to facilitate the management and automatic data extraction from large amounts of camera trapping data, each with their own standards for data storage (Harris et al. 2010; Fegraus et al. 2011; Sundaresan et al. 2011; Sanderson & Harris 2013; Krishnappa & Turner 2014; Tobler 2014; Ivan & Newkirk 2015; Zaragozí et al. 2015; Bubnicki et al.
2016; Hendry & Mann 2017).
Concomitantly to the rise of digital photography in camera trapping, the R language (R Core Team 2017) has become the de-facto standard environment for statistical analysis of ecological data, with some of the most highly developed tools for a multitude of ecological analyses of camera trapping data being native to R (e.g. Fiske & Chandler 2011; Laake 2013; Efford 2015; Meredith & Ridout 2016). The absence of a toolbox for camera trap data management in R was the incentive to develop an R package to fill this gap. The aim of its development was to seamlessly connect camera trap data acquisition and management with downstream analytical tool in the same environment. This R package is called camtrapR, was first released in July 2015 on CRAN (Niedballa et al. 2015a) and updated continuously afterwards. The development of camtrapR fell in a time in which there was a spate of development in camera trap data management software (see above), clearly illustrating the need for software that is capable of processing the large amounts of images that are typically collected in today’s camera trapping studies. The R package camtrapR described in chapter 2 harnesses the power of the R language to efficiently manage and analyse camera trapping data (Niedballa et al. 2016).
Occupancy modelling using camera trapping data
One of the main applications of camera trapping data is their use for occupancy modelling. Occupancy models were first proposed by MacKenzie et al. (2002) and have been extended and steadily increased in popularity ever since. The main strength of occupancy models is that they explicitly account for imperfect detection, the possibility of not detecting a species that is in fact present. Imperfect detection is inevitable in wildlife studies in general and camera trapping studies in particular. Not accounting for imperfect detection can very severely affect model results and bias inferences (Gu & Swihart 2004; MacKenzie et al. 2005; Sollmann et al. 2013).
Figure 1.1: The increase of scientific publications related to camera trapping between 2000 and 2016 returned by Google Scholar for the search term: "Camera trap" OR "Trail camera" OR "Photo trap".
Occupancy models address imperfect detection explicitly by separating the ecological process from the imperfect detection process. The ecological process is the occupancy state of a site, i.e. the site being either occupied or unoccupied. Detections are conditional on this occupancy state and only possible if the site is occupied. An observation or detection model is applied to link observations to the unobserved (latent) state variable, which is occupancy (for details see Chapter 4). In that sense occupancy models classify as hierarchical models (Kéry & Royle 2015).
In order to estimate detection probabilities, occupancy models require repeated samples from the sampling sites. In the context of camera trapping, sampling sites are camera trap stations, and repeated samples are obtained by subdividing the survey period at each station into discrete time intervals (usually a few days) to obtain a pattern of detection / non-detection during these repeated samples over the course of the survey duration, from which detection probabilities can be inferred. Occupancy models can furthermore account for varying detection probability (e.g. due to habitat characteristics or temporally changing environmental conditions) and parameter estimates are unaffected by missing sample occasions (MacKenzie et al. 2006).
The simplest case of occupancy models are single-species, single season models. These can be expanded to multi-season models, two-species or community occupancy models (MacKenzie et al.
2006). Single-species single-season models can provide estimates of occupancy and detection probabilities of a single species while accounting for imperfect detection and factoring in the influence of environmental characteristic on occupancy and detection probability estimates
(MacKenzie et al. 2002). Single-species multi-season model allow the estimation of extinction and (re-)colonisation rates from repeated surveys during several seasons, e.g. in metapopulation studies (MacKenzie et al. 2003; Hamel et al. 2013). Two-species occupancy models are used to assess interactions between species, expressed as changes in occupancy probability of a species in the presence of another species (MacKenzie et al. 2004; Richmond et al. 2010; Lazenby & Dickman 2013; Rota et al. 2016). Community occupancy models allow for inferences about species richness, individual and community responses to habitat characteristics (Burton et al. 2012; Sollmann et al.
2017).
All of these different types of occupancy models can take into account covariates on detection and occupancy probabilities. These covariates are most commonly time-invariant habitat characteristics, but detection probabilities may also depend on time-variant covariates such as weather conditions. Habitat can be characterised either via ground surveys, which are often labour-intensive and limited in their spatial coverage and consequently don’t allow extrapolation to larger areas or continuous monitoring through time. In addition, ground surveys inevitably lead to disturbance and interference with natural processes on the ground, possibly biasing results. Thus, an increasingly popular alternative to ground surveys which overcomes many of their limitations is the use of remote sensing technology for habitat characterisation and the generation of covariates for occupancy models (Turner 2014; Bush et al. 2017; Steenweg et al. 2017). Remote sensing covariates hold potential for extrapolation of species distribution models to unsampled areas and monitoring of changes in habitat structure over time without physical interference at these sites.
The application of remote sensing data in occupancy modelling
Since the first satellite-based remote sensing surveys of the earth’s surface in the early 1970s, the use of remote sensing technologies revolutionised earth observation and the way ecologists gather and make use of spatial data in a similar way to the revolution which the use of automatic camera traps meant for the observation of cryptic and elusive wildlife species (Leimgruber et al. 2005; Williams et al. 2006). Remote sensing means measuring properties of objects without making physical contact, and here refers to spaceborne and airborne earth observation. While airborne remote sensing offers more detail due to greater proximity and can be adapted more specifically to the needs of an individual study, satellite data are more readily available, cheaper (often available for free), and provide a wider and more consistent spatial and temporal coverage of the study area. Earth observation satellites are equipped with a plethora or different instruments for a multitude of scientific purposes. Amongst these, optical sensors are the most accessible, widely available and suitable data source for land cover mapping, which is highly relevant for the analysis of species
distribution data. While older satellites such as Landsat had a moderate spatial resolution of 30 metres per pixel, more recent generations of sensor offer higher resolution and thus make much more detailed habitat mapping possible (available sensors range from 5-m RapidEye data to < 1 m in commercial satellites such as WorldView-4 (RapidEye AG 2012)). Higher resolution, however, is not invariably favourable because it comes with a number of drawbacks, namely much larger data volumes, smaller swath width (smaller spatial extent of images), excessive image detail which complicates image analysis and classification, and frequently high costs associated with image acquisition. Consequently, there is a trade-off to be made between using lower-resolution data and running the risk of missing crucial habitat features, and high-resolution data which are more difficult to work with, in many cases expensive, and may not cover the entire study area.
The potential applications of remote sensing in the realm of wildlife ecology are manifold, with land cover mapping and ecosystem monitoring, land cover change detection or terrain description being prominent examples (Karanth et al. 2009; Pettorelli et al. 2011; Sunarto et al. 2012; Carter et al.
2013; García-Rangel & Pettorelli 2013). They offer repeated temporal and extensive spatial coverage of the earth’s surface, allowing continuous monitoring and spatial extrapolation of point processes observed on the ground (e.g. at camera trap stations; Bush et al. 2017).
Yet, remote sensing data require validation by means of in-situ (ground) surveys. These in-situ surveys are crucial to link remotely sensed data to processes and patterns on the ground and guide interpretation of remote sensing data (Asner et al. 2010; Langner et al. 2012). Such in-situ surveys also allow for measurements that are difficult or impossible to obtain using remote sensing techniques, e.g. tree diameters or floristic information. But at the same time they can be logistically challenging, are expensive, and limited in spatial scope. Hence, both in situ and remote sensing surveys have their benefits and drawbacks and support one another in terms of thorough habitat characterisation.
The concept of scale in ecology
In all of these applications, both of remote sensing and in situ habitat surveys, observed landscape patterns are scale-dependent, drawing attention to the widely-known and much-debated concept of scale in ecology, and how it may affect inference from occupancy models that utilise remote sensing covariates (Wiens & Milne 1987; Wiens 1989; Wu 2004). The impact of scale on ecological inferences is a long-known phenomenon and has received much coverage in scientific literature. In the words of Wiens (1989), “[...] different patterns emerge at different scales of investigation of virtually any aspect of any ecological system”. As a consequence, not accounting for scaling relationships may lead to biased or even wrong conclusions about the system under investigation.
Ecological scale consists of two constituents, extent and grain (Turner et al. 1989). Generally speaking, extent is the overall area studied while grain is the size of an individual unit of observation. It is impossible to detect any element smaller than the grain size, and generalisation beyond the study extent is only possible if scale-independence of processes and patterns is assumed, which is uncommon (Wiens 1989). In the context of remote sensing, extent is the area surveyed and grain is the spatial resolution of the data, meaning the pixel size in satellite imagery and derived data. In in-situ surveys, extent equally refers to the area surveyed, and grain could, for example, be the size of subplots within a vegetation plot for which data are aggregated.
The question of scale is related to the question of how animals perceive their environment. In the context of connecting remote sensing to species occurrence data, the questions raised are 1) how the immediate and wider surroundings of a location (i.e., different extents/radii around that location) influence species occupancy patterns, and 2) what spatial resolution (grain size, pixel size) is adequate to describe habitat characteristics that influence species occurrence, i.e., do habitat covariates derived from high-resolution remote sensing data yield higher explanatory value than those from lower-resolution data? To investigate how this concept of scale affects inference from occupancy models based on camera trapping data, in chapter 3 we compared the effect of varying extents and grain sizes in habitat covariates derived from remote sensing data and in situ surveys in terms of their explanatory power (Niedballa et al. 2015b).
Detecting species interactions in camera trapping data
The potential applications of camera trapping data are by far not limited to occupancy modelling. While the inference of spatial interactions between species can be achieved with two-species occupancy models as mentioned above, these models are only sensitive to observable patterns in spatial distributions, thus assuming that interactions between species impact the spatial occurrence of species, e.g. via exclusion of a species from sites where a competitor or predator is present (in the case of avoidance). Nevertheless, an alternative, more subtle form of avoidance between species may involve temporal avoidance rather than spatial avoidance, with species partitioning time instead of space to avoid encounters and interactions while still co-occurring at the same localities. These temporal interactions between species cannot be detected with two-species occupancy models because the occupancy state (the state variable of occupancy models) is not affected by and also not sensitive to temporal avoidance.
In the case of avoidance between species (due to predation risk or competition), temporal avoidance may take different forms. The first is the temporary avoidance of a site after a dominant species or individual was present (e.g. a predator or stronger competitor). Alternatively, species may shift their
activity periods relative to one another in an effort to segregate temporally and thus reduce the chances of encounters and potentially detrimental interactions. Both of these interactions were observed in wildlife data, e.g. between sympatric intraguild competitors or in predator-prey relationships (e.g. Harmsen et al. 2009; Monterroso et al. 2014; Parsons et al. 2016). Both of these types of temporal interactions are avoidance strategies and ultimately behavioural adaptations aimed at increasing fitness by reducing predation risk or the risk of disadvantageous interactions (Schuette et al. 2013).
Because of its more subtle nature and the randomness in species detections in camera trapping, the inference of temporal interactions between species is a challenging task, yet rewarding in terms of ecological insights gained (e.g. Hayward & Slotow 2009; Tambling et al. 2015; Wang et al. 2015). Notwithstanding the ecological interest and despite a number of methods that were suggested and applied (Harmsen et al. 2009; Ridout & Linkie 2009; Parsons et al. 2016), the detection of temporal interactions from camera trapping data has received little methodological scrutiny compared to two-species occupancy models. The main obstacle for a comparative assessment of different methods for detecting temporal interactions between species is the unknown and unobserved true state of the system. The only way to overcome this obstacle and arrive at an unbiased assessment of the different methods is to simulate data and apply the methods to these simulated data, which was done in chapter 4.
Structure of the dissertation
The overarching aim of this work was to facilitate the handling of and improve inferences from camera trapping studies by firstly providing a new toolbox for camera trap data management, secondly exploring the utility of high-resolution remote sensing data in camera trap-based species occupancy models, and thirdly assessing and comparing methods for detecting temporal interactions between species from camera trapping data. The results are presented in the form of three manuscripts in chapters 2 to 4:
1) Modern camera trapping is a very data-intensive discipline and therefore requires thorough data management. Chapter 2 (“camtrapR: an R package for efficient camera trap data management”) describes the R package camtrapR which provides a camera trap data management workflow within the widely-used R environment. It seamlessly connects camera trap data acquisition and management with ecological analyses provided by a multitude of other R packages and software tools.
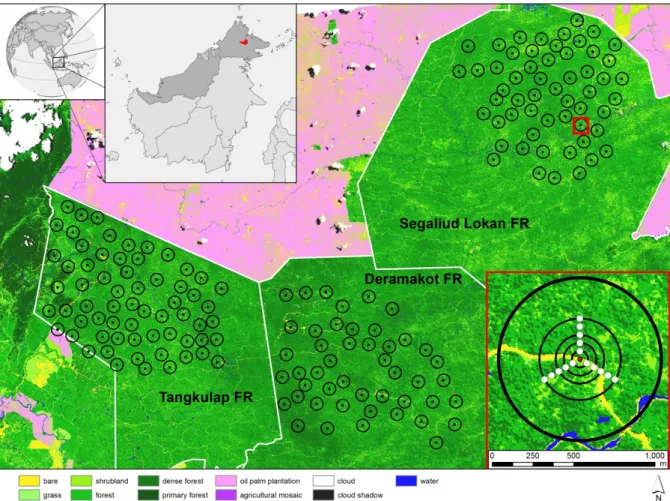
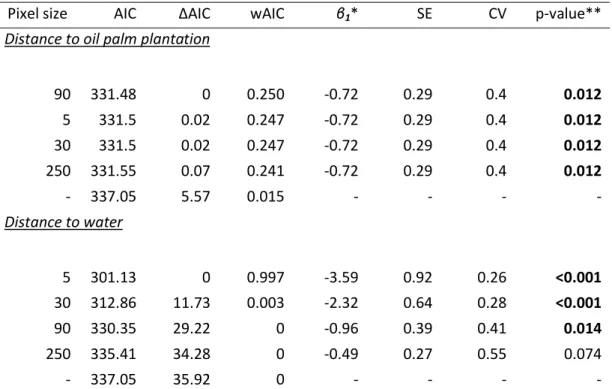
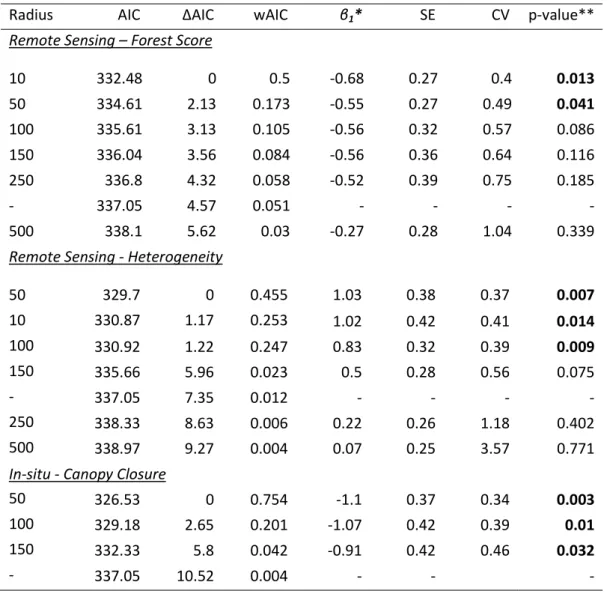
2) Chapter 3 (“Defining habitat covariates in camera-trap based occupancy studies”) deals with the incorporation of high-resolution remote sensing data into camera trap based occupancy models and the arising questions of ecological scale. Using six sample species from Sabah, Malaysian Borneo, the manuscript explores the influence that spatial resolution (pixel size of land cover data) and the extent of patches around camera trap localities have on inferences of habitat associations from single-species occupancy models. It shows that high-resolution land cover data can have considerably more model support than lower resolution land cover data, suggesting their application in occupancy models is justified and may lead to improved inferences. Remote sensing data for habitat characterisation can further reduce field effort by serving as a surrogate for labour-intensive in-situ measures. The manuscript thus demonstrates the utility of high-resolution land cover data in species occupancy models and confirms the decades-old yet frequently ignored notion that ecological scale still matters when using state-of-the-art methods.
3) Chapter 4 (“Assessing spatiotemporal interactions between species from camera trapping data”) explores the use of camera trapping data for inferring temporal interactions between species. More specifically, it investigates the properties of different statistical tests for detecting two types of temporal interactions between species: 1) spatiotemporal avoidance, i.e. temporary avoidance of a site by a subordinate species after a dominant species was present, and 2) temporal segregation, i.e. shifts in activity patterns between species which lead to reduced activity overlaps. Both of these strategies can serve to avoid encounters or interference between species, thus facilitating co-existence between species. In a simulation study, we compared four methods for detecting spatiotemporal avoidance: linear models, U-test, a permutation test and a test based on randomly created records; and assessed a permutation test for detecting temporal segregation. All tests were generally robust and suitable for detecting temporal interactions. Linear models had highest power and greatest flexibility for detecting spatiotemporal avoidance. The results can guide practitioners in their choice of methods and furthermore provide a flexible and extensible framework for simulation and exploration of temporal species interactions in camera trapping data.
Chapter 5 is a general discussion which summarises the results of the dissertation and discusses them in the wider context of camera trapping and quantitative wildlife ecology.
References
Ancrenaz, M., Sollmann, R., Meijaard, E., Hearn, A.J., Ross, J., Samejima, H., Loken, B., Cheyne, S.M., Stark, D.J., Gardner, P.C., Goossens, B., Mohamed, A., Bohm, T., Matsuda, I., Nakabayasi, M., Lee, S.K., Bernard, H., Brodie, J., Wich, S., Fredriksson, G., Hanya, G., Harrison, M.E., Kanamori, T., Kretzschmar, P., Macdonald, D.W., Riger, P., Spehar, S., Ambu, L.N. & Wilting, A. (2014). Coming down from the trees: Is terrestrial activity in Bornean orangutans natural or disturbance driven? Scientific Reports, 4, 1–6.
Asner, G.P., Powell, G.V.N., Mascaro, J., Knapp, D.E., Clark, J.K., Jacobson, J., Kennedy-Bowdoin, T., Balaji, A., Paez-Acosta, G., Victoria, E., Secada, L., Valqui, M. & Hughes, R.F. (2010). High-resolution forest carbon stocks and emissions in the Amazon. Proceedings of the National Academy of Sciences of the United States of America, 107, 16738–42.
Bubnicki, J.W., Churski, M. & Kuijper, D.P.J. (2016). TRAPPER: an open source web-based application to manage camera trapping projects. Methods in Ecology and Evolution, 7, 1209–1216.
Burton, A.C., Sam, M.K., Balangtaa, C. & Brashares, J.S. (2012). Hierarchical Multi-Species Modeling of Carnivore Responses to Hunting, Habitat and Prey in a West African Protected Area. PloS one, 7, e38007.
Bush, A., Sollmann, R., Wilting, A., Bohmann, K., Cole, B., Balzter, H., Martius, C., Zlinszky, A., Calvignac-Spencer, S., Cobbold, C.A., Dawson, T.P., Emerson, B.C., Ferrier, S., Gilbert, M.T.P., Herold, M., Jones, L., Leendertz, F.H., Matthews, L., Millington, J.D.A., Olson, J.R., Ovaskainen, O., Raffaelli, D., Reeve, R., Rödel, M.-O., Rodgers, T.W., Snape, S., Visseren-Hamakers, I., Vogler, A.P., White, P.C.L., Wooster, M.J. & Yu, D.W. (2017). Connecting Earth observation to high-throughput biodiversity data. Nature Ecology & Evolution, 1, 176.
Carter, N.H., Gurung, B., Vina, A., III, H.C., Karki, J.B. & Liu, J. (2013). Assessing spatiotemporal changes in tiger habitat across different land management regimes. Ecosphere, 4, 1–19.
Cutler, T.L. & Swann, D.E. (1999). Using Remote Photography in Wildlife Ecology: A Review. Wildlife Society Bulletin, 27, 571–581.
Efford, M.G. (2015). secr: Spatially explicit capture-recapture models.
Fegraus, E.H., Lin, K., Ahumada, J.A., Baru, C., Chandra, S. & Youn, C. (2011). Data acquisition and 7management software for camera trap data: A case study from the TEAM Network. Ecological Informatics, 6, 345–353.
Fiske, I.J. & Chandler, R.B. (2011). unmarked : An R Package for Fitting Hierarchical Models of Wildlife Occurrence and Abundance. Journal of Statistical Software, 43, 1–23.
García-Rangel, S. & Pettorelli, N. (2013). Thinking spatially: The importance of geospatial techniques for carnivore conservation. Ecological Informatics, 14, 84–89.
Gu, W. & Swihart, R.K. (2004). Absent or undetected? Effects of non-detection of species occurrence on wildlife-habitat models. Biological Conservation, 116, 195–203.
Hamel, S., Killengreen, S.T., Henden, J.A., Yoccoz, N.G. & Ims, R.A. (2013). Disentangling the importance of interspecific competition, Food availability, And habitat in species occupancy: Recolonization of the endangered Fennoscandian arctic fox. Biological Conservation, 160, 114– 120.
Harmsen, B.J., Foster, R.J., Silver, S.C., Ostro, L.E.T. & Doncaster, C.P. (2009). Spatial and Temporal Interactions of Sympatric Jaguars (Panthera onca) and Pumas (Puma concolor) in a Neotropical Forest. Journal of Mammalogy, 90, 612–620.
Harris, G., Thompson, R., Childs, J.L. & Sanderson, J.G. (2010). Automatic Storage and Analysis of Camera Trap Data. Bulletin of the Ecological Society of America, 91, 352–360.
Hayward, M.W. & Slotow, R. (2009). Temporal Partitioning of Activity in Large African Carnivores: Tests of Multiple Hypotheses. South African Journal of Wildlife Research, 39, 109–125.
Hendry, H. & Mann, C. (2017). Camelot (Occupancy models.
Ivan, J.S. & Newkirk, E.S. (2015). CPW Photo Warehouse: a custom database to facilitate archiving, identifying, summarizing and managing photo data collected from camera traps. Methods in Ecology and Evolution, 7, 499–504.
Karanth, K.U. (1995). Estimating tiger Panthera tigris populations from camera-trap data using capture-recapture models. Biological Conservation, 71, 333–338.
Karanth, K.K., Nichols, J.D., Hines, J.E., Karanth, K.U. & Christensen, N.L. (2009). Patterns and determinants of mammal species occurrence in India. Journal of Applied Ecology, 46, 1189– 1200.
Kays, R.W. & Slauson, K.M. (2008). Remote cameras. Noninvasive Survey Methods for Carnivores (eds R.A. Long, P. MacKay, J. Ray & W. Zielinski), pp. 110–140. Island Press, Washington, DC.
abundance and species richness in R and BUGS: Volume 1: Prelude and Static Models. Academic Press.
Krishnappa, Y.S. & Turner, W.C. (2014). Software for minimalistic data management in large camera trap studies. Ecological Informatics, 24, 11–16.
Kucera, T.E. & Barrett, R.H. (2011). A History of Camera Trapping. Camera Traps in Animal Ecology, pp. 9–26. Springer Japan.
Laake, J.L. (2013). RMark: An R Interface for Analysis of Capture-Recapture Data with MARK. Seattle, WA.
Langner, A., Samejima, H., Ong, R.C., Titin, J. & Kitayama, K. (2012). Integration of carbon conservation into sustainable forest management using high resolution satellite imagery: A case study in Sabah, Malaysian Borneo. International Journal of Applied Earth Observation and Geoinformation, 18, 305–312.
Lazenby, B.T. & Dickman, C.R. (2013). Patterns of Detection and Capture Are Associated with Cohabiting Predators and Prey. PLoS ONE, 8, e59846.
Leimgruber, P., Christen, C.A. & Laborderie, A. (2005). The impact of landsat satellite monitoring on conservation biology. Environmental Monitoring and Assessment, 106, 81–101.
MacKenzie, D.I., Bailey, L.L. & Nichols, J.D. (2004). Investigating species co-occurrence patterns when species are detected imperfectly. Journal of Animal Ecology, 73, 546–555.
MacKenzie, D.I., Nichols, J.D., Hines, J.E., Knutson, M.G. & Frankling, A.B. (2003). Estimating site occupancy, colonization, and local extinction when a species is detected imperfectly. Ecology,
84, 2200–2207.
MacKenzie, D.I., Nichols, J.D., Lachman, G.B., Droege, S., Royle, J.A. & Langtimm, C.A. (2002). Estimating site occupancy rates when detection probabilities are less than one. Ecology, 83, 2248–2255.
MacKenzie, D.I., Nichols, J.D., Royle, J.A., Pollock, K.H., Bailey, L.L. & Hines, J.E. (2006). Occupancy Estimation and Modeling: Inferring Patterns and Dynamics of Species Occurence. Academic Press, London, United Kingdom.
MacKenzie, D.I., Nichols, J.D., Sutton, N., Kawanishi, K. & Bailey, L.L. (2005). Improving inferences in population studies of rare species that are detected imperfectly. Ecology, 86, 1101–1113.
Mathai, J., Sollmann, R., Michael E. Meredith, J.L.B., Niedballa, J., Buckingham, L., Wong, S.T., Asad, S. & Wilting, A. (2017). Fine-scale distributions of carnivores in a logging concession in Sarawak, Malaysian Borneo. Mammalian Biology - Zeitschrift für Säugetierkunde, 86, 56–65.
McCallum, J. (2012). Changing use of camera traps in mammalian field research: Habitats, taxa and study types. Mammal Review, 43, 196–206.
Meredith, M. & Ridout, M. (2016). overlap: Estimates of coefficient of overlapping for animal activity patterns. R package version 0.2.6.
Mohamed, A., Sollmann, R., Bernard, H., Ambu, L.N., Lagan, P., Mannan, S., Hofer, H. & Wilting, A. (2013). Density and habitat use of the leopard cat (Prionailurus bengalensis) in three commercial forest reserves in Sabah, Malaysian Borneo. Journal of Mammalogy, 94, 82–89. Monterroso, P., Alves, P.C. & Ferreras, P. (2014). Plasticity in circadian activity patterns of
mesocarnivores in Southwestern Europe: Implications for species coexistence. Behavioral Ecology and Sociobiology, 68, 1403–1417.
Nicholson, J.M. & Van Manen, F.T. (2009). Using occupancy models to determine mammalian responses to landscape changes. Integrative Zoology, 4, 232–239.
Niedballa, J., Courtiol, A., Sollmann, R. & Wilting, A. (2015a). camtrapR: Camera Trap Data Management and Preparation of Occupancy and Spatial Capture-Recapture Analyses.
Niedballa, J., Sollmann, R., Courtiol, A. & Wilting, A. (2016). camtrapR: An R package for efficient camera trap data management. Methods in Ecology and Evolution, 7, 1457–1462.
Niedballa, J., Sollmann, R., Mohamed, A. bin, Bender, J. & Wilting, A. (2015b). Defining habitat covariates in camera-trap based occupancy studies. Scientific Reports, 5, 17041.
Parsons, A.W., Bland, C., Forrester, T., Baker, M.C., Schuttler, S.G., McShea, W.J., Costello, R. & Kays, R. (2016). The ecological impact of dogs on wildlife in protected areas in eastern North America.
Biological Conservation, 203, 75–88.
Pettorelli, N., Ryan, S., Mueller, T., Bunnefeld, N., Jedrzejewska, B., Lima, M. & Kausrud, K. (2011). The Normalized Difference Vegetation Index (NDVI): unforeseen successes in animal ecology.
Climate Research, 46, 15–27.
R Core Team. (2017). R: A language and environment for statistical computing.
https://earth.esa.int/documents/10174/896711/RE_Product_Specifications_ENG.pdf [accessed 4 July 2013]
Richmond, O.M.W., Hines, J.E. & Beissinger, S.R. (2010). Two-species occupancy models: a new paramaterization applied to co-occurence of secretive rails. Ecological Applications, 20, 2036– 2046.
Ridout, M.S. & Linkie, M. (2009). Estimating overlap of daily activity patterns from camera trap data.
Journal of Agricultural, Biological and Environmental Statistics, 14, 322–337.
Rota, C.T., Wikle, C.K., Kays, R.W., Forrester, T.D., McShea, W.J., Parsons, A.W. & Millspaugh, J.J. (2016). A two-species occupancy model accommodating simultaneous spatial and interspecific dependence. Ecology, 97, 48–53.
Royle, J.A., Chandler, R.B., Sollmann, R. & Gardner, B. (2014). Spatial Capture-Recapture. Academic Press.
Sanderson, J. & Harris, G. (2013). Automatic data organization, storage, and analysis of camera trap pictures. Journal of Indonesian Natural History, 1, 6–14.
Schuette, P., Wagner, A.P., Wagner, M.E. & Creel, S. (2013). Occupancy patterns and niche partitioning within a diverse carnivore community exposed to anthropogenic pressures.
Biological Conservation, 158, 301–312.
Sollmann, R., Furtado, M.M., Hofer, H., Jácomo, A.T. a., Tôrres, N.M. & Silveira, L. (2012). Using occupancy models to investigate space partitioning between two sympatric large predators, the jaguar and puma in central Brazil. Mammalian Biology - Zeitschrift für Säugetierkunde, 77, 41– 46.
Sollmann, R., Mohamed, A. bin, Niedballa, J., Bender, J., Ambu, L., Lagan, P., Mannan, S., Ong, R.C., Langner, A., Gardner, B. & Wilting, A. (2017). Quantifying mammal biodiversity co-benefits in certified tropical forests. Diversity and Distributions, 317–328.
Sollmann, R., Mohamed, A., Samejima, H. & Wilting, A. (2013). Risky business or simple solution – Relative abundance indices from camera-trapping. Biological Conservation, 159, 405–412. Steenweg, R., Hebblewhite, M., Kays, R., Ahumada, J., Fisher, J.T., Burton, C., Townsend, S.E.,
Carbone, C., Rowcliffe, J.M., Whittington, J., Brodie, J., Royle, J.A., Switalski, A., Clevenger, A.P., Heim, N. & Rich, L.N. (2017). Scaling up camera traps: monitoring the planet’s biodiversity with networks of remote sensors. Frontiers in Ecology and the Environment, 15, 26–34.
Sunarto, Kelly, M.J., Parakkasi, K., Klenzendorf, S., Septayuda, E. & Kurniawan, H. (2012). Tigers need cover: multi-scale occupancy study of the big cat in Sumatran forest and plantation landscapes.
PloS one, 7, e30859.
Sunarto, Sollmann, R., Mohamed, A. & Kelly, M.J. (2013). Camera trapping for the study and conservation of tropical carnivores. Raffles Bulletin of Zoology, 28, 21–42.
Sundaresan, S.R., Riginos, C. & Abelson, E.S. (2011). Management and Analysis of Camera Trap Data: Alternative Approaches (Response to Harris et al. 2010). Bulletin of the Ecological Society of America, 92, 188–195.
Swanson, A., Kosmala, M., Lintott, C., Simpson, R., Smith, A. & Packer, C. (2015). Snapshot Serengeti, high-frequency annotated camera trap images of 40 mammalian species in an African savanna.
Scientific Data, 2, 150026.
Tambling, C.J., Minnie, L., Meyer, J., Freeman, E.W., Santymire, R.M., Adendorff, J. & Kerley, G.I.H. (2015). Temporal shifts in activity of prey following large predator reintroductions. Behavioral Ecology and Sociobiology, 69, 1153–1161.
Tobler, M.W. (2014). Camera base version 1.6.1.
Turner, W. (2014). Sensing biodiversity. Science, 346, 301–302.
Turner, M.G., Dale, V.H. & Gardner, R.H. (1989). Predicting across scales: Theory development and testing. Landscape Ecology, 3, 245–252.
Wang, Y., Allen, M.L. & Wilmers, C.C. (2015). Mesopredator spatial and temporal responses to large predators and human development in the Santa Cruz Mountains of California. Biological Conservation, 190, 23–33.
Wiens, J.A. (1989). Spatial scaling in ecology. Functional Ecology, 3, 385–397.
Wiens, J.A. & Milne, B.T. (1987). Scaling of ‘landscapes’ in landscape ecology, or, landscape ecology from a beetle’s perspective. Landscape Ecology, 3, 87–96.
Williams, D.L., Goward, S.N. & Arvidson, T. (2006). Landsat: Yesterday, today, and tomorrow.
Photogrammetric Engineering and Remote Sensing, 72, 1171–1178.
Wilting, A., Mohamed, A., Ambu, L.N., Lagan, P., Mannan, S., Hofer, H. & Sollmann, R. (2012). Density of the Vulnerable Sunda clouded leopard Neofelis diardi in two commercial forest reserves in Sabah, Malaysian Borneo. Oryx, 46, 423–426.
Wu, J. (2004). Effects of changing scale on landscape pattern analysis: scaling relations. Landscape Ecology, 19, 125–138.
Zaragozí, B., Belda, A., Giménez, P., Navarro, J.T. & Bonet, A. (2015). Advances in camera trap data management tools: Towards collaborative development and integration with GIS. Ecological Informatics, 30, 6–11.
C
HAPTER
2
camtrapR
:
an R package for efficient camera trap data management
J
ÜRGENN
IEDBALLA1*,
R
AHELS
OLLMANN2,
A
LEXANDREC
OURTIOL1,
A
NDREASW
ILTING1Methods in Ecology and Evolution 7.12 (2016): 1457-1462 ( https://doi.org/10.1111/2041-210X.12600)
1) Leibniz Institute for Zoo and Wildlife Research, Alfred-Kowalke-Str. 17, 10315 Berlin, GERMANY 2) Department of Wildlife, Fish and Conservation Biology, University of California Davis, Davis, CA, USA
* corresponding author: [email protected]
Author’s contribution statement
JN, RS and AW conceived the ideas for the R package and the manuscript. JN wrote the R code of the package. AC advised on R package development and package structure. RS and AW advised on the methods implemented in the package. RS, AW and AC extensively commented on the manuscript.
This is the peer reviewed version of the following article:
Niedballa, J., Sollmann, R., Courtiol, A., Wilting, A. (2016), camtrapR: an R package for efficient camera trap data management. Methods Ecol Evol, 7: 1457-1462
which has been published in final form at https://doi.org/10.1111/2041-210X.12600. This article may be used for non-commercial purposes in accordance with Wiley Terms and Conditions for Use of Self-Archived Versions."
camtrapR: an R package for efficient camera trap data management
J
ÜRGENN
IEDBALLA1*,
R
AHELS
OLLMANN2,
A
LEXANDREC
OURTIOL1,
A
NDREASW
ILTING11) Leibniz Institute for Zoo and Wildlife Research, Alfred-Kowalke-Str. 17, 10315 Berlin, GERMANY 2) Department of Wildlife, Fish and Conservation Biology, University of California Davis, Davis, CA, USA
Summary
1. Camera trapping is a widely applied method to study mammalian biodiversity and is still gaining popularity. It can quickly generate large amounts of data which need to be managed in an efficient and transparent way that links data acquisition with analytical tools.
2. We describe the free and open-source R package camtrapR, a new toolbox for flexible and efficient management of data generated in camera trap-based wildlife studies. The package implements a complete workflow for processing camera trapping data. It assists in image organization, species and individual identification, data extraction from images, tabulation and visualization of results and export of data for subsequent analyses. There is no limitation to the number of images stored in this data management system; the system is portable and compatible across operating systems.
3. The functions provide extensive automation to minimize data entry mistakes and, apart from species and individual identification, require minimal manual user input. Species and individual identification are performed outside the R environment, either via tags assigned in dedicated image management software or by moving images into species directories.
4. Input for occupancy and (spatial) capture–recapture analyses for density and abundance estimation, for example in the R packages unmarked or secr, is computed in a flexible and reproducible manner. In addition, survey summary reports can be generated, spatial distributions of records can be plotted and exported to GIS software, and single- and two-species activity patterns can be visualized.
5. camtrapR allows for streamlined and flexible camera trap data management and should be most useful to researchers and practitioners who regularly handle large amounts of camera trapping data.
Key-words
biodiversity surveys and monitoring, occupancy models, spatial capture-recapture models, detection history, data management, photo-trapping, camera-trapping, wildlife studies
Introduction
Camera trapping is a powerful and widely used method for the rapid assessment of mammalian biodiversity, particularly in challenging environments (Tobler et al. 2008; Sunarto et al. 2013; Burton
et al. 2015). A multitude of ecological analyses utilize camera trap data, including estimation of occupancy probabilities (MacKenzie et al. 2002) or abundance, density and demographic rates with capture–recapture (Karanth 1995; Silver et al. 2004) and spatial capture–recapture models (Efford 2004; Royle et al. 2009; Gardner et al. 2010). These methods are implemented in R packages [e.g. unmarked (Fiske & Chandler 2011), secr (Efford 2015) or RMark (Laake 2013)] and stand-alone computer programs [e.g. program mark (White & Burnham 1999) or presence (Hines 2006)].
Efficient use of these analytical tools requires efficient and systematic management of the large numbers of images that can be generated in short periods of time. A variety of approaches using different software have been developed for that purpose (Harris et al. 2010; Fegraus et al. 2011; Sundaresan, Riginos & Abelson 2011; Sanderson & Harris 2013; Krishnappa & Turner 2014; Tobler 2014; Zaragozí et al. 2015; McShea et al. 2016; Ivan & Newkirk 2016; see the latter and Table S2.1 for a comparison of approaches). These software approaches have different foci and offer different sets of features. In developing camtrapR, we aimed at incorporating and expanding upon these capabilities within a unified camera trap data management tool. In addition to functionalities already available (e.g. automatic import of images, generation of reports and input files for subsequent analyses), camtrapR (i) uses the increasingly popular R language, (ii) is free and fully open-source, (iii) is fully compatible with Windows, MacOS and Linux, (iv) reads and allows the user to create arbitrary image metadata tags, (v) supports different methods for identifying species and individuals and (vi) has mapping and GIS export capabilities.
Here, we describe camtrapR, the first toolbox for the management of camera trap data available for the R community. Our R package provides a flexible and coherent workflow for efficient camera trap data organization, exploration and processing in the R statistical language, which seamlessly connects data acquisition with downstream analytical tools. We outline the camtrapR workflow for organizing camera trap images as well as extracting, exploring and visualizing the resulting data and illustrate its use with a sample data set from a camera trapping study conducted in Sabah, Malaysian Borneo (Mohamed et al. 2013). Detailed vignettes, help files, sample data and analyses are available in the camtrapR package available on CRAN (https://cran.r-project.org/web/packages/camtrapR/).
Functionality
The camtrapR standard workflow can be divided into five main functionalities, listed here and described in sequence below.
1. Image organization and management: Setting up a directory structure for storing raw camera trap images and optionally renaming images by station identity (station ID), date and time.
2. Species/individual identification: Species and individual identification by metadata tagging in image management software or drag and drop of images into directories. Functions for checking species lists with taxonomic databases, verifying identification and appending species names to files are provided.
3. Image data extraction: Tabulation of species records and extraction of image metadata. 4. Data exploration: Visualization of spatial species occurrence patterns (including export to gis
software), single- and two-species activity patterns.
5. Data export: Preparation of input files for subsequent analyses in occupancy and (spatial) capture–recapture frameworks. Generation of survey summary reports.
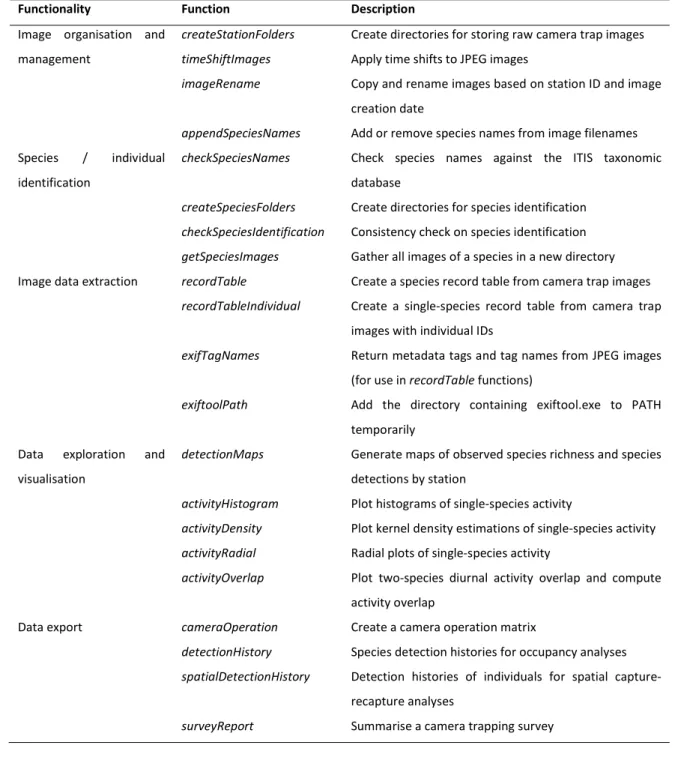
Table 2.1 provides a list and a short description of all functions in the camtrapR package. The functions of the package are described below and in more detail in the package help files and vignettes.
Package description
Overview
The camtrapR package, now in version 0.99.1, is written in the R language (R Core Team 2015) and was first released on CRAN in July 2015. It can be used under R version 3.1 (R Core Team 2015) and higher on Windows, MacOS and Linux. The key functions of the package make use of the free command line software ExifTool (Harvey 2015) via system calls to extract metadata from camera trap images in JPEG format. camtrapR provides extensive automation of processes, performs rigorous consistency checks on input data and has no inherent limitation in terms of the image number held in the data management system.
camtrapR was designed for studies utilizing arrays of camera trap stations, each consisting of one or more (often two) camera trap units (termed cameras for sake of simplicity). Cameras within a station are set in relative proximity to each other compared to between-station distances.
Table 2.1: List of camtrapR functions.
Functionality Function Description Image organisation and
management
createStationFolders Create directories for storing raw camera trap images
timeShiftImages Apply time shifts to JPEG images
imageRename Copy and rename images based on station ID and image
creation date
appendSpeciesNames Add or remove species names from image filenames
Species / individual identification
checkSpeciesNames Check species names against the ITIS taxonomic
database
createSpeciesFolders Create directories for species identification
checkSpeciesIdentification Consistency check on species identification
getSpeciesImages Gather all images of a species in a new directory
Image data extraction recordTable Create a species record table from camera trap images
recordTableIndividual Create a single-species record table from camera trap
images with individual IDs
exifTagNames Return metadata tags and tag names from JPEG images
(for use in recordTable functions)
exiftoolPath Add the directory containing exiftool.exe to PATH
temporarily Data exploration and
visualisation
detectionMaps Generate maps of observed species richness and species
detections by station
activityHistogram Plot histograms of single-species activity
activityDensity Plot kernel density estimations of single-species activity
activityRadial Radial plots of single-species activity
activityOverlap Plot two-species diurnal activity overlap and compute
activity overlap
Data export cameraOperation Create a camera operation matrix
detectionHistory Species detection histories for occupancy analyses
spatialDetectionHistory Detection histories of individuals for spatial
capture-recapture analyses
surveyReport Summarise a camera trapping survey
Image Organization and Management
Image organization begins with saving raw images into camera trap station directories (e.g. myStudy/rawImages/stationA). Station directories may contain camera subdirectories (e.g. myStudy/rawImages/stationA/camera1) if more than one camera was used at a station. The function
Date and time of images can be changed using the function timeShiftImages, for example if internal camera date and/or time values were set incorrectly, reset accidentally, or if users wish to synchronize camera pairs. It uses the date/time shift module of ExifTool.
If desired, all images can be renamed automatically with station ID, camera ID, date and time with the function imageRename.
Image Metadata and Metadata Tagging
Digital images contain metadata in standardized Exif format, for example date and time, geotags, camera settings, ambient data, trigger event number and many more. In addition, users can assign information to images via custom metadata tags in image management software, for example species or individual identification, sex, behaviour, group size counts or group membership of individuals. These metadata tags become part of the images and are portable without depending on a relational database structure. Both types of metadata can be extracted, tabulated and used subsequently, for example for data filtering prior to analyses. The package vignettes contain a performance estimate for metadata extraction using ExifTool.
We recommend the free and open-source software DigiKam (www.digikam.org) for tagging because it provides a customizable, hierarchical tag structure and has powerful filtering, querying and batch-tagging capabilities. Adobe Lightroom and Adobe Bridge are also suitable.
Species Identification
Species identification is a laborious but most crucial step in the workflow because all analyses rely on correct species identification and many models are sensitive to false positives (Miller et al. 2011). It is also the only task that cannot be automated readily (both in this and other software packages), as automatic identification tools are currently still too unreliable and need reference data for all species potentially present in the study area (Yu et al. 2013; but see McShea et al. 2016). camtrapR
supports two different ways of identifying species: (i) by assigning species tags to images in image management software, and (ii) by moving images into species directories [drag and drop, an approach also used by Harris et al. (2010) and Sanderson & Harris (2013)].
Users are free to use any species names (or abbreviations or codes) they wish. If scientific or common species names are used, the function checkSpeciesNames can check them against the ITIS taxonomic database (www.itis.gov) and returns their matching counterparts (utilizing the R package taxize (Chamberlain & Szöcs 2013) internally), making sure species names and spelling are standardized and taxonomically sound, and thus making it easier to combine data sets from different studies.
To improve reliability of species identification, multiple observers can replicate species assignment (if metadata tags are used for species identification). In order to reconcile their species assignments, and because of the scope for incorrect species assignment even by one observer, the function
checkSpeciesIdentification finds conflicting species assignments from multiple observers and assesses temporal proximity between images assigned to different species within the same station.
After species identification, the function appendSpeciesNames optionally appends species names to file names. The function getSpeciesImages can create a species image report by copying all images of a focal species into a separate species directory (e.g. myStudy/speciesImages/Malay Civet), thus facilitating checks on species identification or gathering images for expert identification. If species identification changes at a later point (e.g. after expert identification), these images can easily be copied back into the image directory structure and functions can be rerun.
Individual Identification
Individual identification is a prerequisite for spatial (as well as traditional, non-spatial) capture– recapture analyses. After identifying images to species level and collecting images of the focal species, individual identification is performed in the same way as species identification described above, using either metadata tags or directories for individual identification.
Table 2.2: Example record table. Station is the camera trap station ID, Species are Leopard Cat Prionailurus bengalensis
(PBE) and Malay Civet Viverra tangalunga (VTA). “delta.time…” denotes lag between a record and the last record of the same species at the same station (in seconds, minutes, hours and days). Columns Directory and FileName were omitted.
Station Species DateTimeOriginal Date Time delta.time.mins delta.time.hours delta.time.days
StationA PBE 2009-04-21 00:40:00 2009-04-21 00:40:00 0 0·0 0·0 StationA PBE 2009-04-22 20:19:00 2009-04-22 20:19:00 2619 43·6 1·8 StationA PBE 2009-04-23 00:07:00 2009-04-23 00:07:00 226 3·8 0·2 StationA PBE 2009-05-07 17:11:00 2009-05-07 17:11:00 21182 353·0 14·7 StationA VTA 2009-04-10 05:07:00 2009-04-10 05:07:00 0 0·0 0·0 StationA VTA 2009-05-06 19:06:00 2009-05-06 19:06:00 38279 638·0 26·6
Image Data Extraction
After species identification, the function recordTable organizes species records in a table containing (at the minimum) station IDs, species names, date and time of records (see Table 2.2). The function
recordTableIndividual offers analogous capabilities for individually identified animals. In order to use the capabilities of camtrapR on record tables from prior work (created manually or with other software), these data sets can easily be converted into the simple data format provided by the
recordTable functions.
Both functions can extract custom and manufacturer-specific metadata tags from the images. Because metadata tag names are generally unknown, the function exifTagNames returns metadata tags and tag names, thereby helping users to identify the relevant tags they wish to include in the tables.
A filter for temporal independence between images of the same species at the same station is implemented (argument minDeltaTime, in minutes). If set to 0, the recordTable functions return all records. Any higher number will only return records that were taken at least minDeltaTime minutes after the last record of the same species/individual at the same station or, alternatively, minDeltaTime minutes after the last independent record of the same species/individual. All functions for downstream analyses depend on the results of recordTable/recordTableIndividual and thus on the argument minDeltaTime.
Camera Trap Station Information
A simple data frame is used to store information about camera trap stations and, if applicable, individual cameras (see Table 2.3). It contains station/camera IDs, geographic coordinates, setup and retrieval dates, and possibly station-level covariates. It can be created in standard spreadsheet software and imported into R. Periods in which cameras malfunctioned (once or repeatedly) can be defined. Both format and names of date and coordinate columns can be specified by the user.
Based on setup, retrieval and malfunctioning dates, the function cameraOperation computes a day-by-station camera operation matrix, coding whether stations were operational, partly operational, not operational (malfunctioning) or not set up. The camera operation matrix reflects the daily trapping effort per station, that is the number of active cameras per station and day. Depending on their placement, multiple cameras within a sampling point can increase the probability of detecting an animal. If cameras are set up directly opposite each other, they may be considered one operational unit. If they are set up further apart, it may be desirable to count them as two units
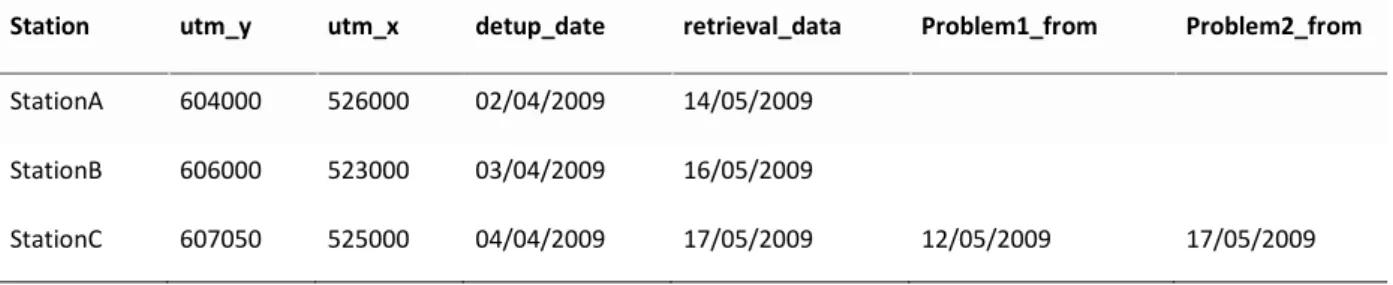
Table 2.3: Example camera trap station table. Station is the camera trap station ID, utm_y and utm_x are station coordinates. setup_date and retrieval_date are the dates the stations were set up and retrieved. Problem1_from and
Problem1_to define malfunctioning dates.
Station utm_y utm_x detup_date retrieval_data Problem1_from Problem2_from StationA 604000 526000 02/04/2009 14/05/2009
StationB 606000 523000 03/04/2009 16/05/2009
StationC 607050 525000 04/04/2009 17/05/2009 12/05/2009 17/05/2009
accumulating effort independently. Therefore, the camera operation matrix can return either the number of operational cameras (if effort is accumulated independently) or an indicator for station operability (if effort is not accumulated independently). The camera operation matrix is used in creating detection histories for occupancy and spatial capture–recapture analyses (see description of the functions detectionHistory and spatialDetectionHistory below).
Data Exploration and Visualization
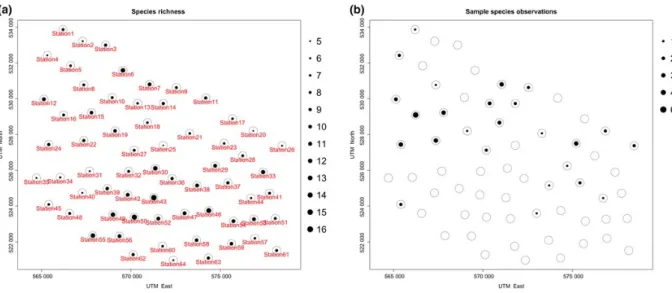
camtrapR can plot maps of species records (number of observed species by station and number of independent detections by species; see Figure 2.1) with the function detectionMaps. The function allows shapefile export for use in gis software. Single-species activity patterns can be visualized in three different ways: as histograms of hourly activity, activity kernel density estimations and radial plots (functions activityHistogram, activityDensity and activityRadial). Two-species activity overlaps (Ridout & Linkie 2009) are estimated and plotted with the function activityOverlap. These functions use code from the packages overlap and plotrix (Meredith & Ridout 2014; Lemon et al. 2015).
Data Export for Occupancy Analyses
Occupancy models are used to gain insight into species habitat associations while accounting for imperfect detection. The function detectionHistory computes species detection/non-detection matrices for use in occupancy models, for example in package unmarked (Fiske & Chandler 2011) or program presence (Hines 2006) by combining the record table created with the function recordTable
and the camera operation matrix created with the function cameraOperation. In the detection/non-detection matrices, rows represent stations and
Figure 2.1: Example maps created with the function detectionMaps. A) Number of observed species, B) Number of independent observation of an example species.
columns survey occasions. Survey occasions consist of one or more days. The matrix cell becomes 1 if a species was detected at a station during an occasion, 0 in case of non-detection, and NA if the station was not operational. Users have complete freedom over occasion start dates and time, occasion length (in days) and the length of the trapping period per station. Occasions can begin on a fixed date, the day the first station was set up or each station's individual setup date (optionally with a buffer between the setup date and the beginning of the first occasion).
Trapping effort by station and occasion can be returned alongside species detection histories for use as a covariate/offset on detection probability. Incomplete occasions (occasions in which cameras were only partly operational) may contain records in the detection/non-detection matrix if effort is returned. Otherwise, any incomplete occasion will cause corresponding detection matrix cells to be NA.
Data Export for (Spatial) Capture–Recapture Analyses
Spatial capture–recapture methods use repeated detections of marked individuals of a species at an array of sampling locations (camera trap stations) to estimate species density while accounting for imperfect detection and movement of individuals about their home ranges (Efford 2004; Royle & Young 2008; Royle et al. 2014). In order to prepare species data for spatial capture–recapture analyses, the function spatialDetectionHistory can build capthist objects as defined in the secr package (Efford 2015), containing information about where (station) and when (occasion) individuals were detected. The camera trap station table, the camera operation matrix and the record table are combined for that purpose. The record table needs to contain individual IDs (see sections 'Individual Identification' and 'Image Data Extraction') and may contain individual covariates (from metadata
tags). The stations' geographic coordinates and station-level covariates are read from the camera trap station table. The camera operation matrix provides information about station operation dates and trapping effort. In creating the capthist objects, we provide the same flexibility regarding occasion length and starting time as in the function detectionHistory. Trapping effort (trap usage) can also be returned in the capthist object. For non-spatial capture–recapture analyses, the function can also return an RMark data frame, containing only individual-by-occasion information without the spatial component.
Creating a Survey Report
The function surveyReport summarizes camera trapping surveys. It returns station operation and image date ranges, the number of trap days (total and by station), observed numbers of species and the number of independent observations by species and station. A zip file containing essential data and tables, detection maps and activity plots can be generated. It also contains an example script for reproducing all of these and for creating the input for occupancy analyses. The summary report and zip file can further be used for data sharing and archiving, for example in online repositories such as the Knowledge Network for Biocomplexity (KNB; https://knb.ecoinformatics.org/).
Conclusion
camtrapR is the first R package to bridge the gap between camera trap data acquisition and the well-developed downstream analytical tools by providing a workflow for camera trap data management, exploration and preparation of subsequent analyses. Its main advantages are flexibility, ease of use, extensive automation of many of the otherwise labour-intensive tasks, and compatibility with software for further analyses of camera trapping data.
camtrapR offers a standardized camera trap data management, and we expect it to be most useful to researchers and practitioners who regularly handle large numbers of camera trap images and wish to generate input for activity, occupancy and/or (spatial) capture–recapture analyses with minimal manual effort. We will keep improving and extending camtrapR functionalities and welcome both feedback and collaborations to further increase the usefulness to its users.
Acknowledgements
All authors thank the German Federal Ministry of Education and Research (BMBF FKZ: 01LN1301A) and Point Defiance Zoo & Aquarium for funding this research. We further thank Peter Lagan, Johny Kissing, Albert Radin and Datuk Sam Mannan of the Sabah Forestry Department and Laurentius Ambu of Sabah Wildlife Department for supporting the fieldwork that generated the sample data set. We are grateful to John Mathai, Seth Timothy Wong, An The Truong Nguyen, Andrew Tilker, Nicolas
Deere, Patrick Lorch, Brent Pease and Azlan bin Mohamed for extensive testing of the package and valuable feature requests during development. In addition, we thank three anonymous reviewers whose comments helped us to improve earlier versions of the manuscript and the package.
References
Burton, A.C., Neilson, E., Moreira, D., Ladle, A., Steenweg, R., Fisher, J.T., Bayne, E. & Boutin, S. (2015). Wildlife camera trapping: a review and recommendations for linking surveys to ecological processes. Journal of Applied Ecology, 52, 675–685.
Chamberlain, S. A, & Szöcs, E. (2013). taxize: taxonomic search and retrieval in R. F1000Research, 2, 191.
Efford, M. (2004). Density estimation in live-trapping studies. Oikos, 106, 598–610.
Efford, M.G. (2015). secr: Spatially explicit capture-recapture models. R package version 2.9.5. http://cran.r-project.org/package=secr
Fegraus, E.H., Lin, K., Ahumada, J.A., Baru, C., Chandra, S. & Youn, C. (2011). Data acquisition and management software for camera trap data: A case study from the TEAM Network. Ecological Informatics, 6, 345–353.
Fiske, I.J. & Chandler, R.B. (2011). unmarked : An R Package for Fitting Hierarchical Models of Wildlife Occurrence and Abundance. Jo