1 SOCIAL EFFICIENCY IN MICROFINANCE INSTITUTIONS: IDENTIFYING HOW
TO IMPROVE IT
JORGE GUTIERREZ-GOIRIA1 LEIRE SAN-JOSE2,3 JOSE LUIS RETOLAZA4
(1) Financial Economics II and HEGOA, University of the Basque Country (UPV/EHU), Bilbao, Spain
(2) ECRI, University of the Basque Country, Bilbao, Spain
(3) FEGReG, University of Huddersfield, Huddersfield, United Kingdom (4) Deusto Business School, Bilbao, Spain
Citation:
Gutierrez-Goiria, J., San-Jose, L., and Retolaza, J. L. (2016) Social Efficiency in Microfinance Institutions: Identifying How to Improve It. Journal of International Development, doi:
10.1002/jid.3239.
ABSTRACT
This article analyzes the determinants for social and economic efficiency in Microfinance Institutions using a Seemingly Unrelated Regression. We find two factors that improve their relative efficiency: legal status and target market; however, age and scale are not clear determinants. The main contribution of this paper is to engage MFIs to achieve the desired social efficiency without giving up economic efficiency as the two can be complementary; moreover, it is possible to be efficient as an NBFI/NGO with small size and low-end target, at least. The paper is a new contribution in line with the so-called paradox of social cost.
2 INTRODUCTION
Microfinance emerged in response to the major lack of access to conventional financial services that affects half the world’s adult population in many different regions (World Bank, 2014). That lack of access stems firstly from barriers that prevent people from accessing the formal financial system, including financial, geographical and social issues and sometimes mere questions of documentation (Beck et al., 2007a, 2007b).
These problems are not new, and various responses to them have been tried in the past, but microfinance seems to be the option with the greatest potential for solving them. It now covers more than 200 million clients, 116 million of them among the extremely poor, i.e. those whose income is less than US$1.25 per day (Reed, 2014).
Since its commencement in Bangladesh and Latin America in the 1970s, the microfinance sector has gradually matured. In the 1990s and the 2000s it grew rapidly thanks to support from international organizations (World Bank, UN, cooperation agencies, etc.) and thanks to its highly positive media image, so that it came to be seen as a new key instrument for overcoming poverty. The UN declared 2005 to be the International Year of Microcredit, and M. Yunus was awarded the Nobel Peace Prize in 2006.
More recently, excessive expectations regarding microcredit, poor results and evidence of malpractice have revealed the need to conduct a more detailed analysis. On the one hand it is assumed that programs of this type are not always positive (Dichter & Harper, 2007), and on the other hand more attention is being paid to gauging social impact and to the need to prevent overindebtedness and malpractice such as that found in Bolivia and Andra Pradesh in India (CGAP; 2010). Some studies (Sainz-Fernández et al., 2015) have analyzed the internal and external factors that have led to the failure of MFIs.
In that context, this paper looks at the importance of measuring the economic and social efficiency of these organizations and the compatibility between them, in an effort to distinguish between different practices based on a broad sample of MFIs. In microfinance, as in other fields, there are doubts about the opposition between profit and attention to social concerns -a question sometimes referred to as the paradox of social cost (Pava & Krausz, 1996)- and the evidence is not conclusive in this regard. The paper seeks to fill a gap, including a joint study of social and economic efficiencies that has not been previously conducted, and extending the focus to a larger number of MFIs (over 400 all over the world). It proposes a new, more comprehensive approach to the concept of social efficiency and outreach, from the viewpoint of intermediation. Our findings indicate that there is a positive link between economic and social efficiency, and that issues such as legal status and size are important in achieving greater efficiency. The paper provides evidence that it is possible to work on a smaller scale and with low-income populations without thereby negatively affecting efficiency. We develop a model in which the social and economic efficiencies are taken into account jointly, using Stata and the Seemingly Unrelated Regression technique.
The paper is organized as follows: the following section sets the problem in context and presents earlier work in the relevant field. Then the initial hypotheses and goals of the study are set out. The next section details the sample studied, the variables involved, and the method used. Finally, we present our findings and draw some conclusions.
3 BACKGROUND & SITUATION
A substantial body of literature has emerged on bank efficiency (Berger & DeYoung, 2001; Mester, 1996). Some of the studies dealing with this issue focus on the profit function (e.g. Berger et al., 1993), others take into account the effect of types of financial entity (banks vs. saving banks) (e.g. Berger & DeYoung, 1997; San-Jose et al., 2014), others estimate bank efficiency by focusing on differentiations between countries (e.g. Altunbas et al., 2001; Bonin et al. 2005) or by taking into account risk preferences (e.g. Mester, 1996). But the most common element of bank efficiency literature is that it is focused on cost-benefit analysis (Berger & DeYoung, 2001), i.e. that it takes an economic perspective. Subsequently, the findings tend not to be conclusive, perhaps indeed precisely because the efficiency analysis is based on economics (e.g. Berger & DeYoung, 2001) instead of social or overall efficiency (San-Jose et al., 2014). This needs to be recognized explicitly in empirical models of some of the financial institutions such as MFIs, which are oriented towards social value creation; social value outputs such as extending of loans, number of clients, and extension of target clients such as women or economic sustainability need to be included as social or overall efficiency determinants. All these items are taken into consideration in this paper. Microfinance requires double efficiency: economic and social, and they have different natures. On the one hand, social efficiency is related to the effectiveness and final objectives of the institution. On the other hand, economic efficiency is necessary, but instrumental, to ensure the sustainability of the initiative.
So although there is a large body of research on bank efficiency (Altunbas et al., 2001; Berger & DeYoung, 2001; Bonin et al., 2005; Mester, 1996; San-Jose et al., 2014), research in the field of microfinance is less abundant, particularly research taking into account not only economic but also social efficiency (e.g. Gutierrez-Nieto et al., 2009). However it is both necessary and useful to extrapolate advances in banking efficiency to the case of the microfinance sector, which blends social issues with the needs for sustainability inherent in a financial organization. One of the reasons why a specific study is required is that the microfinance sector has its own, distinctive characteristics. Among other aspects, the fact that the organizations involved are smaller than conventional banks means that their costs are relatively higher, and this problem is exacerbated by the fact that they deal with low-income clients and small-scale services (Conning, 1999; Lützenkirchen & Weistroffer, 2012). This initially led to the very viability of MFIs been called into question, but reality shows that it is possible to work in an economically sustainable fashion under these conditions, even when social goals are always given preference over economic goals, due precisely to the social nature of MFIs.
Once potential viability has been confirmed, one of the most widely covered issues in the relevant literature is the conflict between social and economic goals. This question was already posed in the 90s in broader terms, and called the paradox of social cost. Given a sample of twenty-one empirical studies of this relationship in the 90s, Pava & Krausz (1996) found that twelve studies showed a positive association between financial performance and social concerns, while eight of them found no association at all, and only one showed a negative correlation. They conclude that the traditional economic assumptions about a negative relationship between financial performance and social corporate responsibility are difficult to maintain. Subsequent studies continue this line of work (Orlitzky et al., 2003, for example), which does not yet have a clear answer. In the case of microfinance, even if it is accepted that projects are viable under some conditions, it is called into question whether it is possible to remain so while working with certain social profiles (e.g. catering for the poorest sectors of the population) or whether conflicts between different goals are likely to emerge (Armendariz &
4 Szafarz, 2009; Conning, 1999; Cull et al., 2007, Gutiérrez-Goiria & Goitisolo, 2011, Hermes et al., 2011; Quayes, 2012). This discussion is influenced by the delimitation of social goals themselves, as reflected in the indicators used to measure their fulfillment.
Given the wide variety of practices involved, and evidence from a sector where social and financial goals clearly coexist and may potentially come into conflict with each other, it is appropriate to look at the issue in terms of both economic/financial and social efficiency. This is the line taken by Gutiérrez-Nieto et al. (2009) and subsequently followed in other efficiency studies in this sector (Widiarto & Emrouznejad, 2015).
First of all, from an economic/financial viewpoint the problems faced are similar to those of other financial organizations. Regardless of whether a production or intermediation approach is taken, they can be tackled as per San-Jose et al. (2014), by studying the capability for turning the funds collected into bigger profits and lower risks.
In the case of social goals the issue is somewhat more complex. Broadly speaking, such goals can be measured by either of two approaches:
by measuring outreach, which involves studying the practical results obtained by the MFI in terms of what is understood by social priorities (favoring the poorest or women, reaching out to large numbers of people excluded from the conventional system, providing a variety of services, etc.); or
by measuring social performance, which to some extent includes the above approach, and involves a detailed study of how the activities of an MFI affect society as a whole, including its clients, its employees, other stakeholders and aspects related to its modus operandi (processes), ethics, and the environment.
Although the latter approach is being used more and more (it is broader as it also analyzes other effects of microfinance), our study here follows other similar studies and focuses on the outreach approach, which is rich in terms of obtaining awareness of the weight and importance of the work done by MFIs.
In regard to the concept of outreach, Gulli (1998) draws a frequent distinction between the “scale” of outreach, i.e. the total number of people dealt with, and its “depth”, a concept associated more with qualitative aspects such as the level of poverty of clients or the percentage of clients who are women1. Schreiner (2002) proposes as many as six dimensions of outreach, including scale and depth along with aspects such as the variety of services on offer and durability. The MIX Market database contains a section with more than 20 outreach indicators. Issues concerned with outreach and the results obtained by MFIs should therefore include such points as the ability to maintain a broad portfolio of loans (in monetary terms and in regard to the number of clients served), the ability also to offer other services such as deposits, orientation towards poorer or worse-off segments, and not neglecting economic aspects, that provide assurances that schemes will be able to continue.
Efficiency studies are not often conducted in the field of microfinance, but some examples can be found, covering a variety of aspects and conflicts using different approaches. Thus, Hermes
et al. (2011) find evidence of conflict between efficiency and depth of outreach, understood as
1
This depth has been measured in many different ways: García & Olivié (2003) analyze 27 different studies on the matter.
5 granting smaller loans and working with a higher percentage of women, based on data for 1997-2007.
In a study covering 30 Latin American MFIs, Gutiérrez-Nieto et al. (2007) consider the need to measure social efficiency as well as economic efficiency, and find no conflict between the two. Their study shows the importance of legal status, and finds that NGOs are the most socially efficient form. The influence of legal status is also examined in other studies: Haq et al. (2010) find it to be significant in a study of 39 MFIs from various regions, and also find that NGOs are the most efficient form in terms of output and meeting both types of goal. By contrast, Servin et al. (2012) take a technical efficiency approach in a study focused on Latin America and find that NGOs and cooperatives obtain worse results than banks and NBFIs (Non Bank Financial Institutions).
Other studies look at different characteristics over and above the type of institution, such as age or size. In a study focused on Vietnam, Nghiem et al. (2006) analyze, among other aspects, the influence of the age of MFIs using an approach based on output, and find that maturity does not bring greater efficiency. Hartarska et al. (2012) examine issues such as the size of MFIs for the case of cooperatives, and find a positive link between efficiency and size in terms of assets. Another recent study looks at the specific characteristics of Islamic banking in terms of social and economic efficiency (Widiarto & Emrouznejad, 2015).
As can be seen, there is growing -but still limited- concern for efficiency in microfinance. However, there is no consensus about the best way to introduce social issues and so define social efficiency. Furthermore, it is found, in studies conducted to date, the absence of a joint study or model that tries to explain the variations in both efficiencies according to different factors.
PROBLEM, GOALS & HYPOTHESIS
As stated above, MFIs seek to cater for a need to access finance not covered by conventional systems. However, not all MFIs work in the same way, and they are not necessarily all equally efficient. They must pursue financial goals, but above all social or overall goals, so it is important to analyze their social efficiency.
This paper seeks to tackle the problem of detailing their level of social efficiency, its relationship with the economic efficiency, and the factors that influence both of them, from an international perspective. No such analysis has been conducted previously.
To fill this gap in the relevant literature, we seek to answer the following questions: 1.- Are economic and social efficiency compatible within the same MFI?
As can be seen in the relevant literature (Conning, 1999; Cull et al., 2007, Gutiérrez-Goiria & Goitisolo, 2011, Hermes et al., 2011; Quayes, 2012), there is no consensus as to whether there is a conflict between social and financial goals, but it is frequently alleged that issues such as working on a small scale and with low-income segments of the population may entail problems for economic/financial sustainability (Conning, 1999; Lützenkirchen & Weistroffer, 2012). This potential conflict is therefore studied first, and to that end we seek to validate Hypothesis 1:
6 2.- Are some types of MFI more efficient than others? If so, what are the distinctive characteristics of social and economic efficiency in MFIs?
The idea is to see whether existing data can be used to make recommendations for managers or investors as to what type of MFI is best suited to working efficiently. According to the background and previous studies, we analyze what we consider to be the four main characteristics, in an attempt to determine what type of MFI is most efficient.
2a: Does legal status influence social and economic efficiency?
Given their markedly social orientation, NGOs and MFIs can be expected to have results that are different from those of banks and other financial institutions, but in any event it must be checked whether points such as working more closely with low-income populations offset their lesser outreach in terms of number of customers and large loan portfolios, where larger institutions such as banks have more potential. The influence of the legal status of organizations has been examined in earlier studies, with varying results (Gutiérrez-Nieto et al., 2007; Haq. et al., 2010; Serin et al., 2012). The hypothesis drawn up in this case are the following:
H2a: The legal status adopted by an MFI entails significant differences in terms of social
efficiency
H´2a: The legal status adopted by an MFI entails significant differences in terms of
economic efficiency
2b: Does size influence social and economic efficiency?
The doubts raised by working on a small scale when it comes to studying the efficiency and potential of MFIs have already been mentioned. Here the idea is to gauge whether their small size may compromise their potential for working efficiently, as suggested in studies such as that of Hartarska et al. (2012). The hypothesis is the following:
H2b: There are significant differences in social efficiency depending on the size of MFIs
H´2b: There are significant differences in economic efficiency depending on the size of
MFIs
2c: Does the target market influence social and economic efficiency?
Working with the poorest segments of the population may be in line with the social goals of MFIs, but it may also cause problems because it means working with smaller amounts and with potentially less solvent clients (Conning, 1999; Hermes et al., 2011; Lützenkirchen & Weistroffer, 2012). To examine the extent of this problem we use hypothesis H2c and H´2c:
H2c: There are significant differences in social efficiency depending on the target market
of MFIs
H´2c: There are significant differences in economic efficiency depending on the target
market of MFIs
2d: Does the age of an MFI influence its social and economic efficiency?
Maturity and experience may help an organization to work more efficiently, especially in financial terms, as entry costs and initial lack of experience can be corrected. On the other hand, it is often suggested that some MFIs may suffer from mission drift over time, which may jeopardize their social orientation (Armendariz & Szafarz, 2009). These questions can be
7 checked out in our broad sample, which includes organizations of different ages, via this last hypothesis:
H2d: There are significant differences in social efficiency depending on the age of MFIs
H´2d: There are significant differences in economic efficiency depending on the age of
MFIs
Finally, we consider whether it is possible to represent jointly the determinants of social and economic efficiency, using a multivariate analysis.
SAMPLE, VARIABLES AND METHOD EMPLOYED Sample
To test the hypotheses drawn up, we use the group of MFIs on the MIX Market database. Our sample includes a total of 403 MFIs from different areas and with different ages and legal statuses, representing the diversity and heterogeneity of MFIs and their characteristics (see Appendix 1). They come from a total of 80 medium and low income countries in six different geographical areas: Sub-Saharan Africa, Latin America and the Caribbean, Eastern Europe and Central Asia, the Middle East and North Africa, East Asia and the Pacific, and South Asia. The Microfinance Exchange Market (MIX Market) portal, from which the data was obtained, contains information on more than 2000 MFIs. It is supported by public and private institutions that work in development and financial inclusion, and is a key tool for bringing MFIs into contact with investors and for supporting research and knowledge in the sector. Its data is frequently used in studies of this type (Gutiérrez-Nieto et al., 2007; Haq. et al., 2010; Hartarska
et al., 2012; Hermes et al., 2011; Sainz-Fernández et al., 2015; Servin et al., 2012; Widiarto & Emrouznejad, 2015).
The data in the sample is from the end of 2014, and refers to values at December 31, 2012. After eliminating those MFIs with low quality information according to the MIX Market itself, and those whose data is incomplete, a broad sample remains of 403 MFIs from different areas and with different ages and legal status2.
Variables used in the DEA: inputs & outputs
Table 1. Inputs & Outputs in the efficiency study
Inputs Outputs
Economic efficiency Equity Profit
External funding Risk
Social efficiency Equity Loans
External funding Number of clients Number of female borrowers
Economic sustainability
2
The MIX Market classifies MFIs on a scale of 1 - 5 ”diamonds” in line with the quality of the information that they provide. Levels 1 & 2 are MFIs with a visible profile that provide data on clients and products, while levels 3-5 provide progressively more information on annual accounts, audited data and ratings. Appendix 1 provides more information about the sample.
8 The inputs and outputs used in economic and social efficiency models and the logic underlying them are outlined below.
Equity: This variable is lifted directly from the database. Following San-José et al. (2014), it is used in terms of own investment. It is taken as an input for establishing both economic and social efficiency, as it represents the amount of money available for achieving both financial and social goals.
External funding: This variable is calculated from the sum of the deposits and borrowings received. It refers to investment made with external funds. It is taken as an input for both economic and social efficiency, and represents money from outside sources. We believe that it needs to be included as an input so as to reflect the total amount of funds invested in MFIs and to establish their overall efficiency levels.
Profit: Profit in dollars is included as an output variable in economic efficiency only, as it represents the monetary units obtained. It is not a component of social efficiency because it does not constitute part of its relevant goals (San-Jose et al., 2014). Net profit is re-scaled to prevent their being negative numbers, thus avoiding the potential effect of losses on output-focused efficiency. The minimum value (-US$3,444,375.92) is taken as the starting point (0), so the value of the profit variable is calculated by adding 3,444,375.92 to each profit figure.
Risk: From an economic viewpoint the profit obtained is a necessary output, but is insufficient in itself if the risks taken and the traditional risk-return link are not considered. The model works with positive outputs, so to measure risk the output taken is the secured amount of the loans granted (i.e. that which is not at risk). The variable is thus calculated by multiplying the decimal fraction of secured loans (1 – loans with risk as a decimal fraction) by the loan portfolio. The “loans with risk” (30 days) variable has been used previously in Hartarska et al. (2012) and Widiarto & Emrouznejad (2015).
Loans: Loan portfolios are taken directly from the database. This variable is used as an output in numerous studies, including Gutiérrez-Nieto et al. (2007, 2009), Haq et al.
(2010), Hartarska et al. (2012), Hermes et al. (2011), and San-Jose et al. (2014). The reasoning behind its inclusion in social efficiency is that the mission of MFIs is to grant as many loans as possible and thus increase their outreach. Loans are therefore positively rated as an output in terms of social efficiency.
Number of clients: This social efficiency-related output is calculated by adding up the number of borrowers and the number of depositors. It thus covers both the scale of outreach as mentioned by Gulli (1999) and Schreiner (2002), understood here as the ability to reach out to a large number of people, and variety of products as included by Schreiner (2002). Moreover, under equal conditions a larger number of borrowers indirectly means lower average loan size, which enables this widespread measurement of depth of outreach also to be covered (as also included by Gulli, 1998 and Schreiner, 2002). Widiarto et al.
(2014), Hartarska et al. (2012), and Nghiem et al. (2006) use the number of borrowers in their studies. Nghiem et al. (2006) also use the average loan size.
Number of female borrowers: This variable is calculated on the basis of the percentage of women in the total number of borrowers. It is included as a variable in social efficiency outputs. As already mentioned, it is another widespread indicator for measuring depth of outreach. It is used as a total or a percentage in Gutiérrez-Nieto et al. (2007), Hartarska et al. (2012), Hermes et al. (2011), and Nghiem et al. (2006) among others. Apart from the
9 number of clients, social efficiency also needs to reflect some characteristics of clients, e.g. the fact that they are women. Evidence that development and income indicators are lower for women as a group, and the need to direct actions towards improving the situation, are widely accepted, and constitute one of the foundations of the microfinance movement. That is why this is positively rated as a social efficiency output of each MFI.
Economic sustainability: This output variable is calculated on the basis of net profit on the assumption that sustainability is attained by balancing income and expenditure, so this output is not given any greater value from this point on. The idea is to see whether each MFI fulfils the “length of outreach” aspect proposed by Schreiner (2002). To that end, and in order to take account of sustainability only beyond a certain point, the scale is transformed here to avoid negative numbers, and the minimum value (-US$3,444,375.92) is taken as the starting point (0).
The variables used to test the hypotheses put forward above are listed below.
The categories selected and the relevant values are based on the MIX Market database itself3: Type of MFI: Bank, Credit Union / Cooperative, Non-Bank Financial Institution (NBFI), NGO, others/not available4. Used by Gutiérrez Nieto et al. (2007), Haq et al. (2010), Hermes et al. (2011), and Servin et al. (2012).
Scale: Small, if the gross loan portfolio is below $2 million ($4 million in the case of Latin America); Medium, when the portfolio is between $2 million and $8 million ($4 million and $15 million in Latin America); Large, when the portfolio is more than $8 million ($15 million in Latin America). Used by Widiarto & Emrouznejad (2015) among others. We also have used the Gross Loan Portfolio (as a continue variable) for the joint model.
Target market5: Low-end (depth of less than 20% or average loan amount below US$150); Broad (depth between 20% and 149%); High-end (depth between 150% and 250%); Small business (depth greater than 250%). Used by Widiarto & Emrouznejad (2015). We use the quotient of the average loan balance per borrower and gross national income per capita (as a continue variable) for the joint model.
MFI age: Young (less than 8 years old)6; Mature (more than 8 years old). Used in similar studies by Hartarska et al. (2012), Nghiem et al. (2006), and Widiarto & Emrouznejad (2015). We use the years of operations in the case of the regression.
Method
There have been several studies of MFIs in the past 10 years that analyze efficiency using a non-parametric technique called Data Envelopment Analysis (DEA), which enables quantitative output to be incorporated into efficiency analysis (Gutierrez-Nieto et al., 2007; Hermes et al., 2011). This advantage added to the fact that it is not necessary to define a production function in advance, has established DEA as the most widely used non-parametric technique in this type of research (Goddard et al., 2007). It is based on measuring relative efficiency, which can be
3 For a more detailed description of each category and the related values, see the MIX Market website (www.mixmarket.org).
4
This category includes three MFIs classed as Rural Banks, and those for which this information was missing. 5
Target Market is used by MIX Market to indicate the type of clients of the MFI, according to the average loan size. Depth is calculated as the quotient of the average loan balance per borrower and gross national income per capita. The lower this quotient is (calculated in terms of gross national income so as to permit comparisons between countries) the lower the income of the population worked with is understood to be.
6
10 traced back to Farrell (1957) and was developed by Charnes et al. (1978) in the financial area, with business efficiency being defined by considering multiple inputs.
The study presented in this paper uses EMS (Efficiency Measurement System) software, which employs a scale of 100. The further a microfinance institution (considered as a DMU) is from the frontier (which is determined by the group of decision-making units that obtain maximum efficiency) the more the value will fall between 100% and 0%. This method provides a measure of relative, but not absolute, efficiency. In this way the most efficient DMUs compared with the selection under consideration are identified. This analysis works best when, as in our case, it can be performed on the entire population and not just a sample of it (San-Jose et al., 2014).
Once efficiency calculations have been made, the usual calculations in descriptive statistics are included (means, deviations, correlations), and the equality of means is tested for in accordance with different factors and categories. Having determined that homogeneity of variance cannot be assumed in most of the groups obtained, we have opted for t-tests for equality of means on independent samples using SPSS. These tests, which do not require homoskedasticity, reinforce the requirements for significance and require groups to be taken two by two for each categorical variable.
Finally, we use Stata software to develop a Seemingly Unrelated Regression model, with Feasible Generalised Least-Squares (FGLS). This method allows us to control the joint effect of all the previous variables (and other variables not included) at the same time.
Seemingly Unrelated Regression model was developed by Zellner (1962; 1963). This technique estimates several regression models, taking into account the correlation between the error terms. It is specifically useful when regressions are related, the equations do not have the same set of explanatory variables, and errors associated with the dependent variables (social and economic efficiency in our case) are significantly correlated.
According to Zellner (1962), the regression coefficient estimators obtained this way are more efficient than those obtained by an equation-by-equation application of least squares. The gain in efficiency can be large if, as in our case, disturbance terms in different equations are highly correlated.
RESULTS
Economic and Social Efficiency at MFIs
One of the questions that we have sought to answer is whether or not there is a link between economic and social efficiency at MFIs on an international level, with the aim of providing new evidence to the paradox of social cost. As mentioned above, this is an issue that continues to generate controversy.
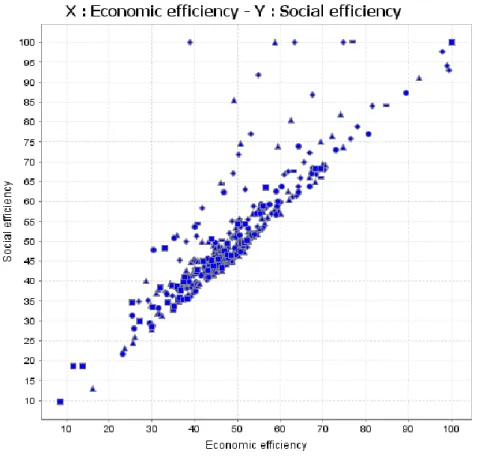
As can be seen in Figure 1, we find a positive, significant correlation between social and economic efficiency (r=0,899) at MFIs. However, we also find 9 MFIs whose relative social efficiency is markedly higher than their economic efficiency; eight of them are NGOs or NBFIs with social efficiency levels in excess of 80% but significantly lower economic efficiency levels. This suggests that at some organizations with markedly social profiles economic results are merely instrumental, and that no value is assigned to financial results above required for the survival of the organization. From a social perspective these may possibly be exceptional cases of good practices on which attention should be focused.
11 Figure 1. Economic and social efficiency at all 403 MFIs studied
Our first hypothesis (H1: There is a negative correlation between social and economic
efficiency) must therefore be rejected, and we can rule out the existence of tension or conflicts leading to increases in one type of efficiency negatively affecting the other.
To analyze relatively efficient types of MFI, we examine the group of most efficient organizations and find certain distinguishing characteristics in comparison to the full sample. Beginning with social efficiency, Table 2 shows the composition of the 26 most relatively efficient MFIs (with efficiency levels in excess of 80%), i.e. those which are most socially efficient as per the input/output relation given above on the dates analyzed.
Table 2. Characteristics of the full group and the most socially efficient MFIs
Legal Status Efficient (%) Total (%) Scale Efficient (%) Total (%) Target Market Efficient (%) Total (%) Age Efficient (%) Total (%)
Bank 3.8% 10.9% Small 46.2% 25.1% Low end 65.4% 32.8% Young 34.6% 22.3%
Credit Union 7.7% 15.6% Medium 26.9% 29.3% Broad 30.8% 56.6% Mature 65.4% 76.2%
NBFI 46.2% 35.7% Large 26.9% 45.7% High end 3.8% 6.7% Not
available 1.5% NGO 34.6% 34.0% Small business 4.0% Others/Not available 7.7% 3.7% Total 100.0% 100.0% 100.0% 100.0% 100% 100.0% 100.0% 100.0%
As can be seen in Table 2, there is a strikingly low proportion of banks and cooperatives among the most socially efficient organizations (3.8% and 7.7% respectively), while there are more
12 NGOs and in particular NBFIs in the group than is proportional to their total number in the full sample (they account for 81% of the most efficient organizations and 70% of the total number of MFIs studied). Another noteworthy characteristic of this group of most efficient MFIs is the higher relative proportion of small and young organizations when we compare the efficient ones and the total. The opposite can be said in the case of large, mature ones. Finally, in a key aspect for showing ability to cater for low-end populations, we find that two thirds of the 26 MFIs in this group deal with such populations and low average loan amounts, while only one third of the total of 403 MFIs studied actually deal with this segment of the population.
By using the same economic efficiency criterion (levels of more than 80%) we identify a smaller group of 16 MFI, all included in the group of 26 most socially efficient MFIs already mentioned. These 16 show a pattern very similar to that described above for the group of 26, which reinforces the idea that social and economic aspects are aligned, and shows that it is possible to work on a basis of criteria of social interest without giving up on institutional sustainability.
Efficiency in relation to the characteristics of MFIs
Table 3 shows the results as regards social and economic efficiency for the full sample of MFIs and for the various groups and categories.
In overall terms the averages and deviations found for both types of efficiency are similar for the full sample of MFIs (an average of 50.90 for social and 49.38 for economic efficiency). When organizations are grouped according to different criteria, however, the efficiency results are more variable. Average social efficiency, for instance, varies from 35.85% in MFIs working with higher-income clients (small businesses) and 56.49% for small scale MFIs. This leads us to check for possible differences introduced by the various categories and variables analyzed. Table 3. Social and economic efficiency: characteristics of MFIs
Determinant Number of MFIs Social efficiency Mean (Std. Dev.) µ (σ) Economic efficiency Mean (Std. Dev.) µ (σ) Legal status Bank 44 43.36 (14.61) 41.67 (15.29)
Credit Union / Cooperative 63 50.54 (13.63) 49.53 (14.14)
NBFI 144 51.11 (16.51) 50.03 (15.35) NGO 137 52.75 (14.47) 50.83 (11.90) Others-Not available 15 55.70 (18.10) 51.85 (15.37) Scale Small 101 56.49 (19.40) 54.75 (18.25) Medium 118 49.21 (15.02) 47.34 (13.64) Large 184 48.92 (12.33) 47.74 (11.16) Target Market Low end 132 55.35 (18.69) 51.02 (15.90) Broad end 228 49.25 (12.81) 49.18 (12.95) High end 27 52.06 (14.43) 51.31 (15.75) Small business 16 35.85 (7.17) 35.48 (6.18) Age Young 90 53.45 (19.02) 51.22 (17.72) Mature 307 50.08 (14.24) 48.73 (13.07) Not available 6 54.78 (13.74) 55.18 (13.36) Total 403 50.90 (15.46) 49.38 (14.26)
13 As mentioned in the Method section above, Student’s t-tests were conducted on pairs from different groups (16 for each type of efficiency) to examine whether intra-group differences were significant. The results are shown in Table 4.
Table 4. t-tests for comparison of means according to categories7
Legal Status Social efficiency Difference in means (t value) Economic efficiency Difference in means (t value) Banks-Credit Coop. -7.180* (-2.571) -7.858** (-2.698) Banks-NBFIs -7.758** (-2.987) -8.359** (-3.172) Banks-NGO -9.389** (-3.717) -9.162** (-3.637) Credit Coop.-NBFIs -0.578 (-.263) -.501(-.229) Credit Coop.-NGOs -2.209 (-1.044) -1.305 (-.636) NBFIs-NGOs -1.631 (-.882) -0.803 (-.491) Scale Social efficiency Difference in means (t value) Economic efficiency
Difference in means (t value) Small-Medium 7.281** (3.066) 7.416** (3.359) Small-Large 7.580** (3.552) 7.014** (3.519) Medium-Large .299 (.181) -.402 (-.268) Target Market Social efficiency Difference in means (t value) Economic efficiency
Difference in means (t value) Low end-Broad 6.103** (3.327) 1.848 (1.135) Low end-High end 3.288 (1.022) -0.286 (-.086) Low end-Small business 19.502** (8.059) 15.540** (7.494)
Broad-High end -2.815 (-.970) -2.134 (-.677) Broad-Small business 13.399** (6.759) 13.692** (7.752) High end-Small business 16.214** (4.906) 15.826** (4.651)
Age Social efficiency
Difference in means (t value)
Economic efficiency
Difference in means (t value) Young-Mature 3.369 (1.558) 2.486 (1.236)
**,* stand for statistical significance at 1% and 5%, respectively.
As the Table 4 shows, there are significant differences between the average values. This evidence provides some information about the determinants of efficiencies but, in order to test the hypotheses, we have also developed a multivariate analysis, where all variables are included.
Joint Multivariate Analysis of determinants of Social & Economic Efficiency
As we pointed out in the Method section, a further analysis has been developed to present a multivariate analysis and test the hypotheses in a robust way.
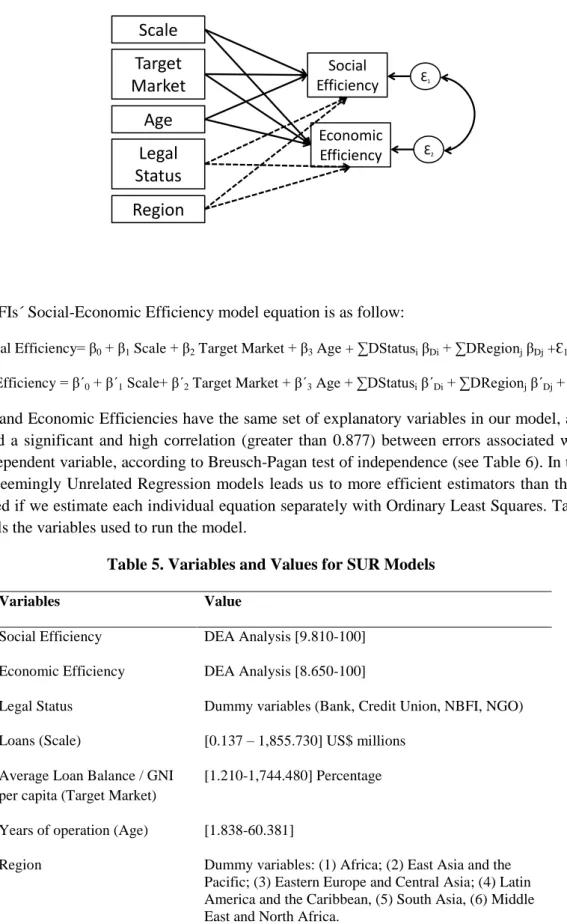
We propose a model with two dependent variables (Social efficiency and Economic efficiency) and some independent variables (Legal Status, Assets, Average Loan, Years of Operation, and Region) with these two equations considered as a system (see Figure 2).
7
14 Figure 2. MFIs´ Social-Economic Efficiency model
Target
Market
Age
Scale
Social Efficiency Economic Efficiency Ɛ1 Ɛ2Legal
Status
Region
The MFIs´ Social-Economic Efficiency model equation is as follow:
Social Efficiency= β0 + β1 Scale + β2 Target Market + β3 Age + ∑DStatusi βDi + ∑DRegionj βDj +Ɛ1
Econ. Efficiency = β´0 + β´1 Scale+ β´2 Target Market + β´3 Age + ∑DStatusi β´Di + ∑DRegionj β´Dj + Ɛ´1
Social and Economic Efficiencies have the same set of explanatory variables in our model, and we find a significant and high correlation (greater than 0.877) between errors associated with each dependent variable, according to Breusch-Pagan test of independence (see Table 6). In this case, Seemingly Unrelated Regression models leads us to more efficient estimators than those obtained if we estimate each individual equation separately with Ordinary Least Squares. Table 5 details the variables used to run the model.
Table 5. Variables and Values for SUR Models
Variables Value
Social Efficiency DEA Analysis [9.810-100]
Economic Efficiency DEA Analysis [8.650-100]
Legal Status Dummy variables (Bank, Credit Union, NBFI, NGO)
Loans (Scale) [0.137 –1,855.730] US$ millions
Average Loan Balance / GNI per capita (Target Market)
[1.210-1,744.480] Percentage
Years of operation (Age) [1.838-60.381]
Region Dummy variables: (1) Africa; (2) East Asia and the
Pacific; (3) Eastern Europe and Central Asia; (4) Latin America and the Caribbean, (5) South Asia, (6) Middle East and North Africa.
15 As some previous studies show (Gutiérrez Nieto et al., 2009, Widiarto & Emrouznejad, 2015), microfinance has developed differently depending on the geographical area and context. The case of Latin America and the Caribbean show other characteristics and patterns of variability, which have even led to change some criteria for MIX Market´s classification in this case, as we have seen. According to this, we have tested the model jointly for All Regions (model 1, see Table 6) and for All Regions except Latin America and The Caribbean (model 2, see Table 6). This last model (2) can be considered as a reference, and it fits better. The model explains 23.76% of the variability of social efficiency, and 23.57% of the variability of economic efficiency.
In addition to that, we find that, as Figure 1 suggested, there is a positive connection between economic and social efficiency. They can be mutually reinforcing, and we find that all the variables (legal status, scale, average loan and age) are related to both efficiencies in the same direction. Regarding legal status, banks are clearly associated with lower values of economic and social efficiency, while NGOs obtain the highest values. In the case of scale, higher Loan Portfolios are associated with greater economic and social efficiency. The model shows that higher amounts of average loans lead to lower efficiency in both cases, and the same negative effect can be found in the case of years of operation. Therefore the model shows that social and economic performance can increase together, and that it is possible to represent jointly the determinants of social and economic efficiency, by using a multivariate analysis.
To sum up, the model gives us a more comprehensive and joint explanation of the relations between variables and efficiencies, and between both types of efficiencies too. The results allow us to test the hypothesis in a robust way.
16 Table 6. Seemingly Unrelated Regressions MFI Social-Economic Efficiency
Variables/Models1 (1) (2)
Scale_Loans 0.019*** 0.014
Target Market_Average Loan -0.027*** -0.025***
Age_Years -0.265*** -0.606***
LegalStatus Note 1 Note 1
Bank
Credit Coop 12.058*** 10.553**
NBFI 10.027*** 13.935***
NGO 13.765*** 20.583***
Region Note 2 Note 2
Africa
East Africa and Pacific -2.086 -4.307
Eastern Europe and C.A. -5.603** -6.719**
Latin America -7.497***
Middle East and North Africa
-18.103*** -19.895***
South Asia -4.450 -5.117
Constant 50.968*** 53.047***
Social Efficiency RMSE 14.065 16.153
Social Efficiency R2 15.75%*** 23.76%***
Scale_Loans 0.017*** 0.014*
Target Market_Average Loan -0.021*** -0.021***
Age_Years -0.263*** -0.682***
Legal Status
Bank Note 1 Note 1
Credit Coop 11.981*** 10.908**
NBFI 9.224*** 12.982***
NGO 12.409*** 16.362***
Region
Africa Note 2 Note 2
East Africa and Pacific 2.392 0.716
Eastern Europe and C.A. 4.419* 3.116
Latin America 1.843
Middle East and North Africa
-9.405* -9.544*
South Asia -5.380 -5.898
Constant 42.149*** 45.946***
Economic Efficiency RMSE 13.134 14.339
Economic Efficiency R2 14.26%*** 23.57%***
Breushc-Pagan test of
Independence (Chi2)
0.912*** 0.877***
n 384 182
*Statistically significant at p < 0.1, ** statistically significant at p < 0.05 and *** statistically significant at p < 0.01
(1): Model (1) includes all the regions. Model (2) includes all regions except number (4): Latin America and the Caribbean.
Note 1: Bank is the first dummy that the model takes as a reference. The rest of legal status values have significant and positive differences as can be seen.
Note 2: Africa is the first dummy for Region that the model takes as a reference. The rest of Regions take values according to that.
17
Determinants of Social & Economic Efficiency: Legal Status of MFIs
H2a: The legal status adopted by an MFI entails significant differences in terms of social
efficiency
H´2a: The legal status adopted by an MFI entails significant differences in terms of
economic efficiency
As can be seen from Table 3, NGOs, NBFIs and cooperatives obtain better results than banks in both types of efficiency, and the differences in the mean figures are significant in these cases (see Table 4). The model reinforces this point and shows significant differences that could go from 9 to 20 percentage points of extra social and economic efficiency when the MFI is not a bank (see Table 6). The differences are higher in the case of NGOs.
Hypothesis H2a and H´2a cannot therefore be rejected. This means that legal status is a
determining factor of economic and social efficiency. It also brings to light the difficulties found by microfinancing banks compared to other organizations as regards efficiency. It is not impossible for banks to work efficiently (there is a bank among the group of the most efficient organizations), but the study shows that this is difficult for banks as a group, even though they are highly relevant in terms of their large size.
Determinants of Social and Economic Efficiency: Scale
H2b: There are significant differences in social efficiency depending on the size of MFIs
H´2b: There are significant differences in economic efficiency depending on the size of
MFIs
As indicated above, scale has long been associated with various problems of sustainability for MFIs. However, our univariate study clearly shows significantly greater efficiency among smaller organizations as regards both social and economic issues (see Tables 3 and 4). From a certain size (medium and large) upwards the differences cease to be significant. The model shows a different trend, with positive coefficients that, even if they are not significant in every case, suggest that an increase in size can lead to a higher efficiency.
In any event it must be taken into account that even the smallest MFIs in the sample have shown some degree of maturity, as evidenced by the very fact that they appear on the MIX Market platform, and apply a reasonable standard of data and indicator monitoring (most newer, less expert MFIs are not included in this database). Even so, these results show that it is possible for organizations of modest size to work efficiently and sustainably (in the MIX Market “small” MFIs are defined as those with a maximum loan portfolio of $2 million, or $4 million in Latin America).
In short, we don´t find clear evidence of the effects of size. Small organizations as a group are relatively more efficient, but it might be due to other joint effects. A non-linear relation could provide an explanation to these results too. So H2b and H´2b are rejected, and size does not
18
Determinants of Social and Economic Efficiency: Target Market
H2c: There are significant differences in social efficiency depending on the target
markets of MFIs
H´2c: There are significant differences in economic efficiency depending on the target
markets of MFIs
As indicated above, the extent to which organizations work with low-end populations is usually measured through the average loan amount, which is weighted by per capita income to enable comparisons between countries to be made. Lower average amounts are associated with lower-income borrowers.
As can be seen in Table 3, the MFIs that work with the largest loan amounts (those granted to small businesses) are clearly the least socially and economically efficient, as they show a significant gap with all other groups (see Table 4). By contrast those MFIs that work with low-end borrowers obtain the best average results in terms of social efficiency, and economic efficiency results very similar to those of the best group for this aspect (high-end).
The model shows the same trend, and the negative and significant beta coefficients imply that an increase in the average loan is associated with a decrease in economic and social efficiencies (see Table 6).
No evidence is therefore found to support the idea that working with lower-income borrowers entails problems for efficiency.
Hypothesis H2c and H´2c are not rejected, so the target market is an influential variable for
economic and social efficiency.
Determinants of Social and Economic Efficiency: Age
H2d: There are significant differences in social efficiency depending on the age of MFIs
H´2d: There are significant differences in economic efficiency depending on the age of
MFIs
Finally, the oldest MFIs are found as a whole to be proportionally less efficient in both economic and social terms in comparison with the young ones (Table 3). The differences in means are not significant in the univariate analysis (Table 4), but the joint model reinforces this trend and shows a significant and negative coefficient in the case of the years of operation for both efficiencies.
According to this, and even if the differences between groups are not large, our analysis shows that a long track record is not an essential condition for working efficiently in this sector (although, as mentioned above, all the MFIs in the sample operate in a markedly professional way). On the contrary, age can affect efficiency negatively. Therefore, Hypothesis H2d and H´2d
19 CONCLUSIONS
This study sets out to determine what factors influence social and economic efficiency at MFIs at international level. In spite of the great increase in microfinance there are few studies that examine the overall links between their social and economic efficiency, and fewer still that analyze the factors that determine how MFIs can improve from both the social and economic perspectives. This paper presents the first analysis of legal status, target market, scale and age as determining factors for the efficiency of MFIs, using international data and a social and economic efficiency perspective.
One of the main contributions of our study is to demonstrate that social and economic goals are compatible with each other, an issue raised by the paradox of social cost. This is an issue that has generated controversy in this field. The high, positive correlation that we find between social efficiency and economic efficiency indicates that, although achieving social goals may be the prime concern of a microfinance institution, it is not necessary to give up economic goals to do so. In other words MFIs can be both socially and economically sustainable. This idea is reinforced with the observation that NGOs and NBFIs, which are traditionally markedly social in their orientation, predominate in the group of organizations with the best relative results in terms of social and economic efficiency.
The very make up of the sample, with data from the MIX Market, ensures that the MFIs studied have a certain standard of professionalism and a good track record. However, over and above these minimum standards, we do not find size to be a significant obstacle for efficiency. Indeed, in the case of scale we find that small MFIs are as a whole significantly more efficient in both economic and social terms. In the case of age, the young MFIs perform better in both efficiencies; so it suggests that mature ones should take care to maintain their purpose and aims along time. The difficulties of working with low-income populations are frequently pointed out, but our findings here show that it is possible to do so without thereby incurring lower social or economic efficiency.
In short, these findings provide further evidence in the debate on the outreach of microfinance institutions, and reveal that it is possible to achieve social efficiency without renouncing economic viability. We find the possibility of a win-win situation between economic and social issues, as the paradox of social cost pointed out. According to our results, preconceptions about the negative impacts of social concern on economic results should be reconsidered. From another point of view, it can be concluded that it is possible to work and invest in the sector with different motivations. Compatibility of goals shows that opportunities to support and invest in such organizations may extend well beyond reasons of social responsibility. However, this study is conducted from a quantitative perspective: an in-depth qualitative analysis is required of other elements involved in achieving efficiency, at least social efficiency. Such elements could for instance be more human and relational in nature.
20 REFERENCES
Altunbaş, Y., Gardener, E. P., Molyneux, P., Moore, B. 2001. Efficiency in european banking.
European Economic Review 45(10): 1931-1955. DOI: 10.1016/S0014-2921(00)00091-X Armendáriz de Aghion, B., Szafarz, A. 2011. On mission drift in microfinance institutions. In
The Handbook of Microfinance, Armendáriz de Aghion, B., Labie, M. (eds.). World Scientific Publishing; 341-366.
Beck, T., Demirgüc-Kunt, A., Martínez Peria, M. S. 2007a. Banking services for everyone? barriers to bank access and use around the world. World Bank Policy Research Working Paper 4079.
Beck, T., Demirgüc-Kunt, A., Martínez Peria, M. S. 2007b. Reaching out: Access and use of banking services across countries. Journal of Financial Economics 85(1): 234-266. DOI: 10.1016/j.jfineco.2006.07.002
Berger, A. N., DeYoung, R. 1997. Problem loans and cost efficiency in commercial banks.
Journal of Banking Finance 21(6): 849-870. DOI: 10.1016/S0378-4266(97)00003-4 Berger, A. N., DeYoung, R. 2001. The effects of geographic expansion on bank efficiency.
Journal of Financial Services Research 19(2-3): 163-184.
Berger, A. N., Hancock, D., Humphrey, D. B. 1993. Bank efficiency derived from the profit function. Journal of Banking Finance 17(2): 317-347. DOI: 10.1016/0378-4266(93)90035-C
Bonin, J. P., Hasan, I., Wachtel, P. 2005. Bank performance, efficiency and ownership in transition countries. Journal of Banking Finance 29(1): 31-53. DOI: 10.1016/j.jbankfin.2004.06.015
CGAP. 2010. Andhra Pradesh 2010: Global Implications of the Crisis in Indian Microfinance.
Focus Notes (67): 1-12.
Charnes, A., Cooper, W. W., Rhodes, E. 1978. Measuring the efficiency of decision making units. European Journal of Operational Research 2(6): 429-444.
Conning, J. 1999. Outreach, sustainability and leverage in monitored and peer-monitored lending, Journal of Development Economics60: 51-77.
Cull, R., Demirgüç-Kunt, A., Morduch, J. 2007. Financial performance and outreach: A global analysis of leading microbanks. Economic Journal 117: 107-133. DOI: 10.1111/j.1468-0297.2007.02017.x
Dichter, T., Harper, M. 2007. What´s wrong with microfinance? Practical Action Publishers, London.
Farrell, M. J. 1957. The measurement of productive efficiency. Journal of the Royal Statistical Society. Series A (General): 253-290.
García, C., Olivié, I. 2003. Alcance versus desempeño financiero en los programas de microfinanzas: apuntes teóricos y algunos ejemplos. Revista de Economía Mundial9: 129-152.
Goddard, J., Molyneux, P., Wilson, J. O., Tavakoli, M. 2007. European banking: An overview.
Journal of Banking Finance, 31 (7): 1911-1935. DOI: 10.1016/j.jbankfin.2007.01.002 Gutiérrez-Goiria, J., Goitisolo, B. 2011. Profitability and social performance of Microfinance
Institutions: empirical evidence of relations between different types of variables. Revista de Economía Mundial, 27: 189-214.
Gutiérrez-Nieto, B., Serrano, C., Mar Molinero, C. 2007. Microfinance institutions and efficiency. Omega. the International Journal of Management Science 35: 131-142. DOI: 10.1016/j.omega.2005.04.001
21 Gutiérrez-Nieto, B., Serrano, C., Mar Molinero, C. 2009. Social efficiency in microfinance institutions. Journal of the Operational Research Society 60: 104-119. DOI: 10.1057/palgrave.jors.2602527
Haq, M., Skully, M., Pathan, S. 2010. Efficiency of microfinance institutions: A data envelopment analysis. Asia-Pacific financial markets 17: 63-97. DOI: 10.1007/s10690-009-9103-7
Hartarska, V., Nadolnyak, D., Shen, X. 2012. Efficiency in microfinance cooperatives.
Iberoamerican Journal of Development Studies, 1 (2): 52-75.
Hermes, N., Lensink, R., Meesters, A. 2011. Outreach and efficiency of microfinance institutions. World Development, 39 (6): 938-948. DOI: 10.1016/j.worlddev.2009.10.018 Lützenkirchen, C., Weistroffer, C., Speyer, B., AG, D. B. 2012. Microfinance in evolution. An
Industry between Crisis and Advancement,Deutsche Bank Research.
Mester, L. J. 1996. A study of bank efficiency taking into account risk-preferences. Journal of Banking Finance, 20 (6): 1025-1045. DOI: 10.1016/0378-4266(95)00047-X
Nghiem, H., Coelli, T., Rao, D. 2006. The efficiency of microfinance in Vietnam: Evidence from NGO schemes in the north and the central regions. International Journal of Environmental, Cultural, Economic and Social Sustainability, 2 (5): 71-78.
Orlitzky, M., Schmidt, F. L., Rynes, S. L. 2003. Corporate social and financial performance: A meta-analysis. Organization studies, 24 (3), 403-441.
Pava, M. L., Krausz, J. 1996. The association between corporate social-responsibility and financial performance: The paradox of social cost. Journal of business Ethics, 15 (3): 321-357.
Quayes, S. 2012. Depth of outreach and financial sustainability of microfinance institutions.
Applied Economics, 44 (26): 3421-3433. DOI: 10.1080/00036846.2011.577016
Reed, L. 2014. Resilience. state of the microcredit´s summit campaign report, 2014. Washington, DC,
Sainz‐Fernandez, I., Torre‐Olmo, B., López‐Gutiérrez, C., Sanfilippo‐Azofra, S. 2015. Crisis in microfinance institutions: Identifying problems. Journal of International Development.
DOI: 10.1002/jid.3129
San-Jose, L., Retolaza, J. L., Pruñonosa, J. T. 2014. Efficiency in Spanish banking: A multistakeholder approach analysis. Journal of International Financial Markets, Institutions and Money, 32 : 240-255. DOI: 10.1016/j.intfin.2014.06.005
Schreiner, M. 2002. Aspects of outreach: A framework for discussion of the social benefits of microfinance. Journal of International Development, 14 (5): 591-603.
Servin, R., Lensink, R., Van den Berg, M. 2012. Ownership and technical efficiency of microfinance institutions: Empirical evidence from Latin America. Journal of Banking Finance, 36 (7): 2136-2144. DOI: 10.1016/j.jbankfin.2012.03.018
Widiarto, I., Emrouznejad, A. 2015. Social and financial efficiency of islamic microfinance institutions: A data envelopment analysis application. Socio-Economic Planning Sciences, 50: 1-17. DOI: 10.1016/j.seps.2014.12.001
World Bank. 2014. Global financial development report 2014: Financial inclusion. World Bank, Washington D.C. DOI: 10.1596/978-0-8213-9985-9
Zellner, A. 1962. An efficient method of estimating seemingly unrelated regressions and tests for aggregation bias. Journal of the American Statistical Association,57: 348–368.
Zellner, A. 1963. Estimators for seemingly unrelated regression equations: Some exact finite sample results. Journal of the American Statistical Association58: 977–992.
22 Appendix 1: Main characteristics of the sample
Table 7. Sample selection
MFI with data at 31.12.2012 (Mix Market) 1070
MFI with low quality information according to Mix Market (less than 3 diamonds)
-216
MFI with lack of information about the selected variables
-406
MFI with atypical values and outliers (negative equity, absence of deposits and borrowings…)
-45
Final Sample 403
Table 8. Main characteristics of MFIs in the sample
Variable Number
of MFIs
Mean (Std. Dev.) µ (σ)
Equity (US$) 403 15,521,576 (46,937,027)
External funding (deposits and borrowings, US$) 403 56,871,508 (190,246,812)
Loan portfolio (US$) 403 62,274,307 (196,066,348)
Portfolio at risk (%) 403 3.72 (4.93)
Return on equity (%) 403 9.14 (23.31)
Number of clients 403 134,399 (679,185)
Percentage of female borrowers 403 58.38 (22.45)
Table 9. Geographical distribution and legal status in the sample
Region / Legal Status Banks Credit
Coop.
NBFI NGO Others Total
Africa 6 13 15 9 43
East Asia and the Pacific 1 6 9 13 7 36
Eastern Europe and Central Asia
13 10 57 13 4 97
Latin America and the
Caribbean
17 34 60 92 2 205
Middle East and North Africa 1 1 6 8
South Asia 6 2 4 2 14