Automated selection of compounds with physicochemical
properties to maximize bioavailability and druglikeness
Taiji Oashi, Ashley L. Ringer, E. Prabhu Raman, and Alexander D. MacKerell Jr.*
Department of Pharmaceutical Sciences, School of Pharmacy, University of Maryland, Baltimore, 20 Penn Street, Baltimore, MD 21201
Abstract
Adequate bioavailability is one of the essential properties for an orally administered drug. Lipinski and others have formulated simplified rules in which compounds that satisfy selected
physiochemical properties, for example, molecular weight (MW)≤500, or logarithm of octanol-water partition coefficient logP(o/w)<5, are anticipated to likely have pharmacokinetic properties appropriate for oral administration. However, these schemes do not simultaneously consider the combination of the physiochemical properties, complicating their application in a more automated fashion. To overcome this we present a novel method to select compounds with a combination of physicochemical properties that maximize bioavailability and druglikeness, based on compounds in the World Drug Index (WDI) database. In the study four properties, MW, logP(o/w), number of hydrogen bond donors and number of hydrogen acceptors were combined into a 4-D histogram, from which a scoring function was defined based on a 4D dependent multivariate Gaussian model. The resulting equation allows for assigning compounds a bioavailability score, termed 4D-BA, such that chemicals with higher 4D-BA scores are more likely to have oral drug-like
characteristics. The descriptor is validated by applying the function to drugs previously categorized in the Biopharmaceutics Classification System and examples of application of the descriptor are given in the context of previously published studies targeting heme oxygenase and SHP2 phosphatase. The approach is anticipated to be useful in early lead identification studies in combination with clustering methods to maximize chemical and structural diversity when selecting compounds for biological assays from large database screens. It may also be applied to prioritize synthetically feasible chemical modifications during lead compound optimization.
INTRODUCTION
Despite advances in pharmaceutical sciences, drug discovery and development is still an expensive, time-consuming process. This process is, in part, hampered by difficulties in identifying pharmacologically active compounds with the appropriate pharmacokinetic properties that are ultimately successful in the clinic. Thus, more efficient methods to search for pharmacologically active compounds that also have desirable absorption, distribution, metabolism and excretion (ADME) properties are needed.1 Of the ADME properties, absorption and distribution, or bioavailability, are central to the successful development of orally administered drugs.
Corresponding author phone: (410) 706-7442; fax: (410) 706-5017, alex@outerbanks.umaryland.edu.
Supporint Information Available: 1D probability distributions of physicochemical properties reproduced by the 4D dependent multivariate model with optimized mean values and variance-covariance matrix, comparison between observed probability from the
NIH Public Access
Author Manuscript
J Chem Inf Model. Author manuscript; available in PMC 2012 January 24. Published in final edited form as:
J Chem Inf Model. 2011 January 24; 51(1): 148–158. doi:10.1021/ci100359a.
NIH-PA Author Manuscript
NIH-PA Author Manuscript
Numerous studies have addressed the issue of relating bioavailability to the physiochemical properties of drug-like molecules. From these efforts a number of physicochemical
properties have been shown to correlate with bioavailability, including, but not limited to molecular weight (MW), lipophilicity measured as the logarithm of the octanol-water partition coefficient (logP(o/w)), intrinsic aqueous solubility (logSw), number of hydrogen bond (H-bond) donors (HDO) and acceptors (HAC), molar refractivity, number of rings (RNG), and number of rotatable bonds (RTB). Among those properties, MW is related to intestinal and blood brain barrier permeability, where molecules with larger MW tend to have less permeability.2,3. Lipophilicity is related to absorption4 while an excessive amount of H-bond donors lowers permeability across lipid bilayers.5,6 Vieth and coworkers have shown that oral drugs tend to have lower MW, fewer H-bond donors, acceptors, and rotatable bonds compared with other classes of drugs.7
Lipinski and coworkers chose 2,245 compounds from the World Drug Index (WDI)
database that they thought are likely to have superior physicochemical properties.8 The WDI is a compound database that contains pharmacologically active compounds with
comprehensive medical data including usage, drug target, mechanism of action, activity keywords, and adverse side effects.9 For those 2,245 compounds, the MW, logP(o/w), number of H-bond donors and acceptors were calculated. Analysis revealed that
approximately 90% of the compounds had values of the listed physiochemical properties that fell in a range of five or a multiple of five of several physicochemical properties. These include a MW under 500 (89% satisfied), logP(o/w) not more than 5 (90% satisfied), the number of H-bond donors not more than 5 (92% satisfied), and the number of H-bond acceptors not more than 10 (88% satisfied).8 Combination of any two properties was even more selective with 1% of the compounds outside of both the MW and logP(o/w) criteria, 4% outside of the MW and H-bond donors criteria, 7% outside of the MW and H-bond acceptor criteria and 10% outside of the H-bond donor and acceptor criteria. Thus, compounds out of these ranges are likely to have poor absorption and/or permeation with exception of compounds that are substrates for biological transporters.10 These observations are now referred to as Lipinski’s rule of five. Similar concepts have been pursued by Oprea and coworkers, in which they define criteria for leadlike compounds as: MW≤460, −4≤ logP(o/w)≤ 4.2, logSw≥−5, rotatable bonds (RTB)≤10, rings (RNG)≤4, HDO≤5, and HAC≤9.11 Recently, Ohno and coworkers considered two physicochemical properties simultaneously to evaluate druglikeness using multivariate non-normal distributions.12 In the present manuscript we extend Lipiniski’s rule of 5 and related concepts to allow for automatic selection of compounds with an appropriate combination of physicochemical properties to maximize bioavailability. The work takes advantage of almost all of the approximately 50,000 compounds in the 1999 version of the WDI database, versus the 2,245 compounds previously studied, allowing for development of a scoring function based on a 4-dimensional (4D) probability distribution of the physicochemical properties MW, logP(o/w), HDO, and HAC. It should be noted that other descriptors, such as the number of rotatable bonds or polar surface area, could be included in such an analysis though we focus on using MW, logP(o/w), HDO, HAC to keep the dimensionality of the solution tractable. The presented scheme can be combined with known approaches that evaluate the diversity of compounds by including clustering based on chemical structure during the selection process. The approach is anticipated to be particularly useful for rapid evaluation of potential bioavailability in early lead identification when large numbers of compounds may be selected from, for example, in silico database screening. In the later phases of lead optimization, possible chemical modifications to increase the binding affinity to the target may be prioritized in the context of bioavailability. In both cases, the presented method automatically selects those compounds with the highest possibility of having the best
NIH-PA Author Manuscript
NIH-PA Author Manuscript
bioavailability/druglikeness from a collection of compounds selected based on criteria other than bioavailability.
MATERIALS AND METHODS
Compound databasesThe WDI Database (1999 edition) contains approximately 50,000 compounds consisting of all marketed drugs and pharmacologically active compounds as well as comprehensive medical data including usage, drug target, mechanism of action, activity keywords, and adverse drug effects.9. Additional analysis was performed on three publically available chemical databases from commercial vendors. Databases from Maybridge (Thermo Fisher Scientific Inc., Waltham, MA), ChemBridge (San Diego, CA), and ChemDiv (San Diego, CA) contain approximately 62,000, 455,000, and 761,000 compounds, respectively. The 2009 version of each of these databases was used.
Four physicochemical properties, MW, logP(o/w), HDO, and HAC, were calculated for all compounds using the program Molecular Operating Environment (MOE) (Chemical Computing Group Inc.). To develop the scoring function, a 4D histogram was then constructed based on MW, logP(o/w), HDO, and HAC for all compounds in the WDI database, allowing for consideration of the combination of the four physicochemical properties. The following bin sizes were used in creation of the 4D histogram: 50 for MW, 1 for logP(o/w), and 1 for HDO and HAC. The number of compounds in each bin were normalized as probabilities, which were then fit to a 4D variance-covariance matrix, as described below. The resulting model was then used to calculate the score of a given compound as a predictor of bioavailability. These scores will be referred to as the 4D-BA (ie. BA indicates bioavailability) score for the remainder of the manuscript.
Structural Clustering
Structural clustering of compounds was performed using the BIT-packed version of MACCS structural keys (BIT MACCS), which encodes 2D structural features, and the Tanimoto coefficient13. Fingerprints, linear bit strings, based on the 166 MACCS keys that represent a small substructure in a given molecule, were assigned to each compound, where the combination of the assigned fingerprints characterizes a given compound. Fingerprint clustering was performed to group compounds into clusters of structurally similar
compounds; similarity and overlap criteria were adjusted to obtain approximately 350–400 clusters of varying size as done in our previous studies14,15. These calculations were performed using MOE (Chemical Computing Group Inc.).
RESULTS AND DISCUSSION
In the present work we extend the efforts of Lipinski, Opera and others to estimate potential bioavailability in the context of a more automated approach. Instead of focusing on 2,245 of the approximately 50,000 compounds in the WDI database we performed the analysis on the full database based on the assumption that the pharmacologically active compounds will generally have the appropriate physicochemical properties required for bioavailability. Use of all compounds in the WDI allows for the range of physicochemical properties to be treated in terms of distributions, extending to a 4D distribution as defined by the MW, logP(o/w), HDO and HAC of each compound as predictors of bioavailability. The 4D distribution may then be quantified into 4D “voxels” allowing for the frequency of the existence of a bioavailable compounds with a specific range of physiochemical parameter to be determined. While these frequencies alone could be used to define a scoring function based on a table lookup procedure, we considered it advantageous to determine a function
NIH-PA Author Manuscript
NIH-PA Author Manuscript
describing the 4D distribution, thereby allowing for rapid score assignment and interpolation of the scores beyond the bin sizes characterizing the initial distribution. Importantly, this approach allows for ranking of ligands that fall both within and beyond the range specified by Lipiniski’s Rule of 5 as well as ready automation of the assignment process, thereby facilitating the drug discovery process. Having the method assign 4D-BA scores to
compounds beyond the range specified by Lipinski’s Rule of 5 is considered important as a number of drug-like molecules do indeed fall outside that range and we did not want our method to exclude such compounds.
MW, logP(o/w), HDO, and HAC distributions in four compound databases
To compare general physicochemical properties among four different compound databases (WDI, Maybridge, ChemBridge, and ChemDiv), MW, logP(o/w), HDO, and HAC were calculated for all four databases and summarized in Table 1. The probability distributions of each physical property in all four databases are shown in Figure 1. Notably, the distributions are all approximately Gaussian in nature, a property that facilitated the selection of functions from which to derive an analytical scoring function. Comparison of the distributions shows them to have similarities, though the WDI database covers wider ranges than any of the other databases. In particular, the distributions in the WDI go to higher values for MW, HDO and HAC and lower values for logP(o/w). Similar distributions were observed by Ohno and coworkers.12 This is due to the inclusion of peptides and other natural products in the WDI, compounds that have larger sizes and more H-bonding moieties as compared to the commercial databases, while also being more soluble in aqueous environments. While the removal of these particular compounds from the WDI during further analysis was considered due to known stability and bioavailability issues, we instead eliminated compounds from model fitting based on physiochemical criteria, as described below. To better characterize the combinations of MW, logP(o/w), HDO, and HAC 2D histograms of all combinations of MW, logP(o/w), HDO, and HAC were created (Figure 2). Analysis of the plots reveals varying levels of correlation between the different properties. For example, the correlation between H-bond acceptors and donors is high (r2=0.51) while the correlation between logP(o/w) and H-bond acceptors is relatively low (r2 =0.06). Similar correlations were also observed in the study by Ohno and coworkers.12 These results point towards the need to include this correlation during function development, an observation that was subsequently validated as described below.
Scalar representation of bioavailability based on a 4D combination of MW, logP(o/w), HDO, and HAC in marketed drugs and pharmacologically active compounds
To develop a scalar quantity that is representative of bioavailabilty it is necessary to simultaneously take into account the four physicochemical properties of interest (MW, logP(o/w), HDO, and HAC). Step one of this process was to calculate a 4D histogram of those properties based on the marketed drugs and pharmacologically active compounds as found in the WDI to determine the impact of bin size on the probabilities obtained in the histogram. The range of the distributions are shown above in Figures 1 and 2 while impact of bin sizes on the maximum number of compounds in the most populated bin are listed in Table 2. From Table 2 the balance between resolution of the data, as determined by the bin size, and the number of counts is significant. A final selection of using a 4D histogram with a bin size MW: 50, logP(o/w): 1, HDO: 1, HAC: 1 was associated with the need to keep the binning of the number of donors and acceptors at 1 and adjusting the resolution of MW and logP(o/w) values that yielded a significant number of counts in the highest occupied bin. The identity of the top 5 most populated 4D bins using the selected bin sizes are listed in Table 3. Comparison of those results with those in Figure 1 and Table 1 above show that the logP(o/w), MW and HDO values to approximately correspond with highly populated
NIH-PA Author Manuscript
NIH-PA Author Manuscript
regions of the respective 1D distribution and the average values. However, with the HAC, the highly populated bins are at values lower than the maximum of the 1D distribution and the average values. While this difference in not large it suggests that the HAC term is making a smaller contribution to bioavailability than the remaining physicochemical properties.
Initial attempts at to develop a function to describe the 4D probability distribution involved a 4D Gaussian distribution model, based on independent Gaussians for each property. This was motivated by the distributions shown in Figure 1, where each property has an
approximately normal (Gaussian) distribution in 1D space, as described by Eq 1, where f(x) is the actual count in each bin, coefficient a is the height of the Gaussian, μ is the mean, and σ is the standard deviation of each property.
(Eq. 1)
Instead of using coefficient a, Eq. 1 can be written using probability density function (PDF), where f(x) is the probability density of each bin, as in equation 2
(Eq. 2)
Extending equation 2 to treat any two of the four properties, as shown in the 2D distributions in Figure 2, one obtains a PDF as described by Eq. 3, where f(x,y) is the probability density of the occupancy of each 2D, μx and μy are means of properties x and y, and σx and σy are
standard deviations of properties x and y. Eq. 3 assumes that the two variables x and y are independent each other.
(Eq. 3)
Thus, our first attempt to fit data to develop a scoring function was a product of four independent Gaussian functions as described by Eq.4, where four physicochemical properties logP(o/w), MW, HAC, and HDO are represented as w, x, y, and z, respectively, f(w,x,y,z) is the probability density of each 4D bin, μw, μx, μy, μz are means of properties w,
x, y, z, and σw, σx, σy, and σz are standard deviations of properties w, x, y and z.
(Eq. 4)
To develop a scoring function in the form of Eq. 4, the 1D distributions obtained from the WDI database were used to obtain values for variables σ and μin Eq.4. Prior to determining values for the variables σ and μ, outliers in the WDI database were eliminated by using the following range of the four properties; −6<w≤10 for logP(o/w), 0<x≤800 for MW, 0≤y≤15 for HAC, 0≤z≤10 for HDO, resulting in 51957 compounds in total, from which mean and standard deviation for each properties were calculated. Since we use a bin size of 50 for MW, Eq. 4 becomes Eq. 5 that was used for fitting.
NIH-PA Author Manuscript
NIH-PA Author Manuscript
(Eq. 5)
Using Eq. 5 with the means and standard deviations directly computed from the truncated WDI database without outliers (51957 compounds), μw=2.7, σw=2.4, μx=360.4, σx=144.7,
μy=3.5, σy=2.6, μz= 0 (0 is as this is the maximum of the H-bond donor distribution as
shown in Figure 1C), σz= 1.8, the probability was computed for the compounds in the
truncated WDI database, and then compared with actual probability from the 4D histogram. This model gave a poor predictive model with an R2 of 0.27. Accordingly, it is evident that the 4D independent Gaussian model does not capture well the observed probability from the 4D histogram.
Closer examination of the plots in Figure 2 suggests one possibility for the limitation in the independent model. If Gaussian distributions based directly on the mean and standard deviation from the WDI database (Table 1) are compared to the distributions in Figure 1, the shape of the distribution is not well reproduced, and in particular the highest scoring values are consistently missed (Supplemental Figure S1). To overcome this, in the second approach the calculated mean and standard deviation values were used as initial guesses and then optimized to maximize reproduction of the 4D histogram obtained directly form the WDI. Fitting was performed using the FindFit utility in Mathematica, which is based on the Levenberg-Marquardt algorithm (LMA). The resulting optimized means and standard deviations are as follows: μw=3.2, σw=1.8, μx=302.6, σx=97.9, μy=2.2, σy=1.5, μz= 0.6, σz=
1.3. While this yielded an improved model with an R2 value of 0.57 (observed vs predicted), this model was considered to not be of sufficient predictive power to be of utility for predicting potential oral bioavailability (Figure S2 of the Supplemental Material).
A product of independent Gaussian distributions assumes that each of the four properties is not correlated with each other, which is not the case as suggested by Figure 2 and then verified based on the model development in the preceding section. Accordingly, the appropriate model needed to take into account the correlation between the properties. The approach selected to do this was a multivariate normal distribution using a matrix of variances and covariances for the four properties. Using such an approach Eq. 2 can be rewritten as Eq. 6,
(Eq. 6)
where the exponent is similar to the Mahalanobis square distance formula as follows:
where T represents a transposed matrix, S is a variance-covariance matrix, μ is the mean, σ2 is the variance, and x is the independent variable. Eq.6 can thus be extended into 4D as described in Eq. 7,
(Eq. 7)
NIH-PA Author Manuscript
NIH-PA Author Manuscript
which is known as a multivariate normal distribution. Since we use a bin size of 50 for MW, Eq. 7 becomes Eq. 8 that was used for fitting.
(Eq. 8)
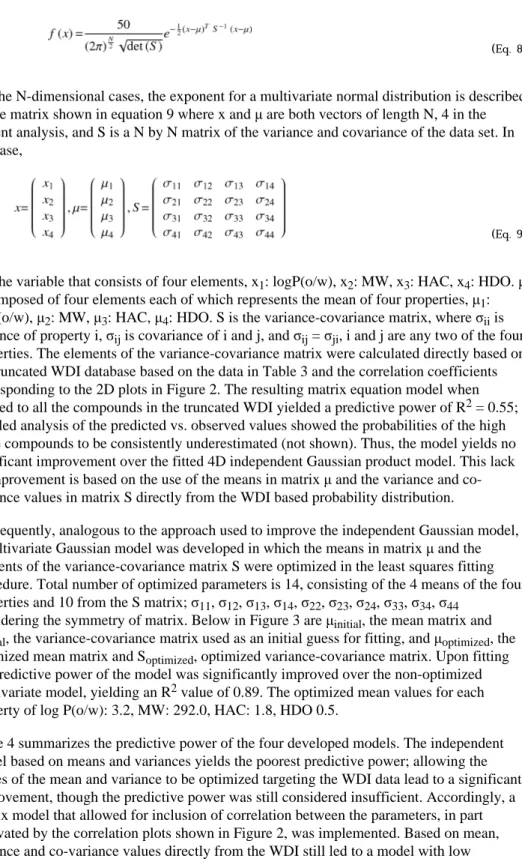
For the N-dimensional cases, the exponent for a multivariate normal distribution is described by the matrix shown in equation 9 where x and μ are both vectors of length N, 4 in the present analysis, and S is a N by N matrix of the variance and covariance of the data set. In our case,
(Eq. 9)
x is the variable that consists of four elements, x1: logP(o/w), x2: MW, x3: HAC, x4: HDO. μ
is composed of four elements each of which represents the mean of four properties, μ1:
logP(o/w), μ2: MW, μ3: HAC, μ4: HDO. S is the variance-covariance matrix, where σii is
variance of property i, σij is covariance of i and j, and σij = σji, i and j are any two of the four
properties. The elements of the variance-covariance matrix were calculated directly based on the truncated WDI database based on the data in Table 3 and the correlation coefficients corresponding to the 2D plots in Figure 2. The resulting matrix equation model when applied to all the compounds in the truncated WDI yielded a predictive power of R2 = 0.55; detailed analysis of the predicted vs. observed values showed the probabilities of the high score compounds to be consistently underestimated (not shown). Thus, the model yields no significant improvement over the fitted 4D independent Gaussian product model. This lack of improvement is based on the use of the means in matrix μ and the variance and co-variance values in matrix S directly from the WDI based probability distribution.
Consequently, analogous to the approach used to improve the independent Gaussian model, a multivariate Gaussian model was developed in which the means in matrix μ and the elements of the variance-covariance matrix S were optimized in the least squares fitting procedure. Total number of optimized parameters is 14, consisting of the 4 means of the four properties and 10 from the S matrix; σ11, σ12, σ13, σ14, σ22, σ23, σ24, σ33, σ34, σ44
considering the symmetry of matrix. Below in Figure 3 are μinitial, the mean matrix and
Sinitial, the variance-covariance matrix used as an initial guess for fitting, and μoptimized, the
optimized mean matrix and Soptimized, optimized variance-covariance matrix. Upon fitting
the predictive power of the model was significantly improved over the non-optimized multivariate model, yielding an R2 value of 0.89. The optimized mean values for each property of log P(o/w): 3.2, MW: 292.0, HAC: 1.8, HDO 0.5.
Table 4 summarizes the predictive power of the four developed models. The independent model based on means and variances yields the poorest predictive power; allowing the values of the mean and variance to be optimized targeting the WDI data lead to a significant improvement, though the predictive power was still considered insufficient. Accordingly, a matrix model that allowed for inclusion of correlation between the parameters, in part motivated by the correlation plots shown in Figure 2, was implemented. Based on mean, variance and co-variance values directly from the WDI still led to a model with low predictive power; however, by fitting those terms a significant increase in the predictive power is gained. This is evident in Figure 4 comparing probability values directly from the WDI with those based on the final matrix model. Given the high predictive power of the
NIH-PA Author Manuscript
NIH-PA Author Manuscript
model this was selected for use in the prediction of the 4D-BA scores of compounds to facilitate drug design.
To evaluate the possibility of over-fitting, the WDI dataset was divided randomly into equally sized training and test sets. The 4D multivariate correlated Gaussian model was built using the training data set following the same procedure described above for the full dataset. Using the resulting fitted values of means and the variance/covariance matrix (which did not differ significantly from the ones fitted from the complete dataset), the predictability of the model was evaluated. An R2 value of 0.87 (test set observed vs. test set predicted) indicates that the 4D multivariate Gaussian model is robust and does not overfit to the data (See Figure S3 in supplemental material). The mean values and variance-covariance matrix presented in this paper are the ones fitted from the entire truncated WDI dataset so as to provide the best possible estimates of the parameters intended for new compound selection. An additional test for quality control was performed by comparing the three probability distributions for four physicochemical properties considered in this study. The distribution of observed probabilities directly obtained from the WDI database was compared with the distributions of the calculated probabilities using the 4D dependent multivariate Gaussian model (Figure S1). The improved 4D dependent multivariate Gaussian model captures the overall qualitative features found in the WDI database, suggesting that this could be a reasonable model to predict the relative bioavailability of new compounds.
Application of the 4D-BA descriptor to FDA approved drugs
The SCUT database is an in-house database maintained by Ekins, Swaan and coworkers that contains 2815 FDA-approved drugs in clinical use in the U.S. derived from the Clinician’s Pocket Drug Reference.16 Thus, it is of interest to apply the 4D-BA descriptor to the SCUT database to see whether 4D-BA distribution is similar to that from the WDI. 4D-BA values for the SCUT database were therefore calculated using the 4D Gaussian dependent model. For comparison, 4D-BA values were also calculated for four other databases, WDI, Maybridge, ChemBridge, and ChemDiv, with the probability distributions shown in Figure 5 in log scale. Notably, a number of compounds in WDI and SCUT have log 4D-BA scores less than −5. This is again due to the presence of peptidic drugs and other natural products that have larger MW and more H-bond moieties as compared to compounds in the commercial databases. Importantly, the low-scoring compounds are well predicted by the 4D Gaussian dependent model (Figure 4).
Validation of the 4D-BA descriptor
The Biopharmaceutics Classification System (BCS), developed by Amidon and
coworkers,17 is the scheme used by the FDA to categorize the orally administered drugs into four groups based on aqueous solubility and gastrointestinal permeability, properties that strongly influence the rate and extent of drug absorption. Class 1 includes compounds with high solubility and high permeability and are over 90% absorbed, class 2 are compounds with low solubility and high permeability, class 3 compounds have high solubility and low permeability, and class 4 compounds have low solubility and low permeability18,19, As this classification scheme is based on in vivo experimentally measured properties of known drugs, is represents an ideal set of data by which to validate the 4D-BA descriptor. This was performed using the BCS compounds listed by Wu and Bennett19 which includes 55 class 1 compounds, 44 class 2 compounds, 32 class 3 compounds, and 10 class 4 compounds, with 11 compounds in more than one category as reported in different studies18,19. 4D-BA was calculated for all compounds in the four classes with the results presented as probability distributions of log BA (Figure 6). The majority of class 1 drugs (92.7%) have log 4D-BA values bigger than −5 with the distributions for the highly permeable class 1 and 2 drugs
NIH-PA Author Manuscript
NIH-PA Author Manuscript
shifted to higher values than classes 3 and 4. This simple analysis supports the ability of the 4D-BA descriptor to capture the bioavailability characteristics of orally administered drugs. Of note are class 2 and 4 compounds that have scores lower than −10. Table 5 lists those compounds along with their physiochemical properties. All the compounds are large with MWs of 700 or more, with large numbers of hydrogen bond acceptors, consistent with their being large natural products that include carbohydrate or peptidic moieties. While low scoring class 4 compounds are expected, the presence of class 2 compounds emphasizes the limitation of any scoring scheme, whereby compounds predicted to have poor bioavailability are actually orally available. These types of compounds contribute to the low 4D-BA scores seen in the WDI and SCUT databases presented above.
Practical application of the 4D-BA
To place the presented 4D-BA scoring approach in a more practical context, we present a flow diagram in Scheme 1, which may be applied, for example, to a collection of compounds (A in Scheme 1) selected from a database based on docking against a target receptor followed by energy scoring14,15. Those compounds are then subjected to
fingerprint-based clustering to identify structurally similar compounds (B in Scheme 1). In studies in our laboratory, typically 350–400 clusters are obtained from 1000 compounds. These range from a few large clusters containing 30 or more compounds as well as a large number of “clusters” with only a single molecule. The 4D-BA score is then determined for all the compounds (C in Scheme 1), with the compound with the highest score in each cluster selected for biological assay (D in Scheme 1). Typically, compounds from the single molecule clusters are subjected to initial inspection from which a subset are selected for assay based on structural features, physiochemical properties as well as scores from the database screen.
SHP2
Src homology 2 (SH2) domain-containing phosphatase 2 (SHP2) is a protein tyrosine phosphatase (PTP) that is involved in a variety of cell signaling events.20. Hyperactivation of the catalytic activity has been found in the developmental disorder Noonan syndrome21, several childhood leukemias2223, and sporadic solid tumors24. Thus, selective inhibitors for SHP2 activity are of great interest as novel therapeutic candidates for these diseases. Our laboratory conducted a database screen in which compounds were docked into the catalytic site of SHP2.14. From that screen 1000 compounds were selected based on energy criteria from approximately 1.3 million drug-like small molecules. Chemical clustering was then performed on the top 1000 compounds yielding 376 clusters, from which 235 compounds were manually selected for biological experiments based on the Lipinski and Oprea’s empirical rules8,11 as well as qualitative chemical diversity considerations beyond that obtained by the clustering procedure. The present automated procedure was applied to select 235 compounds from the same 376 clusters based on the 4D-BA scores; clusters associated with low 4D-BA values below those in the top 235 compounds were not considered. Distributions of the log 4D-BA scores for the top 1000 compounds, the manually selected 235 compounds and the automatically selected 235 compounds are shown in Figure 7. 142 compounds were overlapped between the manually and automatically selected sets of compounds. The result shows that the set of automatically selected compounds consistently has more compounds in the higher scoring region, though significant overlap is present. The presence of lower scoring compounds in the manually selected set was due to compounds being selected to maximize structural diversity beyond that from the BIT-MACCS similarity based clustering. While such an additional selection criteria may be considered desirable, the availability of the present automated 4D-BA score would of facilitated the selection process. Additional considerations of chemical diversity are beyond the scope of the present study.
NIH-PA Author Manuscript
NIH-PA Author Manuscript
Probability distributions of the four physicochemical properties are shown for the manually and automatically selected 235 compounds in Figure 8. The results verify that compounds selected by the automated procedure typically do not violate Lipinski rule of five, although exceptions are present. In addition, almost all of these compounds also satisfy stricter rules defined by Oprea and others: MW≤460, −4≤logP(o/w)≤4.2, HDO≤5, HAC≤911. The exceptions with respect to the criteria of Lipinski or Oprea are primarily due to the inclusion of structural and chemical diversity in the final compounds. However, as diversity may be considered an attribute in drug discovery, and known drugs do indeed fall out of the range of the Lipinski or Oprea rules, the ability of our procedure to include exceptions with respect to ideal bioavailability may be considered desirable.
Heme Oxygenase
Iron acquisition is essential for bacterial pathogens, such as Neisseria meningitidis25,
Haemophilus influenzae26, Vibrio cholerae2728, and Shigella dysenteriae2930, to survive and
reveal infectivity. Hemo oxygenase (HO) plays a critical role in oxidative cleavage of the porphyrin macrocycle to biliverdin and carbon monoxide to release iron for the last step in heme utilization in a number of bacterial pathogens31,32. Therefore, selective inhibitors for bacterial HO are possible therapeutic candidates for diseases caused by those pathogens. Our laboratory applied a database screen targeting the Neisseria meningitidis HO (nm-HO). From that screen 1000 compounds were identified based on docking into the heme binding site and energy criteria from approximately 0.8 million drug-like small molecules15. Chemical fingerprint-based clustering was then performed on the top 1000 compounds yielding 435 clusters, from which 153 compounds were manually selected for biological assays15 again considering bioavailability and diversity criteria. The automated procedure was used to select the top 153 compounds from the same 435 clusters, again selecting the compounds based on the highest 4D-BA score from each cluster to include maximum chemical and structural diversity. The distributions of the top 1000, manually and
automatically selected 153 compounds are compared in Figure 9. 63 compounds overlapped between the manually and automatically selected sets. As expected, compounds selected using the automated scheme typically have higher scores with less compounds in lower scoring region. The automatically selected compounds again obey the empirical criteria of Lipinksi or Oprea (Figure 10), while a larger number of exceptions are observed with the manually selected compounds. The impact of including additional diversity during the manual selection is again evident.
CONCLUSIONS
Presented is a novel descriptor of bioavailability of drug like compounds, termed 4D-BA. The descriptor builds on previous studies by Lipinski, Oprea and others by simultaneously taking into account MW, logP(o/w), number of hydrogen bond donors and number of hydrogen bond acceptors using a 4D multivariate dependent Gaussian model. The resulting descriptor is convenient in that it offers a scalar quantity to predict bioavailability that goes beyond the four individual descriptors listed above. Validation of the descriptor is performed by showing that the 4D-BA descriptor ranks drugs in a manner consistent with their
published BCS ratings. The utility of the 4D-BA descriptor is then illustrated in the context of in silico database screening, where the 4D-BA values of compounds selected from the screen and clustered based on structural similarity is used to facilitate the selection of final compounds for biological assay. It is anticipated that the 4D-BA descriptor will also be of utility for the facilitation of lead optimization studies where it can help prioritize compounds for chemical synthesis and biological testing.
NIH-PA Author Manuscript
NIH-PA Author Manuscript
Supplementary Material
Refer to Web version on PubMed Central for supplementary material.
Acknowledgments
The authors acknowledge helpful discussions with Drs. James Polli and Peter Swaan and financial support from NIH CA120215, the Samuel Waxman Cancer Foundation and the University of Maryland Computer-Aided Drug Design Center.
REFERENCES
1. Ekins S, Rose J. In silico ADME/Tox: the state of the art. J. Mol. Graph. Model. 2002; 20:305–309. [PubMed: 11858639]
2. Navia MA, Chaturvedi PR. Design principles for orally bioavailable drugs. Drug Dis. Today. 1996; 1:179–189.
3. Pardridge WM. Transport of small molecules through the blood-brain barrier: biology and methodology. Adv. Drug Deliv. Rev. 1995; 15:5–36.
4. Testa B, Carrupt PA, Gaillard P, Billois F, Weber P. Lipophilicity in molecular modeling. Pharm. Res. 1996; 13:335–343. [PubMed: 8692723]
5. Abraham MH, Chadha HS, Whiting GS, Mitchell RC. Hydrogen bonding. 32. An analysis of water-octanol and water-alkane partitioning and the delta log P parameter of seiler. J. Pharm. Sci. 1994; 83:1085–1100. [PubMed: 7983591]
6. Paterson DA, Conradi RA, Hilgers AR, Vidmar TJ, Burton PS. A non-aqueous partitioning system for predicting the oral absorption potential of peptides. Quant. Struct.-Act. Relatsh. 1994; 13:4–10. 7. Vieth M, Siegel MG, Higgs RE, Watson IA, Robertson DH, Savin KA, Durst GL, Hipskind PA.
Characteristic physical properties and structural fragments of marketed oral drugs. J. Med. Chem. 2004; 47:224–232. [PubMed: 14695836]
8. Lipinski CA, Lombardo F, Dominy BW, Feeney PJ. Experimental and computational approaches to estimate solubility and permeability in drug discovery and development settings. Adv. Drug Deliv. Rev. 1997; 23:3–25.
9. WDI: World Drug Index. Version 4/99, Derwent Information. 1999
10. Ekins S, Stresser DM, Williams JA. In vitro and pharmacophore insights into CYP3A enzymes. Trends Pharmacol. Sci. 2003; 24:161–166. [PubMed: 12707001]
11. Hann MM, Oprea TI. Pursuing the leadlikeness concept in pharmaceutical research. Curr. Opin. Chem. Biol. 2004; 8:255–263. [PubMed: 15183323]
12. Ohno K, Nagahara Y, Tsunoyama K, Orita M. Are there differences between launched drugs, clinical candidates, and commercially available compounds? J. Chem. Inf. Model. 2010; 50:815– 821. [PubMed: 20394396]
13. Butina D. Unsupervised data base clustering based on Daylight's fingerprint and Tanimoto similarity: A fast and automated way to cluster small and large data sets. J. Chem. Inf. Comput. Sci. 1999; 39:747–750.
14. Yu WM, Guvench O, Mackerell AD Jr, Qu CK. Identification of small molecular weight inhibitors of Src homology 2 domain-containing tyrosine phosphatase 2 (SHP-2) via in silico database screening combined with experimental assay. J. Med. Chem. 2008; 51:7396–7404. [PubMed: 19007293]
15. Furci LM, Lopes P, Eakanunkul S, Zhong S, MacKerell AD Jr, Wilks A. Inhibition of the bacterial heme oxygenases from Pseudomonas aeruginosa and Neisseria meningitidis: novel antimicrobial targets. J. Med. Chem. 2007; 50:3804–3813. [PubMed: 17629261]
16. Gomella L, Haist S, Adams A. Clinician's Pocket Drug Reference 2009. 2009
17. Amidon GL, Lennernas H, Shah VP, Crison JR. A theoretical basis for a biopharmaceutic drug classification: the correlation of in vitro drug product dissolution and in vivo bioavailability. Pharm. Res. 1995; 12:413–420. [PubMed: 7617530]
NIH-PA Author Manuscript
NIH-PA Author Manuscript
18. Lindenberg M, Kopp S, Dressman JB. Classification of orally administered drugs on the World Health Organization Model list of Essential Medicines according to the biopharmaceutics classification system. Eur. J. Pharm. Biopharm. 2004; 58:265–278. [PubMed: 15296954] 19. Wu CY, Benet LZ. Predicting drug disposition via application of BCS: transport/absorption/
elimination interplay and development of a biopharmaceutics drug disposition classification system. Pharm. Res. 2005; 22:11–23. [PubMed: 15771225]
20. Tonks NK. Protein tyrosine phosphatases: from genes, to function, to disease. Nat. Rev. Mol. Cell Biol. 2006; 7:833–846. [PubMed: 17057753]
21. Tartaglia M, Mehler EL, Goldberg R, Zampino G, Brunner HG, Kremer H, van der Burgt I, Crosby AH, Ion A, Jeffery S, Kalidas K, Patton MA, Kucherlapati RS, Gelb BD. Mutations in PTPN11, encoding the protein tyrosine phosphatase SHP-2, cause Noonan syndrome. Nat. Genet. 2001; 29:465–468. [PubMed: 11704759]
22. Tartaglia M, Niemeyer CM, Fragale A, Song X, Buechner J, Jung A, Hahlen K, Hasle H, Licht JD, Gelb BD. Somatic mutations in PTPN11 in juvenile myelomonocytic leukemia, myelodysplastic syndromes and acute myeloid leukemia. Nat. Genet. 2003; 34:148–150. [PubMed: 12717436] 23. Loh ML, Vattikuti S, Schubbert S, Reynolds MG, Carlson E, Lieuw KH, Cheng JW, Lee CM, Stokoe D, Bonifas JM, Curtiss NP, Gotlib J, Meshinchi S, Le Beau MM, Emanuel PD, Shannon KM. Mutations in PTPN11 implicate the SHP-2 phosphatase in leukemogenesis. Blood. 2004; 103:2325–2331. [PubMed: 14644997]
24. Bentires-Alj M, Paez JG, David FS, Keilhack H, Halmos B, Naoki K, Maris JM, Richardson A, Bardelli A, Sugarbaker DJ, Richards WG, Du J, Girard L, Minna JD, Loh ML, Fisher DE, Velculescu VE, Vogelstein B, Meyerson M, Sellers WR, Neel BG. Activating mutations of the noonan syndrome-associated SHP2/PTPN11 gene in human solid tumors and adult acute myelogenous leukemia. Cancer Res. 2004; 64:8816–8820. [PubMed: 15604238]
25. Zhu W, Hunt DJ, Richardson AR, Stojiljkovic I. Use of heme compounds as iron sources by pathogenic neisseriae requires the product of the hemO gene. J. Bacteriol. 2000; 182:439–447. [PubMed: 10629191]
26. Sanders JD, Cope LD, Hansen EJ. Identification of a locus involved in the utilization of iron by Haemophilus influenzae. Infect. Immun. 1994; 62:4515–4525. [PubMed: 7927717]
27. Henderson DP, Payne SM. Characterization of the Vibrio cholerae outer membrane heme transport protein HutA: sequence of the gene, regulation of expression, and homology to the family of TonB-dependent proteins. J. Bacteriol. 1994; 176:3269–3277. [PubMed: 8195082]
28. Henderson DP, Payne SM. Vibrio cholerae iron transport systems: roles of heme and siderophore iron transport in virulence and identification of a gene associated with multiple iron transport systems. Infect. Immun. 1994; 62:5120–5125. [PubMed: 7927795]
29. Mills M, Payne SM. Genetics and regulation of heme iron transport in Shigella dysenteriae and detection of an analogous system in Escherichia coli O157:H7. J. Bacteriol. 1995; 177:3004–3009. [PubMed: 7768795]
30. Mills M, Payne SM. Identification of shuA, the gene encoding the heme receptor of Shigella dysenteriae, and analysis of invasion and intracellular multiplication of a shuA mutant. Infect. Immun. 1997; 65:5358–5363. [PubMed: 9393841]
31. Ortiz De Montellano PR, Wilks A. Hemo oxygenase structure and mechanism. Adv. Inorg. Chem. 2000; 51:359–402.
32. Wilks A. Hemo oxygenase: evolution, structure, and mechanism. Antioxid. Redox Signaling. 2002; 4:603–614.
NIH-PA Author Manuscript
NIH-PA Author Manuscript
Figure 1.
Probability distributions of physicochemical properties in all four compound databases. (A) MW, (B) logP(o/w), (C) HDO, (D) HAC. Data is shown for the WDI (red), Maybridge (Green), ChemBridge (Blue), and ChemDiv (Magenta) databases.
NIH-PA Author Manuscript
NIH-PA Author Manuscript
Figure 2.
2D probability distribution of two physicochemical properties among MW, logP(o/w), HDO, and HAC in the WDI database. (A) MW vs logP(o/w), (B) MW vs HDO, (C) MW vs HAC, (D) logP(o/w) vs HDO, (E) logP(o/w) vs HAC, (F) HDO vs HAC. Correlation of determination, R2, for the respective plots were 0.12, 0.19, 0.40, 0.10, 0.06, and 0.51.
NIH-PA Author Manuscript
NIH-PA Author Manuscript
Figure 3.
Initial guess and optimized μ mean matricies, μ, and the variance-covariance matricies, S. Note μ4= 0 in the initial mean matrix as 0 is the maximum of the H-bond donor distribution
as shown in Figure 1D
NIH-PA Author Manuscript
NIH-PA Author Manuscript
Figure 4.
Comparison between observed probability from the WDI database and calculated probability based on improved 4D multivariate dependent Gaussian model. Linear
regression analysis was performed to obtain linear function: y = 0.92x − 3.0×10⁻⁵ with the square of correlation coefficient, R2, of 0.89.
NIH-PA Author Manuscript
NIH-PA Author Manuscript
Figure 5.
Probability distributions of the log 4D-BA values in all five compound databases: WDI, Maybridge, ChemBridge, ChemDiv, and SCUT. (A) Entire range and (B) low-scoring range. 4D-BA values were calculated based on four properties, MW, logP(o/w), HDO, and HAC using the 4D Gaussian dependent model (R2=0.89 model) shown in Figure 4.
NIH-PA Author Manuscript
NIH-PA Author Manuscript
Figure 6.
Probability distributions of the log 4D-BA values in all four BCS classes of compounds in the WHO essential medicines list. (A) whole range (B) high-scoring range 4D-BA values were calculated based on four properties, MW, logP(o/w), HDO, and HAC using the 4D Gaussian dependent model (R2=0.89 model) shown in Figure 4. BCS class 1, 2, 3, and 4 are shown in red, green, blue, and magenta respectively.
NIH-PA Author Manuscript
NIH-PA Author Manuscript
Figure 7.
Probability distributions of candidate SHP2 PTP domain inhibitors as a function of log 4D-BA score. Green line represents top 1000 compounds selected from database screening based on energy scoring. Red line represents 235 compounds selected manually from top 1000 compounds. Blue line represents top 235 compounds selected from the same 1000 compounds using our automated scheme shown in Scheme 1. Bin size of 0.5 in log 4D-BA value was used.
NIH-PA Author Manuscript
NIH-PA Author Manuscript
Figure 8.
Probability distributions of four physicochemical parameters in 235 compounds of candidate SHP2 PTP domain inhibitors selected manually or by the presented automated procedure. (A) MW, (B) logP(o/w), (C) HDO, (D)HAC Red lines represent the manual selection, while green lines represent the selection by automated procedure.
NIH-PA Author Manuscript
NIH-PA Author Manuscript
Figure 9.
Probability distributions of candidate nm-HO inhibitors as a function of log 4D-BA score. Green line represents top 1000 compounds selected from database screening based on energy scoring. Red line represents 153 compounds selected manually from top 1000 compounds. Blue line represents top 153 compounds selected from the same 1000 compounds using the automated scheme. Bin size of 0.5 in log 4D-BA score was used.
NIH-PA Author Manuscript
NIH-PA Author Manuscript
Figure 10.
Probability distributions of four physicochemical parameters in 153 compounds of candidate
nm-HO inhibitors selected manually or by the automated procedure. (A) MW, (B) logP(o/ w), (C) HDO, (D)HAC Red and green lines represent the compounds set from manual selection and automated selection using our procedure.
NIH-PA Author Manuscript
NIH-PA Author Manuscript
Scheme 1.
Flowchart of the compound selection scheme to maximize bioavailability and druglikeness as well as chemical and structural diversity.
NIH-PA Author Manuscript
NIH-PA Author Manuscript
NIH-PA Author Manuscript
NIH-PA Author Manuscript
NIH-PA Author Manuscript
Table 1
Mean MW, logP(o/w), HDO, HAC and standard deviations in the WDI, Maybridge, ChemBridge, ChemDiv compound databases. Database
MW logP(o/w) HDO HAC compounds WDI 363.4±146.8 2.7±2.6 1.8±1.9 3.5±2.7 52,638 Maybridge 323.7±89.4 3.3±1.8 0.9±0.9 2.5±1.4 61,619 ChemBridge 361.8±72.7 3.4±1.5 1.0±0.8 3.0±1.3 454,960 ChemDiv 406.7±76.3 3.7±1.6 1.0±0.8 3.5±1.4 760,648
NIH-PA Author Manuscript
NIH-PA Author Manuscript
NIH-PA Author Manuscript
Table 2
Impact of bin sizes for MW, logP(o/w), HDO, HAC on maximum number of compounds in a 4D bin.
MW logP(o/w) HDO HAC max. compounds in bin
25 0.5 1 1 104
25 0.5 2 2 177
50 1 1 1 348 (used for fitting)
NIH-PA Author Manuscript
NIH-PA Author Manuscript
NIH-PA Author Manuscript
Table 3
Top five most populated bins from the 4D histogram of the WDI database with bin sizes: 50 for MW, 1 for logP(o/w), 1 for HDO and HAC.
MW logP(o/w) HDO HAC # of compounds
325 3.5 1 2 348
275 3.5 0 1 278
275 3.5 0 2 243
325 3.5 0 2 239
NIH-PA Author Manuscript
NIH-PA Author Manuscript
NIH-PA Author Manuscript
Table 4
R2 values of the 4D Gaussian distribution models
Model Database parameters Fitted parameters
Independent 0.27 0.57 Dependent 0.55 0.89
NIH-PA Author Manuscript
NIH-PA Author Manuscript
NIH-PA Author Manuscript
Table 5
BCS compounds with log 4D-BA scores less that
− 10 Class 2 log 4D-BA MW logP(o/w) HDO HAC Comment Azithromycin −10.7 749.0 3.43 5 13 Macrolide antibiotic Digoxin −10.7 780.9 3.32 6 13 Cardiac glycoside Cyclosporin A −20.6 1202.6 5.29 5 12 Cyclic peptide Rapamycin −11.9 914.2 6.87 3 12 Marcolide immunosuppresant Class 4 log 4D-BA MW logP(o/w) HDO HAC Comment Amphotericin B −16.3 924.1 2.80 10 14 Polyene antifungal Colistin −47.7 1035.3 −7.38 12 12 Cyclic peptide