ANALISA FAKTOR-FAKTOR YANG MEMPENGARUHI LOYALITAS PELANGGAN
SHOES LAUDNRY QUICKCARES MANADO
ANALYSING FACTORS THAT DRIVES CUSTOMER LOYALTY OF SHOES LAUNDRY
QUICKCARES MANADO
By:
Maria Mawa1 W.J.F.Alfa Tumbuan2
Maria V.J.Tielung3
1,2,3 Faculty of Economics and Business, International Business Administration, Management Program, Sam Ratulangi University Manado
E-mail:
1mariamawa195@gmail.com 2wjf_alfa@yahoo.com 3mariatielung@gmail.com
Abstrak: Penelitian ini untuk menganalisa faktor-faktor yang mendorong loyalitas pelanggan shoes laundry Quickcares Manado. Shoe laundry adalah servis yang menawarkan pembersihan dan perawatan sepatu, loyalitas pelanggan adalah hasil dari pengalaman emosional yang positif secara konsisten, kepuasan berbasis atribut fisik kepuasan dan nilai pengalaman yang di rasakan, yang termasuk dalam produk atau servis. Penting untuk mengetahui faktor-faktor yang mendorong loyalitas pelanggan dalam bisnis, untuk menjamin kelangsungan bisnis dan untuk bertahan dalam kompetisi bisnis. Penelitian kuantitatif untuk mengukur data. Data di kumpulkan menggunakan kuisioner dibagikan kepada 100 orang yang sudah pernah menggunakan jasa shoes laundry Quickcares Manado. Metode analisa faktor di gunakan dalam penelitian ini. Analisa dan diskusi dari penelitian ini bahwa ada 19 variabel yang berkorelasi dengan faktor yang dilakukan. Temuan penelitian dari proses faktorisasi , ada 2 faktor yang mendorong loyalitas pelanggan dari shoes laundry Quickcares Manado. Faktor pertama adalah kualitas layanan dengan 12 varibel independen (kepuasan pelanggan, gambar merek, tangibility, responsifnes, asuransi, keandalan, reputasi perusahaan, waktu tunggu, tren, pengalaman pelanggan, kepercayaan) dan faktor kedua adalah pengambilan keputusan pelanggan dengan 7 variabel independen (inovasi, harga, tempat, promosi, biaya pengalihan, komitmen instrumental, komitmen rasional)
Kata Kunci: shoes laundry, loyalitas pelanggan, analisa factor
Abstract:This research is to analyzing what are the factors that drive customer loyalty of shoe laundry Quickcares Manado. Shoe Laundry is the services that offer to clean and taking care shoe, Customer Loyalty is the result of consistently positive emotional experience, physical attribute-based satisfaction and perceived value of an experience, which includes the product or services. It is important to know factors that drive customer Loyalty in business, in order to guarantee business continuity and to survive from business competition. Quantitative research seeks to quantify the data. Data was collected using questionnaire that distributed to 100 people that already used the services as respondents. The Factor Analysis method is used in this research.The analysis and discussion from this research there are 19 variables that correlated with the factor that already conducted. The findings from the factoring process there are 2 factors that drive customer loyalty of Shoe Laundry Quickcares Manado. First factor is Service Quality with 12 independent variables (Customer satisfaction, Brand Image, Tangibility, Responsiveness, Assurance, Empathy, Reliability, Corporate Reputation, Waiting Time, Trends, Customer Experience, Trust) and the second factor is Customer Decision Making with 7 independent variables (Innovation, Price, Place, Promotion, Switching Cost, Instrumental Commitment, Rational Commitment)
INTRODUCTION Research Background
6KRHV ODXQGU\ LV D QHZ EXVLQHVV DQG LW¶V D JRRG EXVLQHVV RSSRUWXQLW\ LQ ,QGRQHVLD EHFDXVH WKLV EXVLQHVV
is relatively new business. Shoes laundry is a business that offer service to clean and maintaining the shoes. Currently building a business with a creative concept is not enough. As time goes by there would certainly appear more competitors in this business. Customer loyalty is a needed in a business in order to survive from competition and to keep the continuity of the business it-self. Not all the customers have loyalty in the product or in company, it is because customers have variety of choices. In order to keep the customers loyalty to their business and to prevent the customers to other shoes laundry Company need to be able to identify and understand what is the factor that would drive the customer loyalty of shoe laundry Quickccares Manado.
Research Objective
The objective that be achieved by this research: To define the factors that drive the customer loyalty of shoes laundry Quickcares Manado
THEORITICAL REVIEW Marketing
Marketing is one of way to help company to achieve the company goal. Marketing is a way for the company to communicate with customer, to know what are the customer wants and needs. Marketing is how the organization delivering their product or services value to the customer. According to the American Marketing Association (2013) Marketing is the activity, set of institutions, and processes for creating, communicating, delivering, and exchanging offerings that have value for customers, clients, partners, and society at large
Customer Loyalty
Customer loyalty is a repeat purchase made by a customer for a commitment to a brand or company (Kotler, 2005;18) . Customer loyalty can be an advantage to business. Loyalty will provide many benefits for the company, including purchases looping and recommendations on brands The family and friends (Lau dan Lee, 1999). The result of customer loyalty is repurchase the services or product and also willingness of customers to give recommendation to the society, family and friends about the business.
Customer satisfaction, happen when company can fulfill the customer expectation with the good performance quality. Customer will feel satisfied and will consider to re purchase and customer satisfaction can lead to customer loyalty. Grönholdt, Martensen, Kristensen (2000: 510) state that when satisfaction is increase, it should increase customer loyalty.
Brand image is how the consumer will feel and will expect from the product or services from the company. First impression is a key to gain a customer to be loyal with the brand. Aaker (1991) brand image creates importance and helps the consumer in collecting information, differentiate the brand, create reason to purchase, and creates constructive feelings extension.
Since services are in-tangible, customers drive their perception of service quality by comparing the tangible. Tangible products differ in that they can usually be directly experienced²seen, touched, smelled, or tasted. In context of service quality, tangibles can be classified as equipment, physical facilities and their appearance (ambience, lighting); and the employee as stated by Blery et al. (2009).
Responsiveness is how the company (employee) find a way to help customers with the customer's requests, questions, complaints and problems. It is defined by Dwyer, Schurr, Oh (1987) as a supplier's ability to avoid potential conflicts, solve manifest conflicts before they create problems, and discuss solutions openly when problems do arise. When we can solve the customer problem it can make the customer feel special and will trust with the services that offered by the company.
Assurance is defined as employees' knowledge of courtesy and the ability of the firm and its employees to inspire trust and confidence to the customers. Assurance is developed by the level of knowledge and courtesy displayed by the employees in rendering the services and their ability to instill trust and confidence in customer (Blery et al., 2009). Thus, employees are aware of the importance to create trust and confidence from the customers to gain competitive advantage and for customers' loyalty.
Empathy means taking care of the customers by giving attention at individual level to them (Blery et al., 2009). Empathy refers to how the company attention to their customers, to make the customers feeling special.
If the customers feel they get attention and cares from the company , there is a big chance that they will return to the company and do re-purchase. If the company know what are the customer wants and needs in order to keep the loyalty of customer.
Reliability is how the company are performing and completing their promised service, quality and accuracy within the given set requirements between the company and the customer. Every customer wants to know if their service or good provider is reliable and fulfill the set requirements with satisfaction.
For the customers when they like to purchase product and services, they need to find out the information about the product and services it-self so they can decide which product or services provide they will choose. Create a good corporate reputation in society will help the customers to choose the service or product provider easily. There is a positive effect of company reputation on loyalty is examined by (Loureiro and Kastenholz 2011).
Waiting time is the time required for a process waiting in the ready queue. The smaller the waiting time, is better. Bielen and Demoulin (2007) have reported that waiting time has a significant influence on customer loyalty, especially in service industries.
Trend is everything that is being talked about, Look, Worn or utilized by the majority of people at any given moment. Trends can be long-lasting or short-lived. Reena (2012) claims that when it comes to trends, people are most likely to select products/services as a result of marketing efforts and being influenced by the opinions and recommendations of their immediate surroundings, i.e., family, friends, school etc. This is because people are more confident buying something a family or friend has expressed satisfaction with.
Every company provides a customer experience. Regardless of whether you create it consciously or you create it. That experience may be good, bad or indifferent, but the very fact that you have customers, you interact with those customers in some manner, and provide them products and services, means that they have an experience with you and your brand. Chun (2014) discusses the positive effect of reputation on customer's loyalty and stakeholder's perceptions.
Trust is defined as customer expectation that the provider dependable and can be relied on to deliver promises. Trust is also considered as a key element in establishing long-term relationships with customers and
LQ PDLQWDLQLQJ D FRPSDQ\¶V PDUNHW VKDUH 8UEDQ 6XOWDQ DQG 4XDVK ,Q EXVLQHVV WUXVW UHIHUV WR WKH
FRQILGHQFH WKDW RQH SDUWQHU WKH FXVWRPHU KDV LQ WKH EXVLQHVV¶V UHOLDELOLW\ DQG integrity to deliver goods and
services (Proctor, 2000).
The process of translating an idea or invention into a good or service that creates value or for which customers will pay. Innovation is the process of updating / use / development to create new things that are different from the previous. According to Suryana (2008: 32), innovation is creativity which translates into something that can be implemented and provide added value over its resources. Innovation is closely related to consumer satisfaction.
3ULFH LV DPRXQW RI PRQH\ H[SHFWHG UHTXLUHG RU JLYHQ LQ SD\PHQW IRU VRPHWKLQJ )URP WKH FRQVXPHU¶V
perspective, price is what the customer pays or gives for obtaining the product or service. Fairness of price is a psychological factor that plays an imporWDQW UROH LQ WKH FXVWRPHU¶V UHDFWLRQ WR WKH SDLG SULFH .LP /HH DQG <RR
2006). For some customer prices is the most important factor that affect customer preferencebut others, brand and equity of product are most important things.
Place can be related for available for the services it self. By knowing where the place their customer conduct the purchasing act, they will be able to maximize their service to the customer and also minimize the cost of distribution and increase revenue (Kotler and Keller, 2009). Customers need to be able to find and get to your business easily. increase customer loyalty since the customer will feel comfortable to because it was easy to found service business in the market.
Promotion deals with informing and persuading the customers regarding the company product. According to McDaniel, Lamb and Hair (2011: 533) one of primary benefit of advertising is its ability to communicate to the large number of people at one time. Consider the customers and how sensitive they are to specials and promotions.
Switching costs are the costs that a consumer incurs as a result of changing brands, suppliers or products. Switching costs are the costs incurred by the consumer due to switch to another provider who will not be experienced if consumers remain loyal to the current service providers (Lee, Lee and Feick, 2001).
The action/feeling after a product purchase is called Post purchase behavior. If consumers are satisfied with the decision then the consumer will make the purchase again if otherwise customers will file a complaint or
even make the turn for the brand as a form of regret over the decision that has been made (Tsiros and Mittal, 2000).
Instrumental commitment: this occurs when customers are convinced that no other offer or company could do a better job of meeting their needs. Morgan and Hunt (1994), commitment stems from trust, shared values and the belief that it will be difficult to find partners that can offer the same value. When a customer feels that his or her provider has the best products, the best access, the best processes, and the best reputation, he or she is committed.
Rational commitment, customers can become highly attached to a company's people. An emotional tie may be formed with an individual person, a work group or the generalized company as a whole. Rational commitment, commitment to believe what you know to follow for one of your belief.
Previous Research
Rizwan Ali, Gao Leifu, and Ramiz Ur Rehman, (2014) the research shows the impact of service quality, trust and reputation on customer loyalty in banking industry are examined. The outcome of the regression analysis shows that all the factors have positive effects on customer loyalty. Tariq M. Khizindar, Abdel Fattah M. Al-Azzam, and Iyad A. Khanfar (2015) research An Empirical Study of Factors Affecting Customer Loyalty of Telecommunication Industry in the Kingdom of Saudi Arabia The findings of the path analysis showed that price, service quality, brand image and trends significantly affected customer loyalty. Mohammad Haghighi, Ali Dorosti, Afshin Rahnama and Ali Hoseinpour (2012) results show that food quality, service quality, restaurant environment, and perception of price fairness had a positive impact on customer satisfaction, but the impact of restaurant location on customer satisfaction was not confirmed. Customer satisfaction had a
SRVLWLYH LPSDFW RQ FXVWRPHU OR\DOW\ EXW WKH HIIHFW RI FXVWRPHU WUXVW RQ FXVWRPHU OR\DOW\ ZDVQ¶W FRQILUPHG /
Bricci, A. Fragata, and J. Antunes (2016) This research has shown that trust has a positive and direct effect on commitment, also trust has a positive and direct effect on satisfaction, commitment has a positive and direct effect on loyalty and satisfaction has a positive and direct effect on loyalty.
Conceptual Framework
From this Conceptual Framework, this study aims to find out the factors that drive customer loyalty. There are 20 variables in this research. This study aims to analyzing factors that Drive Customer Loyalty of Shoes laundry Quickcares Manado
RESEARCH METHOD Type of research
Quantitative method is used to collect the data in this research. quantitative research is explaining phenomena by collecting numeric data that are analyzed using mathematically based methods (in particular statistic).This research in field of marketing management analyzed the factors that drive customer loyalty of shoes laundry Quickcares Manado.
Place and Time of Research.
This research had been conducted in Manado with the period time from April 2017 ± June 2017.
Population and Sample
The population of this research is all the customer of shoes laundry Quickcares Manado. Gorsuch (1983) recommended that sample should be at least 100. The sample is those who already using this services. The sample of this research is 100 customer of shoes laundry Quickcares Manado
Operational definition
There are 20 variables that will be used in this research. There are customer satisfaction , brand image, tangibility, responsiveness, assurance, empathy, reliability, corporate reputation, waiting time, trends, customer experience, trust, innovation, price, place, promotion, switching cost, post-purchase behavior, instrumental commitment, rational commitment.
Data Analysis Method Validity and Reliability Test
Validity test is used to measure the legitimacy or validity of a questionnaire. The main usage of reliability test is to make sure that the used measurement toll (questionnaire) is really consistent in measuring some cases, even thoug the observation has been conducted frequently at the same object. To ensure that all questions in the questionnaire are truly reliable, so the measurement of the internal consistency is made.
Confirmatory factor analysis
Confirmatory factor analysis (CFA) is a multivariate statistical procedure that is used to test how well the measured variables represent the number of constructs. Confirmatory factor analysis (CFA), researchers can specify the number of factors required in the data and which measured variable is related to which latent variable. CFA is often the analytic tool of choice for developing and refining measurement instruments, assessing construct validity, identifying method effects, and evaluating factor invariance across time and groups. The purpose of confirmatory factor analysis: first to identify the relationship between variables to test the correlation. Second is the objective to test the validity and reliability of the instrument. In testing the validity and reliability of the instrument or questionnaire to obtain data that is valid and reliable research with confirmatory factor analysis.
RESULT AND DISCUSSION Factor Analysis
Validity and reliability
The result of Person Correlation data process. If the value of Person Correlation > 0.5 it means the statement is valid. If the value of Person Correlation <0.5 it means the statement is not valid. And if significant value <0.05 then the statement is correlated but if significant value > 0.05 then the statement is not correlated. If the statement is not Valid, it will be eliminated for further test and analysis. All statements of the variable is Valid, based on Pearson Correlation Value > 0.5 and the significant is < 0.05. we can conclude that all the statement are Valid and can be used for further test and analysis
7KH LQWHUSUHWDWLRQ RI &URQEDFK¶V Alpha is: <0.6 indicates unsatisfactory internal consistency or consider that the data is unreliable. 0.7 indicates that the data is acceptable. 0.8 indicates good internal consistency or consider that the data resulted is reliable
Reliability Test result X1± X20
Cronbach's Alpha : .960
Cronbach's Alpha Based on Standardized Items : .969
N of Items : 60
Since the Cronbach's Alpha value is 0.960, the data are considerate are reliable, and for the N of Items 60 that explain how many question in this test. So the data can be used for the further test and analysis.
Factor Anlaysis
There are 4 steps for doing factors analysis, (1) data collection method and generate of the correlation matrix, (2) extraction or initial factor solution, (3) rotation and interpretation, and(4) construction of scales or factor scores to use in further analysis. For this factor analysis, there are 20 variables in this research with 60 indicators.
Table 1. KMO and Bartlett's Test
Kaiser-Meyer-Olkin Measure of Sampling Adequacy. 0,906
Bartlett's Test of Sphericity Approx. Chi-Square 1405,439
Df 190
Sig. 0
Source: SPSS Output, 2017
The value of KMO and Bartlett's Test for correlation between required variables is> 0.5. The significance of the study was 0.05. From the above results obtained KMO value of 0.934, which means greater than 0.5. The result of calculation with SPSS resulted Barlett Test of Spehricity value of 1701.742 with significance of 0.000. Thus Bartlett Test of Spehricity meets the requirements because of significance below 0.05 (5%). With the results above, it can be said that the variables and samples are allow for further analysis.
Table 2 Measures of Sampling Adequancy
Initial Customer satisfaction X1 .947a Brand Image X2 .928a Tangibility X3 .938a Responsiveness X4 .935a Assurance X5 .935a Empathy X6 .964a Reliability X7 .960a Corporate reputation X8 .911a Waiting Time X9 .933a Trends X10 .941a Customer Experience X11 .937a Trust X12 .930a Innovation X13 .957a Price X14 .928a Place X15 .935a Promotion X16 .957a Switching Cost X17 .812a Post-Purchase Behavior X18 .674a Instrumental Commitment X19 .935a Rational Commitment X20 .922a Source: SPSS Output, 2017
Based on Table 2 All the data that has been processed, the output from IBM SPSS Statistic are all the variables value is more than 0,5. Therefore all 20 variables are correlated to process for the further test and analysis.
Table 3.Communalities (Principal Component Analysis)
Initial Extraction Customer satisfaction X1 1,000 .697
Brand Image X2 1,000 .652
Responsiveness X4 1,000 .740 Assurance X5 1,000 .720 Empathy X6 1,000 .790 Reliability X7 1,000 .712 Corporate reputation X8 1,000 .487 Waiting Time X9 1,000 .637 Trends X10 1,000 .648 Customer Experience X11 1,000 .740 Trust X12 1,000 .695 Innovation X13 1,000 .686 Price X14 1,000 .604 Place X15 1,000 .665 Promotion X16 1,000 .697 Switching Cost X17 1,000 .549 Post-Purchase Behavior X18 1,000 .566 Instrumental Commitment X19 1,000 .698 Rational Commitment X20 1,000 .692 Source: SPSS Output, 2017
Based on table 3, can be seen from the results of extraction, that the variance at Variable 1 is 0.697, it means that 69,7% variance from variable 1 can Explained by factors to be formed. Variable 2 is 0,652 it means 65,2% variance of variable 2 can be explained by factors that be formed. And so on until variable 20.
In Total variant explained, from 20 variables that formed 2 components. For the 1st factor which formed will explain 58.395 variation of data and for the second factor is 66.968 variation of data. The variance can be explained by by factor 1 is 11.679 / 20 x 100% =58.395. While by factor 2 equal to 1.715 / 20 x 100% = 66.968 Thus, since the value of Eigenvalues is set 1, the Total value to be taken is that> 1 is component 1 and 2. Once we know that the maximum factor that can be formed is 2, then we make the determination of each independent variable will go into factor 1 or factor
Table 4.Component Matrixa
Component 1 Component 2 Customer satisfaction X1 0.832 -0.07 Brand Image X2 0.749 -0.301 Tangibility X3 0.795 -0.293 Responsiveness X4 0.802 -0.311 Assurance X5 0.806 -0.265 Empathy X6 0.872 -0.169 Reliability X7 0.833 -0.133 Corporate reputation X8 0.656 0.24 Waiting Time X9 0.798 -0.012 Trends X10 0.805 0.001 Customer Experience X11 0.858 0.064 Trust X12 0.831 -0.07 Innovation X13 0.773 0.298 Price X14 0.638 0.444 Place X15 0.811 0.086 Promotion X16 0.82 0.154 Switching Cost X17 0.45 0.588
Post-Purchase Behavior X18 -0.271 0.702 Instrumental Commitment X19 0.78 0.3
Rational Commitment X20 0.827 0.089
Source: SPSS Output, 2017 Extraction Method: Principal Component Analysis.
Based on the data output of component matrix table, it can determined how big the correlation of each variable with the factor that has been formed. The component matrix result are appropriate and variables have be correlated to each variable. This table contains components loading, which are the correlation between the variable and component. There still variables that have no significant difference with some other indicators and there is still a value of loading or a large correlation of less than 0.5, Therefore it is necessary to rotate factors to clarify the position of these variables. From this data result there is no variables that eliminated yet.
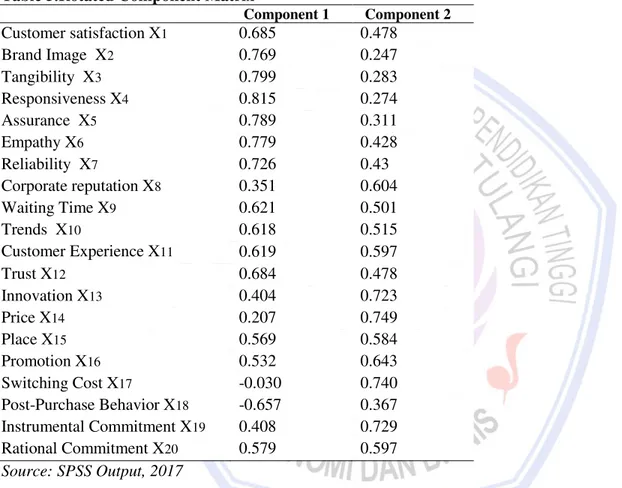
Table 5.Rotated Component Matrix a
Component 1 Component 2 Customer satisfaction X1 0.685 0.478 Brand Image X2 0.769 0.247 Tangibility X3 0.799 0.283 Responsiveness X4 0.815 0.274 Assurance X5 0.789 0.311 Empathy X6 0.779 0.428 Reliability X7 0.726 0.43 Corporate reputation X8 0.351 0.604 Waiting Time X9 0.621 0.501 Trends X10 0.618 0.515 Customer Experience X11 0.619 0.597 Trust X12 0.684 0.478 Innovation X13 0.404 0.723 Price X14 0.207 0.749 Place X15 0.569 0.584 Promotion X16 0.532 0.643 Switching Cost X17 -0.030 0.740 Post-Purchase Behavior X18 -0.657 0.367 Instrumental Commitment X19 0.408 0.729 Rational Commitment X20 0.579 0.597 Source: SPSS Output, 2017
Based on the output table 5 For Variable X18 the loading value is < 0.5 it means that the variable is eliminated for the next research and analysis. For the variable 1, 2, 3, 4, 5, 6, 7, 9, 10, 11, 12 is included in factor 1, because the loading value of the variables is more than Factor 2. For the variable 8, 13, 14, 15, 16, 17, 19, are included in factor 2 because the loading value of the variables is more than factor 1.
Result of Regression Analysis
This research is aim to answer research question what are the factors that drive customer loyalty
Table 6 Regression Models and Variables
Regression Model Dependent Variable Independent Variable
First Factor Service Quality Customer satisfaction, Brand Image, Tangibility, Responsiveness, Assurance, Empathy, Reliability, Corporate Reputation, Waiting Time, Trends, Customer Experience, Trust
Second Factor Customer Decision Making
Innovation, Price, Place, Promotion, Switching Cost, Instrumental Commitment, Rational Commitment
Source: Data Processed 2017 Discussion
Total respondent is 100 people. For the sampling technique for this research was convenience sampling. The result of this research, based on Rotation Component Matrix there are 1 variable that eliminated (X18). Based on the result of the output from the 19 variables there are 2 factors that finally conducted. It caused by the
HLJHQ YDOXH DERYH RQO\ FRPSRQHQWV LQ 3ULQFLSDO &RPSRQHQW $QDO\VLV 7KDW¶V ZK\ WKH IDFWRULQJ SURFHVV LV
only in 2 factors. First factor is service quality with 12 independent variables and the second factor is Customer Decision Making with 7 independent variables
CONCLUSION AND RECOMMENDATION Conclusion
Based on the analysis and discussion, there are 2 factors that drive customer loyalty of Shoes laundry Quickcares Manado. First factor is Service Quality and the second Factor is Customer Decision Making.
1. Service Quality
The dependent variable Service Quality is the first factor that driving the Customer Loyalty of shoes laundry Quickcares Manado, and for the Independent variable are: Customer satisfaction, Brand Image, Tangibility, Responsiveness, Assurance, Empathy, Reliability, Corporate Reputation, Waiting Time, Trends, Customer Experience, Trust
2. Customer Decision Making
For the second factor that drive customer Loyalty of Shoes laundry Quickcares Manado is Customer Decision Making. For the independent variable are: Innovation, Price, Place, Promotion, Switching Cost, Instrumental Commitment, Rational Commitment.
Recommendation
Based on the conclusions, the recommendation can be proposed. The Researcher recommended for the owner of Shoes laundry Quickcares Manado, in order to make the customer loyal on the business are: Customer satisfaction, the services of Shoes laundry Quickcares need to fulfill the customer expectation by giving good performance in cleaning the shoes. Brand Image, a good brand image of the company will remain the loyal customer. Create a good brand image towards society with the services itself. Tangibility, for the store of shoes laundry Quickcares Create a comfortable and beautiful storefront for the customer. Responsiveness, the employee needs to helping the customer as soon as possible when there is a complaint, question, and problem with the result of the services. Assurance, employee of shoes laundry Quickcares need to understand all the information about the services that been offered Empathy, give the customer more attention when they using the services. Make the customer feels special or get extra valued with the services from the employee. Reliability, develop the pick-up and delivery proses to be more efficient. Corporate Reputation, collaborate with other has the same characteristic such as shoe store in Manado. Waiting Time, provide a efficiency way of queue for the customers . Trends, always keep up-to-date with the development changes in society. Asking for the feedback about the services to the customer. Customer Experience, establish a good relationship with the customer interact with the customer by giving a tips to how to treat well the shoes. Trust, the quality of Shoes laundry Quickcares need to more improve to maintain the customer confidence with the services. Do not hesitate to give a refund or compliment to the customers. Innovation, always create the latest innovations regularly about the services or the offer for the customer to avoid customer boredom with the services. Price, do not raise the price suddenly without any information and explanation for the customer. Place, the customer need to be able find or access the business easily. Promotion, raise the customer awareness by giving a discount or free services for the customer who already using the services, for example using the services more than 10 times get free shoe cleaning. Switching Cost, in order to make the customer hard to move to another competitors shoes laundry Quickcares need to maintain the service quality and don put a high price for the shoes laundry. Instrumental Commitment, build a bond with the customer, by giving a good experience while they use the
services of Shoes laundry Quickcares Manado. Rational Commitment, make the customer feel become part of the business, for example asking for suggestion from the customer in order to develop the business.
REFERENCE
Aaker, D A. 1991, Managing brand equity. Free Press New York, 19-23. American Marketing Association. 2013. Definition of Marketing.
Bielen, F., and N. Demoulin. 2007. Waiting time influence on the satisfaction-loyalty relationship in services, Managing Service Quality, Vol. 17, No. 2, pp. 174-193
Blery, E., N. Batistatos., E. Papastratou., I. Perifanos., G. Remoundaki., & Retsina, M. 2009. Service quality and customer retention in mobile telephone. Journal of Targeting, Measurement and Analysis for Marketing, 17 (may) 2017. pp 27-37.
Dwyer, F.R., P. H. Schurr., S. Oh, 1987, "Developing buyer-seller relationships", Journal of Marketing, Vol. 51 No.1. 15 (april) 2017. Pp. 11-27.
Gorsuch, R.L. 1983. Factor Analysis (2nd ed). NJ: Erlbaum. Hillsdale
Grönholdt, L., A. Martensen., K. Kristensen. 2000 The relationship between customer satisfaction and loyalty: cross-industry differences. ± Total Quality Management, Vol. 11, Nos. 4/5&6. 5 (april) 2017. pp. 509±514 Jonathan Lee, Janghyuk Lee, Lawrence Feick, 2001 "The impact of switching costs on the customer satisfactionæloyalty link: mobile phone service in France", Journal of Services Marketing, Vol. 15 Iss: 1. 3 (may) 2017. pp.35 - 48
Kim WG, YK. Lee, YJ. Yoo. 2006. Predictors of relationship quality and relationship outcomes in luxury restaurants. J. Hosp. Tour. Res., 30 (june) 2017: pp. 143-169.
Kotler, P., & K. L. Keller. 2009. Marketing Management. 13th Edition Prentice Hall, UK, London
Kotler, P., & K. L. Keller. 2005. Marketing management.N.J: Pearson Prentice Hall. Upper Saddle River Lau, G. T. and S. H. I. Lee. 1999. Customer Trust in a Brand and the Link Brand Loyalty. Journal of Market Focused Management. Vol. 4. (25 april 2017) pp. 341-370.
Loureiro, S. M. C. and E. Kastenholz . 2011. "Corporate reputation, satisfaction, delight, and loyalty towards rural lodging units in Portugal." International Journal of Hospitality Management. 30( march) 2017. Pp. 575-583
Mcdaniel, C.,C. Lamb.,J.Hair. 2011 Introduction to marketing, 11th Edition. South ± western: Cengace Learning. USA
Morgan, R. M & Hunt, S. D. 1994. ³7KH commitment-WUXVW WKHRU\ RI UHODWLRQVKLS PDUNHWLQJ´ Journal of Marketing. 28(april) 2017. Pp. 20-28
Proctor, T. 2000. µ6WUDWHJLF 0DUNHWLQJ $Q ,QWURGXFWLRQ¶. Routledge. London
R. Chun. 2014 Corporate reputation: Meaning and measurement .International Journal of Management Reviews, 2 (may) 2017, pp. 91±109
Reena, N .2012. A study on factors influencing brand loyalty in mobile service providers among college of business students of University Utara Malaysia. Thesis unpublished University Utara Malaysia.
Suryana. 2006. Kewirausahaan, Pedoman Praktis, Kiat Dan Proses Menuju Sukses. Edisi Revisi. Salemba Empat, Jakarta.
7VLURV 0LFKDHO DQG 9LNDV 0LWWDO ³5HJUHW $ 0RGHO RI ,WV $QWHFHGHQWV DQG &RQVHTXHQFHV LQ &RQVXPHU
'HFLVLRQPDNLQJ ´ Journal of Consumer Research, 26 (March) 2017, 401-17.
Urban, G., Sultan, F. and Qualls, W. (2000). Placi ng Trust at the Center of Your Internet Strategy. Sloan Management Review , 42 (1). 3 (june) 2017. pp 39-4