ScienceDirect
International Journal of e-Navigation and Maritime Economy 5 (2016) 045 – 060
Original article
AIS Data Visualization for Maritime Spatial Planning (MSP)
*
Michele FIORINI
1,
Andrea CAPATA
2, Domenico D. BLOISI
31 The Institution of Engineering and Technology (IET), Italy Network, Rome, Italy, [email protected], Corresponding Author
2Meetatnine Srls, Rome, Italy, [email protected]
3 Dept. of Computer, Control, and Management Engineering, Sapienza University of Rome, Rome, Italy, [email protected]
Abstract
The constant increase in marine traffic and the simultaneous growth of the demand for exploiting marine areas (e.g., installing offshore wind power plants) require an adequate planning strategy for managing high traffic volumes. Maritime Spatial Planning (MSP) is the process of public development of an allocation plan for distributing, both spatially and temporally, human activities in marine areas. The adoption of e-Navigation is a possible solution for improving safety and security at sea by integrating maritime information on board and ashore. Automatic Identification System (AIS) data represents a fundamental source of information, since the analysis of AIS data can highlight the presence of congested areas as well as of illegal actions, such as smuggling, pollution, and unauthorized phishing in protected areas. Indeed, those activities are often characterized by abnormal manoeuvres that can be recognized by analyzing the routes of the vessels. However, the huge dimension of the AIS data to process requires the adoption of careful strategies for the data visualization. In this paper, we present a complete pipeline for visualizing ship routes from raw AIS data, which is a fundamental pre-requisite for carrying out a significant AIS-based route analysis, and describe a real case study, where 90 million AIS records, corresponding to one month of world-wide observations, are visualized using only open-source software.
Keywords: e-Navigation, AIS data, AIS data visualization, route analysis, intelligent transport systems
Copyright གྷ 2016, International Association of e-Navigation and Ocean Economy. Hosting by Elsevier B.V. This article is an open access article under the CC BY-NC-ND license (http://creativecommons.org/licenses/by-nc-nd/3.0/).
Peer review under responsibility of Korea Advanced Institute for Intelligent Maritime Safety and Technology. *This is a revised version presented at the 3rd Ai-MAST held at Riviera Hotel, Daejeon, Korea, November 12-14, 2015 http://dx.doi.org/10.1016/j.enavi.2016.12.004
46
I. Introduction
Global shipping and the movement of goods by sea have seen substantial changes during the last decade, in terms of both sheer number and dimension of ships. Maritime transport grows at an average rate of over 8.5 percent every year: Over 90% of world’s trade is carried by sea for a total of 23 million tonnes of cargo and 55,000 cruise passengers travelling by ship every day (IMO, 2015). Cruise alone has tripled its size between 1999 and 2009, carrying over 6,000 passengers on ultra-large cruise ships.
On March 2012, Ms Maria Damanaki, European Commissioner for maritime affairs and fisheries, started her keynote speech at the European Commission in Brussels with the following words: “Today the oceans and seas around the European Union are shrinking. They are not becoming smaller, but more and more users are racing to develop their activities there, and to compete with those who are already there” (Damanaki, 2012). This means that it is time to develop an adequate and integrated monitoring and surveillance strategy for sea traffic. This strategy has to be compatible with the interconnected global economy and has to consent a more efficient management of the increasing traffic volume as well as low emissions.
The challenge of establishing the rules for sustainable growth in the maritime sectors is addressed by the process of Maritime Spatial Planning (MSP), defined by UNESCO as the public development of a plan for allocating the spatial and temporal distribution of human activities in marine areas (MSP Forum, 2015). An interesting case study concerns the installation of offshore wind turbines, which is becoming an important factor to be considered in the MSP process. Indeed, abundant offshore wind resources have the potential to supply immense quantities of renewable energy to major U.S. coastal cities, such as New York City and Boston (BOEM, 2015). Offshore wind energy is still growing from 4 GW capacity in 2012 to 150 GW expected in 2030, i.e., a 4,000 percent increase! (Fiorini and Chang, 2012). On one hand, ‘green’ initiatives, such as switching to renewable energy collected in power plants offshore as well as temporary or permanent marine nature reserves, have gained priority allocations in certain quarters of the sea by the MSP process. The ‘message’ of this is that people living ashore make it clear, by means of their laws and regulations, that they are not prepared to accept just any environmental risk or damage or even ‘only’ certain environmental side-effects of the current way of living any longer, as in the case of energy supply. They are also not prepared to accept replacement of nuclear energy with fossil energy resources to any degree, because of its negative side effects on the world climate. Hence, the acceptance of the usage of offshore sea areas for the construction and operation of offshore renewable energy sources.
On the other hand, people living ashore want to reap the benefits of the current way of living. This results in the following value derivation chain: The current way of living necessitates and incurs (global) trade, which in turn creates (overseas) maritime transport that prompts maritime traffic. Maritime traffic can again be construed as consisting of the ‘berth-to-berth navigation’ of many vessels, which immediately prompts the most relevant attributes of vessel navigation and vessel traffic, namely, safety, efficiency, security, and environmental friendliness (or ‘greenness’), amongst others (Fiorini and Lin, 2015). Furthermore, the rising demand for marine aquaculture
47
installations and oilrigs can generate conflicts with existing fishing and commercial routes. For example, since fishers move between varying areas depending on the fishing season and the species targeted, fishing route visualization over time is an important factor to be considered in the process of MSP (Jentoft and Knol, 2014).
To deal with the MSP challenge, the International Maritime Organization (IMO) launched their e-Navigation strategy in 2008 by a decision of their Maritime Safety Committee (MSC), with the goal of harmonizing marine navigation systems to improve safety and security at sea by integrating maritime information onboard and ashore (IMO, 2009). E-Navigation is conceived to improve the traditional traffic management instruments and measures by enhancing berth to berth navigation and related services for safety and security at sea and protection of the marine environment. The e-Navigation prerequisites can be summarized as follows:
x Electronic Navigation Charts (ENC) – worldwide coverage required; x Electronic Positioning System – a robust fail-safe (with redundancy); x Ship-Shore link – an agreed communication infrastructure.
The expected e-Navigation outcomes are:
1. Ship based systems – integration of ship’s own sensors; electronic positioning; Electronic Navigational Charts (ENC); decision support capability to reduce human error;
2. Shore based systems – management of vessel traffic and related services from ashore; 3. Communications infrastructure – authorized information transfer on board ship,
ship-to-ship, ship-to-shore and shore-to shore.
From the above considerations, it derives that, to achieve the expected e-Navigation goals and to manage properly all the maritime stakeholder assets, it is crucial to have a clear and easy-to-use representation, generated from the MSP process, of the maritime traffic scenario. Here we propose to use Automatic Identification System (AIS) data coming from vessels navigating across large geographical areas to help in addressing the MSP challenge. AIS traffic messages represent a fundamental source of information, since from the analysis of AIS data it is possible to:
1. Derive information about the ‘traffic level’ in specific areas. Recently, UK shipping activity and routes have been mapped from AIS data for the identification of sea area use (MMO, 2014);
2. Extract knowledge for situational prediction, e.g., automatically discovering fishing areas based on historical AIS data broadcast by fishing vessels (Mazzarella et al., 2014); 3. Detect anomalies, which can be caused by illegal actions, such as smuggling, pollution,
48
could identify risk areas associated with the joint predicted presence of commercial merchant traffic and pirates groups (Pallotta et al., 2013).
In this work, we focus on the process of route extraction from AIS data, which is the starting point for the application of machine learning techniques to carry out the above listed activities. Indeed, navigation patterns can be recognized by constructing and analyzing the routes of the vessels. The main contribution is to reconstruct target patterns from row data reports - mainly satellite AIS with global, worldwide, coverage - making use of open source software only. The process pipeline has been reported in details, starting from a row data database of more than 90 million records (satellite AIS reports). The result is an innovative approach based straightforwardly on open-source software to obtain a data visualization scheme that is customizable by the user (by selecting specific attribute values) and that can be used to perform high-level route analysis.
The remainder of the paper is organized as follows. Section II presents a brief overview of the analysis techniques for wide area surveillance, i.e., methods for the statistical analysis of vessel trajectories, which can benefit from the proposed approach. Section III describes the components needed to obtain a suitable representation of vessel routes from raw AIS data and the functional modules required for visualizing the data. A case study is presented in section IV: It is worth noting that only open sources software are used to process the data, which comes from real observations. Finally, conclusions are drawn in Section V.
II. Statistical Analysis of Vessel Trajectories
The application of statistical methodologies to derive motion patterns from a collection of trajectories is a heavily studied topic. However, the number of papers dealing specifically with the problem of trajectory analysis in the maritime domain is rather low, mainly due to the difficulties in obtaining real data.
Two recent surveys about maritime anomaly detection have been realized by Martineau and Roy (2011) and Pallotta et al. (2013). From the analysis of the literature, two main categories can be used to group existing methods dealing with maritime data:
x Grid-based approaches;
x Methods using vectorial representation of traffic.
In the grid-based approaches, the area to be monitored is divided into cells to create a spatial grid. The cells are characterized by the motion properties of the crossing vessels. A multi-step approach for suspect vessel detection and track propagation is presented in (Vespe et al., 2008). The described steps are: (i) Knowledge-based filtering and tracking; (ii) Model-based track prediction; (iii) Data correlation; and (iv)a Neural Network based data characterization. Both navigational and geographical knowledge is exploited for data association, while vessel motion
49
features and the scenario influence are used for estimating the degree of confidence for the correlation.
A learning-based maritime domain awareness system to produce predictions of future vessel location based on the current vessel behaviour is presented in (Bomberger et al., 2006), where AIS data recorded from the Miami Harbor area (USA) are processed. George et al. (2011) present an anomaly detection scheme, which utilizes a context-aided tracker to perform situation/threat refinement and assessment by means of a hypothesis generator. A test case scenario is developed considering Hampton Roads Bay, Virginia (USA). The area of interest is divided into cells to form a grid-field and a ‘trafficability value’ is assigned to each cell based on the target vessel type and the individual contextual data. In particular, a region that is completely traversable has a trafficability value equal to one, while a trafficability value equal to zero indicates not traversable zones. As pointed out by Pallotta et al. (2013), the grid-based methods are effective when the surveilled area is small, while their effectiveness decreases if the size of the monitored area is considerable. Indeed, the main limitations of the grid-based approach resides in the required computational burden and in the need of performing an a priori selection of the optimal cell size.
The second group contains the methods that use a vectorial representation of traffic, i.e., vessel trajectories are modeled as a set of connected waypoints. In such a way, vessel motions in large areas (e.g., at a global scale) can be managed thanks to the high compactness of the waypoint representation. The use of a node-sparse network to model the ocean traffic is illustrated in (Nevell, 2009), where a closed polygon represents each landmass in the World and Great Circle branches are generated between pairs of nodes that are not impeded by any intervening landmass. A Bayesian approach is adopted for estimating the likelihoods for a range of journey destinations. Lane et al. (2010) describe a similar representation, where the nodes correspond to waypoints near land masses, and Great Circle routes are formed to represent ocean journeys. The concept of intermediate nodes to increase the precision level in the description of the routes is introduced in (Vespe et al., 2012). This is useful especially in areas with high traffic. An important drawback of the methods based on a vectorial representation is the difficulty in being effective when unregulated areas are monitored. Indeed, where the behavior of vessels is difficult to categorize, the vectorial representation shows its limitations (Pallotta et al., 2013).
In order to be effective, the above discussed approaches need the AIS data to have already been processed and that patterns have been extracted. The main contribution of this paper is in the description of a complete pipeline for managing a huge mass of satellite AIS records and for visualizing them in a convenient way. In next section, we present a step-by-step procedure for extracting vessel trajectories from AIS data. An innovative approach with respect to existing web portals, e.g., marinetraffic.com, vesselfinder.com, or shipfinder.co, has been used. It consists of providing positions for vessels around the World, making use of open source and freely available codes only without any legacy piece of software to obtain the AIS trajectory visualization from real data.
50
III. AIS Data Visualization
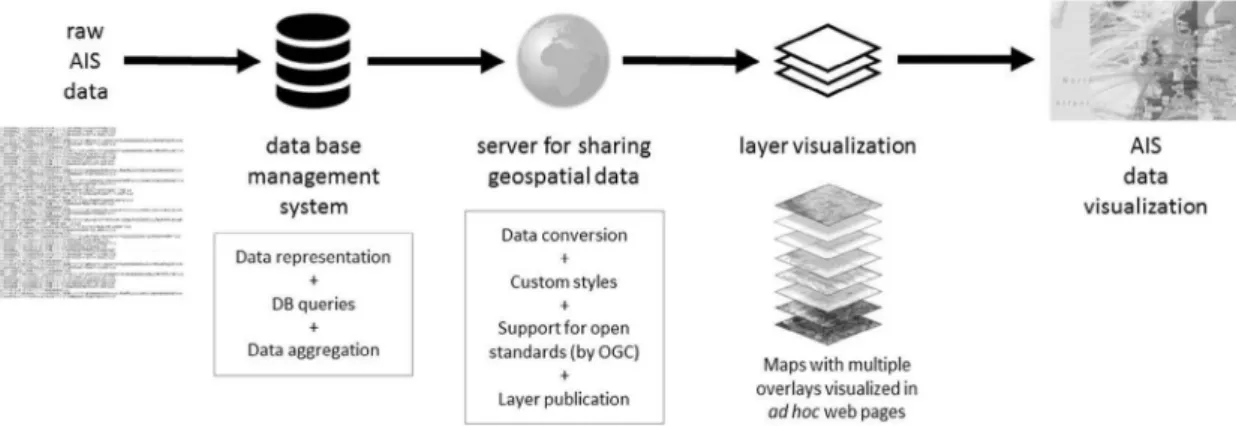
An appropriate AIS data visualization is crucial to obtain a good understanding of the maritime traffic situation for shipping safety. Our aim is to describe a procedure for processing ship routes in order to create a route density map. The main components of the proposed pipeline are shown in Figure 1.
Figure 1: Main components of the visualization pipeline
Starting from raw AIS data, a database management system (DBMS) is used for dealing with the millions of records that are produced by the world wide maritime traffic. The raw AIS records are aggregated by selecting specific fields of the AIS information and by grouping the observations according to those key fields. This aggregation leads to a strong reduction of the total data size. Then, the processed AIS data are sent to a server for generating and managing geospatial data. In particular, the spatial information in the AIS records have to be extracted and formatted to be suitably visualized. The last step consists in overlaying the geo-referenced AIS information over the corresponding geographical maps, in order to obtain the final AIS data visualization view.
In the rest of this section, we describe the main fields in the AIS record that represent the input for the proposed pipeline and the process flow for generating the final interactive visualization.
3.1. AIS Data
The input of the pipeline is a set of raw AIS records (see Figure 1). AIS data contains information about the vessel identity, position, speed, and course with Vessel Traffic Services (VTS) stations as well as with other ships. In particular, depending on a vessel’s speed, AIS transmitters send data every 2 to 10 seconds while underway and every 3 minutes while at anchor (Perez et al., 2009). The main AIS data field are:
x MMSI (Maritime Mobile Service Identity) – a series of nine digits uniquely identifying ship stations;
x Navigation status – “at anchor”, “under way using engine(s)”, or “not under command”; x Rate of turn – right or left, 0 to 720 degrees per minute;
51 x Speed over ground – 0 to 102 knots with 0.1 knot resolution;
x Position accuracy;
x Longitude and Latitude – to 1/10,000 minute;
x Course over ground – relative to true north to 0.1 degree; x True Heading – 0 to 359 degrees from gyro compass;
x Timestamp – Coordinated Universal Time (UTC) time accurate to nearest second when this data was generated.
Moreover, every 6 minutes the AIS transmitter sends additional fields, including:
x IMO (International Maritime Organization) ship identification number – a seven digit number that remains unchanged upon transfer of the ship’s registration to another Country;
x International radio call sign – up to seven characters, assigned to the vessel by its Country of registry;
x Vessel Name – 20 characters to represent the name of the vessel; x Type of ship/cargo;
x Dimensions of ship – to nearest meter;
x Type of positioning system – such as GPS, Differential Global Positioning Systems (DGPS) or Long Range Navigation (LORAN)-C;
x Location of positioning system’s antenna on-board the vessel; x Draught of ship – 0.1 meter to 25.5 meters;
x Destination – max 20 characters;
x Estimated time of arrival (ETA) at destination – UTC date hour: minute.
3.2. Process Flow for the AIS Data Visualization
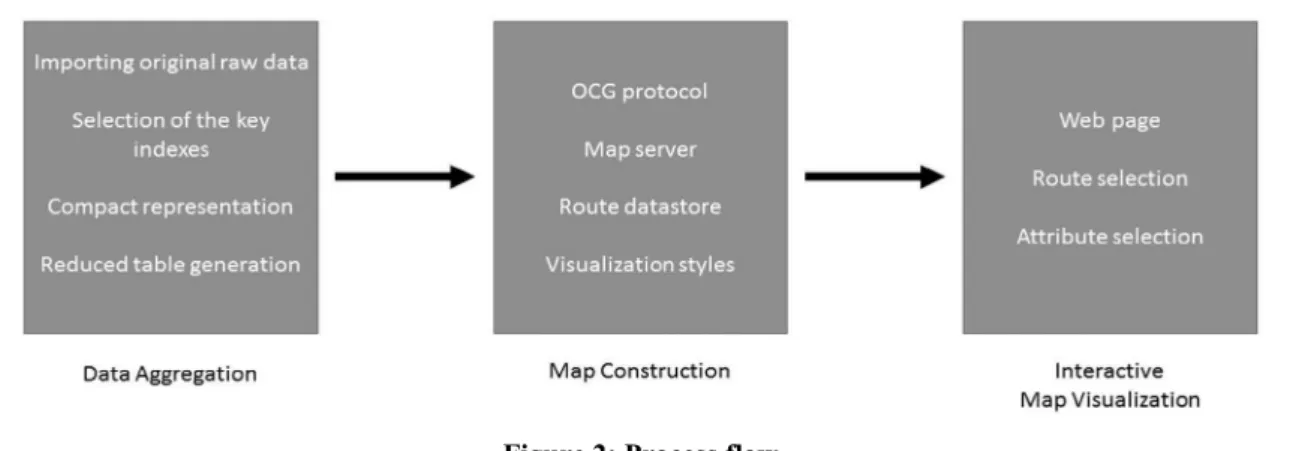
The steps that leads to the generation of an interactive visualization of the AIS data are shown in Figure 2.
52
The process flow contains three main phases: 1. Data aggregation and formatting; 2. Map construction;
3. Interactive map visualization
In the data aggregation phase, the original raw data are first loaded in the DBMS to obtain a database table (original table). As discussed above, the AIS data are generated every 3 to 6 minutes, thus the original table can be huge if the observation period is long. Furthermore, the table contains a number of different fields, usually more than 100, and it is useful to reduce them, since often NULL values are present.
Our strategy is to reduce the original table size by selecting a subset of the available fields and to add an aggregate representation that can drastically reduce the number of records to manage. Indeed, reducing the original table size allows to speed up the queries to the database, since the number of indices strongly affects the speed of the DBMS query engine. In particular, we selected the fields that are essential to derive the vessel identity (i.e., the MMSI and the vessel name) and its position (i.e., the latitude and longitude fields). Furthermore, it is important to take into account timestamp information for sorting the records. Additional fields, like the ship type, can also be considered to validate the data.
Once the fields are selected, we aggregate the data for further reducing the dimension of the database table. The reduction is carried out by grouping the records according to the following spatial proximity criterion:
Each raw AIS record can be seen as a point in the world space and multiple points can be grouped by considering their proximity in terms of latitude and longitude values.
We reason about routes, represented as segments of points that are spatially adjacent, instead of analyzing the punctual position of the vessels. This aggregation allows to strongly reduce the number of records to manage, thus speeding up the queries to the database. The resulting table (reduced table) is sent as input to the server for sharing the geospatial data in a format that can be visualized on a geographical map. We decided to use a format that is compliant with the Open Geospatial Consortium (OCG) standards. OGC is an International not-for-profit organization that is involved in the definition of the specifications for geo-spatial and location-based services. OCG is formed by more than 280 different entities and it aims at develop and implement standards for the content, the exchange, and the services related to geographical data that are open and extensible. OGC specifications are public and freely available. To browse the geospatial data, a convenient representation is given by the use of an interactive web-like page with the possibility of selecting particular routes or attribute (AIS fields) values. The web based representation will be explained in details in the next section, which contains the description of a real case study.
53
IV. Case Study
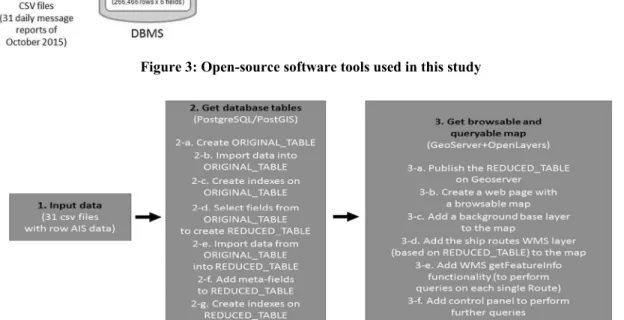
To validate the proposed approach for AIS data visualization and to provide a description of the possible open-source software that can be used to properly visualize AIS data, a large dataset (with more than 90 million rows) of real recorded ship routes has been considered. The dataset is courtesy of exactEarth (www.exactearth.com), which is a leading organisation in the field of global AIS vessel tracking, and contains routes collected over the month of October 2015 all over the World. In particular, the dataset consists of 31 csv files, each one containing the AIS data recorded in every single day of the month. Figure 3 contains the open-source software tools used in this study, namely PostGIS, GeoServer, and OpenLayers, while Figure 4 shows the processing scheme of the proposed AIS data visualization procedure, with all the steps needed.
Figure 3: Open-source software tools used in this study
Figure 4: Processing scheme of the visualization process
4.1. Map Construction
Given the particular kind of analysis required for this study and the complexity of the spatial queries that are needed to visualize the data, we rely on the PostgreSQL database (www.postgresql.org) with the PostGIS extension (postgis.net). Thus, we have created a database (called AIS_DB) enabling the PostGIS extension on it.
Then, we extracted the fields and the data from each csv file in order to import them into our AIS_DB. To this end, we created an initial table having all the fields (139 in total) and containing
54
all the data corresponding to the whole observation month, calling it ORIGINAL_TABLE. We created a bash script accepting as input data the csv file to process and the name of the table to create. This step was executed only on the first csv file, because the header fields, whose names we needed to create the table, were the same in all the other files. The copy utility provided by PostgreSQL has been used to import the ship route data contained in each file into our ORIGINAL_TABLE: This step generates a very large table with 139 columns and 91,324,868 rows, which can affect the usability of the data.
To cope with the huge amount of available data and to perform a more precise analysis, we have applied an intense reduction on the total amount of available AIS records, focusing only on the ship routes of interest. The reduction starts by defining the fields of interest and specializing their data types:
x MMSI – 9 digits uniquely identifying ship stations;
x time – the time (in the form YYYYMMDD_HH24MISS) at which the message was sent;
x millisecond – offset in millisecond within the previous time value, at which the message was sent;
x longitude – the ship’s longitude sent with the message; x latitude – the ship’s latitude sent with the message; x vessel_name – the name of the ship;
x ship_type – a code representing the ship type.
Given the above reported main fields, we can specialize some of their data types. In particular: x MMSI: varchar(9)
x longitude: double precision x latitude: double precision
Then, we add a new column timestamp, in order take into account the timestamp, at which a message was sent, and a new column geom, to represent the geometry type POINT, used to draw the position of the ships at a given timestamp on the map. Finally, indexes on these fields are created to speed up the queries on them.
At this point, the first half of our work is complete: we have (i) a subset of the fields of interest, (ii) specialized data types for those fields, and (iii) index definitions for them that allow us to achieve better performance for our queries.
4.2. Route Extraction and Interactive Map Visualization
The second part of the work addresses the issues of collecting the ship routes and properly visualizing them on a map. As stated before, our aim is to get routes, not points, and therefore to process only messages with longitude and latitude information, thus reducing the amount of rows
55
(after having reduced the number of fields) to the effective number of vessels whose position was registered. Moreover, we also import all the vessel names uniquely associated to a specific MMSI value and add some fields to help the analysis, such as the total number of messages sent by each vessel and the length (in km) of each route. With the above operations, the number of fields of interest can be reduced from 139 to 6 and the amount of rows from 91,324,868 to 216,466, which is the total number of the considered vessels. We call REDUCED_TABLE the result of this reduction.
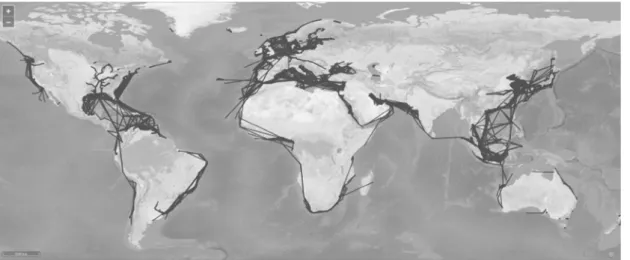
To show the results on a map, we employ GeoServer (geoserver.org) as the instrument of representation of the extracted ship routes, because it easily allows to avoid the International Data Line (IDL) problem, deriving from the routes going through the Date Line. The final goal is to build a complete representation of all the ship routes registered in the report of AIS messages sent on October 2015 (made of 31 csv files). Figure 5 shows the obtained representation. It can be noted that the routes have been registered all over the globe and that it is necessary to find a way to filter the huge amount of information available.
In order to have a more effective and usable instrument, we can build a web-like navigation tool, adding a control panel for performing high-level queries on the visualized data: As an example, it is possible to query for the routes having more than 1000 AIS messages. The control panel has been realized by using the JavaScript framework OpenLayers (openlayers.org).
The web-like navigation tool with its control panel makes it easy to monitor particular routes (more important than others), the ships browsing them, their behaviour, and to compare the movements of some vessels with the ones with similar routes. This possibility is very useful to find anomalies, which could be caused by AIS malfunctions or by illegal activities over the sea.
56
Figure 6: An example of the ship routes obtained filtering by considering the attributes msg_sent and length
Figure 7: At higher zoom levels, the map can be browsed to obtain details about the observed routes
The final result is a fully browsable and queryable (through the use of WMS getFeatureInfo service) map, in which the density level of the traffic for all the types of ships is observable. It is also possible to select particular attributes for filtering the observations (e.g., to consider only passenger ships in a given period).
Figure 6 shows an example where ship routes are filtered according to the values of the two attributes msg_sent and length. This means that only routes longer than a selected value and generated from a number of messages greater than a second defined value are visualized. As can be noted by comparing Figure 5 and Figure 6, the filtering on the attributes msg_sent and length allows to significantly reduce the number of tracks. Figure 7 contains a visualization at high zoom levels of the maritime traffic situation around China. By zooming into the map it is possible to obtain the details of specific routes. This tool is very useful when analyzing particular marine traffic areas. The filtering values in Figure 7 are set to msg_sent > 1000 and length < 2000.
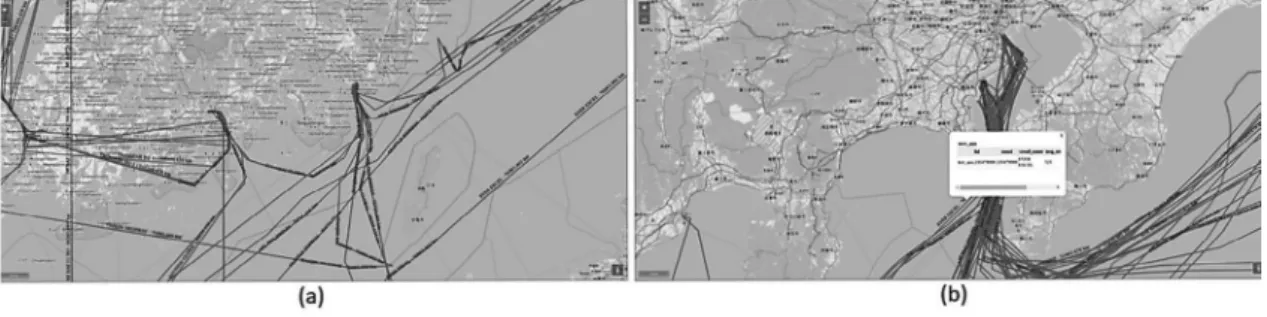
57 Figure 8: AIS message attribute analysis.
(a) A snapshot from Korea. (b) A snapshot from Japan
Figure 8 shows two additional examples of the traffic around Korea (Figure 8a) and Japan (Figure 8b). By clicking on each route it is possible to obtain detailed information about the vessel. In particular, we use the data model shown in Table I. It is worth noting that there are still some discussions in the technical and scientific community at large about the IHO, IMO and IALA on the e-Navigation register, which should incorporate the IHOs Recommendations and therefore be fully compliant with the S100 framework. IHO adopted S-100 as geospatial standard framework for hydrographic and related data. S-100 is aligned with the ISO 19100 series of geographic standards, thereby making the use of hydrographic and other geographic data more interoperable compared to S-57 standard actually globally in use. IMO agreed on the use of the IHO GI Registry as a baseline for the collection, exchange, and distribution of data, thus creating the first step towards the Common Maritime Data Structure (CMDS) essential for e-Navigation. IALA Council has approved the participation of IALA in the IHO GI Registry as a Submitting Organisation and as a domain owner. The authors are participating as active as possible to IALA works and carefully monitoring IALA outputs in order to keep their work up-to-date with the last technology available on market as soon as they are adopted in Operation.
Table 1: Data model for the routes
ATTRIBUTE TYPE MODIFIERS
mmsi character varying(10) not null
vessel_name character varying(255)
msg_sent integer
route geometry(Geometry,4326)
ship_type character varying(5)
length double precision
We experimentally found that, by varying the values for the number of messages sent (i.e., msg_sent) and the distance (i.e., length) traveled by each vessel in the period of interest, it is possible to isolate particular routes and to eventually highlight potential anomalies. The aim of this work is to describe how to build a visual instrument to help in searching distinctive features of anomalous routes and in founding patterns that can be used to perform analysis on longer periods.
58
The images used in this paper, together with additional ones, and the code used to display the raw AIS records can be found at http://www.dis.uniroma1.it/~bloisi/intelligent Surveillance/ msp.html
4.3. Future Directions
The pipeline presented in this paper allows the extraction of aggregated data from raw AIS records. Using worldwide satellite AIS data collected during a period of 1 month we have shown how this extraction can be carried out by means of open source software tools only. An example of analysis of the traffic density during a longer period of time is given by the project ACCSEAS (Billesø, 2015). From 2012 to 2015, the project ACCSEAS allowed to create an e-Navigation testbed at North Sea regional level and to identify key areas of shipping congestion and limitation of access to ports. A notable output of the project is to provide an abstraction Route Topology Model (RTM) based on analysis of the traffic density in the area. The data are collected using a database concerning vessel routes in the North Sea Region and coverage maps of the geographical extent of e-Navigation services in the regulatory framework of the European Union, IMO, and IALA.
As future work, we intend to process vessel positioning reports (e.g. AIS, blue-box fishing vessels position reports etc.) collected over a longer period, in order to focus on the detection of possible anomalies from the outcomes of our pipeline. A possible strategy consists in analyzing the number and the frequency of the positioning report messages sent by the transponder on vessels with similar routes over a year. Indeed, if a vessel presents a long period of silence with respect to the average number of emitted positioning messages sent by vessels navigating in similar conditions, then it is possible to consider it as a possible anomaly. Moreover, we intend to apply machine-learning techniques to predict future positions of vessels underway and verify whether the ships route is in accordance with the Navigational Plane (where available) or to expected route in accordance to the RTM mentioned above (or any other equivalent conceptual model available in the area of interest). Any anomalous behaviours from the predicted and expected route should be automatically alerted to an Operator for further investigations and logged as historical information and subsequently used as input to the next edition of the RTM (or whatever equivalent). These analyses can be further refined by considering the vessel type and other features.
V. Summary and Conclusions
In this paper, we have described a procedure for displaying Automatic Identification System (AIS) data coming from vessels navigating across large geographical areas. The procedure uses raw satellite AIS records as input and produces as output refined views of the input data, which are useful to obtain traffic density information. The proposed visualization scheme can be used as a first stage towards the development of automatic AIS data management systems, allowing to calculate the ‘traffic level’ in specific areas. Moreover, the possibility of selecting single routes by
59
zooming in the map can highlight the presence of illegal actions (e.g., smuggling and unauthorized fishing in protected areas). To this end, a review of recent statistical techniques to be used for recognizing abnormal behaviours has been provided.
Submitted: March 25, 2016 Accepted: October 25, 2016
VI. Acknowledgements
The authors would like to thank ExactEarth (www.exactearth.com) for the AIS data used in this study.
References
IMO (International Maritime Organization)’s website: business.un.org/en/entities/13, last accessed October 2015.
Fiorini, M. and Chang, S. J. (2012), Vessel route analysis by in situ measurements. A prerequisite for Maritime Spatial Planning, In: Proc. 12th International Conference on Intelligent Transport Systems and Telecommunications, ITST2012, pp. 423-427.
Damanaki, M. (2012), Maritime spatial planning: the right answer to secure and support Blue growth for the European Union. In: EU International Conference The case for Maritime Spatial Planning: efficient resource management for sustainable growth, speech 12/224, pp. 1–3.
Fiorini, M. and Lin, J-C (2015), Clean Mobility and Intelligent Transport Systems, IET Transportation Series 1, London 2015, pp. 464.
IMO (International Maritime Organization) Maritime Safety Committee (2009), Strategy for the Development and Implementation of e-navigation, In: IMO/MSC. Report of the Maritime Safety Committee on its Eighty-Fifths Session. MSC85/26. Add. 1, Annex 20.
Bostwick, D., Goldstein, J., Stephenson, T., Stromsten, S., Tierno, J., Torrelli, M. and White, J. (2009). PARSEC, an application of probabilistic case based reasoning to maritime surveillance. In Proceedings of the IEEE Conference on Technologies for Homeland Security. Boston, MA: IEEE Press.
The Nautical Institute’s MSP Forum website: www.nautinst.org/en/forums/msp, last accessed October 2015.
BOEM (Bureau of Ocean Energy Management)’s website:
www.boem.gov/renewable-energy-program/renewable-energy-guide/offshore-wind-energy.aspx, last accessed October 2015.
Martineau, E. and Roy, J. (2011), Maritime Anomaly Detection: Domain Introduction and Review of Selected Literature, Defence R&D Canada – Valcartier Technical Memorandum, DRDC Valcartier TM 2010-460.
Pallotta, G. Vespe, M. and Bryan, K. (2013), Vessel Pattern Knowledge Discovery from AIS Data: A Framework for Anomaly Detection and Route Prediction, Entropy 2013, 15(6), pp. 2218-2245.
Vespe, M., Sciotti, M., Burro, F., Battistello, G. and Sorge, S. (2008), Maritime multi-sensor data association based on geographic and navigational knowledge, In: Proc. of IEEE Radar Conference RADAR 08, pp. 1–6.
Hu, W., Xiao, X., Fu, Z., Xie, D., Tan, T. and Maybank, S. (2006), A system for learning statistical motion patterns, IEEE Trans. Pattern Anal. Mach. Intell., 28, pp. 1450–1464.
60
Bomberger, N.A., Rhodes, B.J., Seibert, M. and Waxman, A.M. (2006), Associative learning of vessel motion patterns for maritime situation awareness, In: Proc. of 9th International Conference on Information Fusion, pp. 1–8.
George, J., Crassidis, J., Singh, T. and Fosbury, A.M. (2011), Anomaly detection using context-aided target tracking. J. Adv. Inf. Fusion 2011, 6, pp. 39–56.
Nevell, D. (2009), Anomaly detection in white shipping, In: Proc. of 2nd IMA Conference on Mathematics in Defence, pp. 1–7.
Lane, R. O., Nevell, D. A., Hayward, S. D. and Beaney, T. W. (2010), Maritime anomaly detection and threat assessment, In: Proc. of 13th International Conference on Information Fusion, pp. 1–8.
ExactEarth, AIS data Sample of vessels over a section of Europe for August 2013 downloaded from http://main.exactearth.com, last accessed October 2015.
Mazzarella, F., Vespe, M., Damalas, D. and Osio, G. (2014), Discovering vessel activities at sea using AIS data: Mapping of fishing footprints, In: Proc. of 17th International Conference on Information Fusion, pp. 1–7.
MMO (2014). Mapping UK Shipping Density and Routes from AIS. A report produced for the Marine Management Organisation, pp. 35. MMO Project No: 1066. ISBN: 978-1-909452-26-8.
Jentoft, S. and Knol, M. (2014), Marine spatial planning: risk or opportunity for fisheries in the North Sea?, Maritime Studies, 12(13), pp. 1–16.
Perez, M., Chang, R., Billings, R., Kosub, T.L. (2009), Automatic Identification System (AIS) data use in marine vessel emission estimation, 18th Annual International Emission Inventory Conference.
Billesø, M. B. (2015), ACCSEAS Final Report, http://www.accseas.eu/content/download/8190/ 74102/ACCSEAS%2520Final%2520Report%2520v1.pdf