F MARKHAM AND N BIDDLE
2016 CENSUS PAPERS
Centre for
Aboriginal Economic
Policy Research
ANU College of
The Centre for Aboriginal Economic Policy Research (CAEPR) undertakes high-quality, independent research to further the social and economic development and empowerment of Indigenous people throughout Australia. For more than 25 years, CAEPR has aimed to combine academic and teaching excellence on Indigenous economic and social development and public policy with realism, objectivity and relevance.
CAEPR maintains a substantial publications program, including Research Monographs, Discussion Papers, Working Papers, Topical Issues and Census Papers.
The 2016 Census Papers document changes to the Aboriginal and Torres Strait Islander population in terms of its size, composition, and a range of social and economic indicators, using data from the 2016 Census. All papers in the 2016 Census Papers series are peer reviewed internally. All CAEPR publications are available in electronic format for free download from CAEPR’s website:
caepr.cass.anu.edu.au
CAEPR is located within the Research School of Social Sciences in the College of Arts & Social Sciences at the Australian National University (ANU). The Centre is funded from a range of sources, including ANU, the Australian Research Council, industry and philanthropic partners, and Australian state and territory governments.
As with all CAEPR publications, the views expressed in this Census Paper are those of the author(s) and do not reflect any official CAEPR position.
Dr RG (Jerry) Schwab Director, CAEPR Research School of Social Sciences College of Arts & Social Sciences The Australian National University November 2017
2016 Census Paper No. 1 ISBN 978-1-925286-22-9
An electronic publication downloaded from <caepr.cass.anu.edu.au>. For a complete list of CAEPR 2016 Census Papers, see
<caepr.cass.anu.edu.au/research/ publications/2016-census-papers>. Centre for Aboriginal Economic Policy Research
Research School of Social Sciences College of Arts & Social Sciences The Australian National University Front cover image:
Terry Ngamandarra Wilson, Gulach (detail), painting on bark, private collection © Terry Ngamandarra, licensed by Viscopy, 2016
INDIGENOUS POPULATION
CHANGE IN THE
2016 CENSUS
F Markham and N Biddle
Francis Markham is a Research Fellow at the Centre for Aboriginal Economic Policy Research, Research School of Social Sciences, College of Arts & Social Sciences, Australian National University. Nicholas Biddle is a Senior Fellow at CAEPR, and Deputy Director of the ANU Centre for Social Research and Methods.
Abstract
The aim of this paper is to provide an overview of the changing size and spatial distribution of the Indigenous population of Australia, comparing the results of the 2011 and 2016 censuses. The paper summarises five key aspects of the intercensal change:
• the growth in the estimated population of Indigenous Australians • the changing geographic distribution of Aboriginal and Torres Strait
Islander people
• the growth in the number of census records with indeterminate Indigenous status
• the spatial mismatch between demographic projections from the 2011 Census and 2016 Census counts
• the potential for identification change to confound changes in socioeconomic outcomes.
We show that the Indigenous population grew rapidly between 2011 and 2016, reaching around 3.3% of the total population estimate, or 798 381 people. This was most likely due to a combination of natural increase and changing patterns of identification. Both aspects of growth were concentrated in more urban parts of the country, especially coastal New South Wales and southeast Queensland. We suggest that care needs to be taken when interpreting Indigenous population change between 2011 and 2016, because of both unexplained population growth and a substantial increase in the number of census records with no answer to the Indigenous status question. In particular, we suggest that identification change may lead to an apparent convergence in the outcomes between the observed Indigenous and observed non-Indigenous populations through time, without there necessarily being any improvement in the life circumstances of individual Indigenous Australians.
Keywords: Indigenous demography, Indigenous geography, identification change, census methodology
Acknowledgments
Funding for this project was provided by the Australian Government Department of the Prime Minister and Cabinet. While this funding was greatly appreciated, all findings and conclusions should be attributed to the authors only.
Acronyms
ABS Australian Bureau of Statistics
ACLD Australian Census Longitudinal Dataset ANU The Australian National University
CAEPR Centre for Aboriginal Economic Policy Research PES Post-Enumeration Survey
Tables and figures
Fig. 1.
The Indigenous origin question in the 2016 Census of Population
and Housing
2
Table 1.
Census count and population estimates of Aboriginal and Torres Strait
Islander Australians, 1901–2016
3
Fig. 2.
Aboriginal and Torres Strait Islander population estimates compared with
demographic population projections based on the previous census, 2016–1996
4
Fig. 3.
Aboriginal and Torres Strait Islander census count by state and territory,
1971–2016 5
Fig. 4.
Change in the number of Indigenous people counted in the census by
Indigenous Region, 2011–16
6
Fig. 5.
Percentage change in the number of Indigenous people counted in the
census by Indigenous Region, 2011–16
7
Table 2.
Indigenous and non-Indigenous population count distributions by
geographical remoteness, 2016
8
Contents
Abstract iii
Acknowledgments iv
Acronyms iv
Introduction: Quantifying the Indigenous population
1
Count and undercount
2
Changing geographic distribution of Aboriginal and Torres Strait
Islander persons
4
States and territories
4
Regional patterns of growth
5
Growth in people with Indigenous status ‘not stated’
8
Type and prevalence of nonresponse
8
Characteristics of nonrespondents in private dwellings
9
People with a partially completed census form
10
Imputed households
11
Exploring the unexplained population growth
12
Geography of unexplained population growth
12
Identification change and socioeconomic outcomes
17
Concluding comments
19
Notes 20
References 20
Fig. 6.
Nonresponse to the Indigenous origin question in the 2006, 2011 and 2016
Censuses by nonresponse type
9
Table 3.
Age–sex profile and imputed age–sex profile of records that did
not have a valid response recorded for the Indigenous origin question i
n the 2016 Census and who lived in, or were imputed to live in, a private dwelling 10
Table 4.
Responses to selected census questions among those who
returned a census form, by nonresponse and response to the Indigenous
origin question, 2016
13
Table 5.
Percentage of unit nonresponse in private dwellings, by SA1
characteristics, 2016
14
Fig. 7.
Unexpected population change by Indigenous region, 2011–16
15
Table 6.
Provisional estimates of the 2016 Indigenous population of
regions based on the 2016 Census, compared with projections of the
2016 Indigenous population based on the 2011 Census and natural increase
16
Fig. 8.
Change in the percentage of the population with both parents born in
Australia for Indigenous and non-Indigenous Australians, by age in 2016
18
Fig. 9.
Change in the percentage of the population that left high school
Introduction: Quantifying the
Indigenous population
K
nowledge of the size and composition of the Indigenous population is a matter of much concern to policy makers and Indigenous people. The size and nature of the Indigenous population in Australia was estimated first by colonial authorities from the mid-1850s, and then, post-Federation, by the Australian Government (Rowse 2006). One primary imperative for counting the Indigenous people in federated Australia was the implementation of the nation’s discriminatory constitution. The constitution, effective at the time of the first national census (1911), necessitated that Indigenous persons be excluded from official population estimates produced for constitutional purposes, such as the allocation of the members of the House of Representatives to electoral divisions defined on the basis of population, and the distribution of customs duties to the states (Chesterman & Galligan 1997, Arcioni 2012). In practice, this meant that all people who were reached by census collectors were asked to complete a census form, including a question on ‘race’ that included their ‘proportion’ of Aboriginal heritage. Those who stated that they were ‘more than half’ Aboriginal were excluded from most published population statistics (ABS 2011).Although this discriminatory clause was removed from the constitution by the 1967 referendum, Indigenous people have continued to be identified in the census for very different reasons. Whereas the 1966 Census – the last before the 1967 referendum – enumerated Indigenous persons for reasons of exclusion, the inclusion of a question about the ‘racial origin’ of census respondents in the 1971 Census was justified on the basis of the state’s obligation to improve the material conditions of Aboriginal and Torres Strait Islander people (Rowse 2006). The contemporary Aboriginal and Torres Strait Islander origin question was first asked in the 1981 Census, with the 1976 Census being the last to ask about indigeneity using the language of race. The 1981
Census, and all subsequent censuses, have asked of those enumerated, ‘Is the person of Aboriginal or Torres Strait Islander origin?’ (See Fig. 1.) The 1996 Census and those following have retained the same question wording but given people the choice to identify as being of both Aboriginal and Torres Strait Islander origin, rather than forcing a mutually exclusive choice between the two origins (Biddle et al. 2015). Answers to the current Indigenous origin question on the census have been used to inform government policy (e.g. the ‘Closing the Gap’ targets), service delivery (e.g. the National Partnership Agreement on Remote Service Delivery), resource allocation (e.g. the state-based redistribution of revenue from the goods and services tax) and advocacy for social justice (e.g. Calma 2006).
As the foregoing discussion suggests, the definition of the ‘Indigenous population’ is a contentious one, and the questions in the census have arguably never met the needs of that population itself. Indeed, the notion of an ‘Indigenous population’ is a colonial construction. As Michael Dodson notes, ‘colonising cultures have had a pre-occupation with observing, analysing, studying, classifying and labelling “Aborigines” and Aboriginality. Under that gaze Aboriginality changed from being a daily practice to being “a problem to be solved”’ (Dodson 2003). However, Walter and Andersen (2013) insist that recognition of colonial categories need not entail the abandonment of the collection of statistics about Indigenous peoples. Rather, they argue for the reframing of statistical collections and their interpretations in a manner that reflects Indigenous standpoints. Given that the 2014–15 National Aboriginal and Torres Strait Islander Social Survey found that 58% of those who identify as Indigenous also identify with ‘a tribal group, language group, clan, mission or regional group’, there remain good reasons to consider expanding the number of census measures related to the Indigenous population (cf. Kukutai & Taylor 2016).
FIG . 1.
The Indigenous origin question in the 2016 Census of Population and Housing
Nevertheless, the census continues to ask Australian residents about their Indigenous origin and is likely to do so for the foreseeable future. Tabulations and estimates derived from the census provide the best information that is available on the size and composition of the Indigenous population of Australia, albeit imperfectly. Consequently, a detailed understanding of the change since 2011 is of value to policy makers, service providers and Indigenous people.
This Census Paper, the first in a forthcoming series, provides an overview and analysis of elements of the change in the population of Indigenous people between 2011 and 2016. After this introduction, the second section of the paper focuses on describing the population increase and placing it in historical context. The section that follows illustrates the geographically uneven distribution of the changing Indigenous population count. The fourth section examines the increase in the proportion of census records for which no valid response was recorded on the Indigenous origin questions. The final section evaluates the spatial distribution of ‘unexplained’ growth in the Indigenous population, and its consequences for the measurement of socioeconomic outcomes.
Count and undercount
Perhaps the single most remarked-upon result from the census is the population count. In the 2016 Census, 590 056 people were counted as Aboriginal, 32 345 were counted as Torres Strait Islander, and 26 767 were counted as both Aboriginal and Torres Strait Islander. Combined, 649 168 people were counted as Indigenous, an increase of more than 100 000 people, or 18.4%, since 2011. This count of the Indigenous population compares with 21 341 231 people who identified as not being of Aboriginal or Torres Strait Islander origin, resulting in the Indigenous population making up 3.0% of those who answered the Indigenous origin census question, an increase from 2.7% in 2011.
The census count underestimates the number of Aboriginal and Torres Strait Islander people to a much greater degree than it underestimates the number of other Australians. The Australian Bureau of Statistics’ (ABS) Post-Enumeration Survey (PES), which re-interviews around 0.5% of Australian households, is used as the basis for producing population estimates (as distinct from population counts tabulated from the census). The PES is national, and in 2016 sampled
around 800 households from 33 discrete Indigenous communities. The Indigenous population estimate attempts to correct for at least three types of census undercount (ABS 2017a). First, a significant proportion of census records do not have a response to the Indigenous status question (6.0% in 2016). Some of these individuals are likely to be of Aboriginal and Torres Strait Islander origin. Records with Indigenous status not stated come about either because that particular question was skipped over on the census form or because no census form was received for a dwelling that census collectors deemed to be occupied on census night. In the latter case, census collectors impute the existence of a certain number of residents, but do not answer the Indigenous status question for these individuals. Second, some individuals are missed by the census – they simply do not appear on any household’s census form. This could be because they were omitted from a completed census form, because census collectors missed their dwelling, or because census collectors mistakenly thought their dwelling was unoccupied. Third, a number of individuals who are listed as not being of Aboriginal or Torres Strait Islander origin on the census form later state that they are of Aboriginal or Torres Strait Islander origin when asked in the PES several weeks later, a survey that is administered face to face to most participants. After the PES is
released, the ABS further adjusts the population estimate, by backdating the census-night estimate to 30 June and by estimating the number of residents temporarily overseas and thus out of scope for the PES (ABS 2017b). Based on these adjustments, the ABS (2017b) estimates that there were 798 381 Aboriginal or Torres Strait Islander Australians in August 2016. This population estimate is an increase of 128 000 people from 2011, or 3.5% per year. Such population increase is not unusual for the Australian Indigenous population. As Table 1 shows, both the census count and the population estimate of Aboriginal and Torres Strait Islander people have increased considerably in almost every census since the 1967 referendum. While the annualised growth in the Aboriginal and Torres Strait Islander population between 2011 and 2016 of 3.5% is substantial, it is less than the mean annual growth from 1971 to 2011 of 4.1%. The Indigenous census count – that is, the number of people identified as being of Aboriginal or Torres Strait origin in the census itself, without adjustment for undercount – has also increased substantially, rising from 548 370 in 2011 to 649 171 in 2016. This is consistent with historical trends since the 1967 referendum, with the Indigenous census count increasing in every census during that period, with the exception of the 1981 Census (Table 1).
The proportion of the Australian population identified as Indigenous has also increased rapidly since 1971. While only 0.9% of the total population count identified as being of Aboriginal or Torres Strait Islander origin in the 1971 Census, that figure rose to 2.8% of the count in 2016 (or 3.0% after excluding census records with no Indigenous status recorded). After adjusting for undercount, the best estimate is that Indigenous people comprise 3.3% of the Australian population, an increase from 3.0% of the population estimated in 2011 and 1.4% in 1986.
Of note is the continued trend towards increasing undercount of the Indigenous population in the census (Table 1). The undercount presented here is defined as the difference between the population estimate and the census count, expressed as a percentage of the population estimate. The 2016 final undercount of 17.5% is up only slightly from 17.2% in 2011. Nevertheless, this is the highest level of Indigenous undercount recorded in the post-1967 referendum era. Part of this increase is likely to have come from an improved methodology in estimating the undercount. In other words, previous estimates may have underestimated the extent of the
TABLE 1.
Census count and population estimates of Aboriginal and Torres Strait Islander Australians,
1901–2016
Year
Census count Population estimate
Undercount (%)d Indigenous
persons
Percentage of total counta,b
Annual growth rate (%) Indigenous personsc Percentage of total populationb Annual growth rate (%) 2016 649 171 2.8 3.4 786 689 3.3 3.5 17.5 2011 548 370 2.5 3.8 662 335 3.0 5.2 17.2 2006 455 030 2.3 2.1 513 977 2.5 2.2 11.5 2001 410 003 2.2 3.0 460 140 2.4 4.3 10.9 1996 352 970 2.0 5.9 372 052 2.0 5.6 5.1 1991 265 489 1.5 3.1 283 631 1.6 3.4 6.4 1986 227 645 1.4 7.3 240 152 1.4 – 5.2 1981 159 897 1.1 –0.1 – – – – 1976 160 915 1.1 6.8 – – – – 1971 115 953 0.9 7.5 150 076 1.1 2.6 22.7 1966 80 750e 0.7 0.1 132 219 1.1 2.4 38.9 1961 80 526 0.8 3.8 117 495 1.1 2.3 31.5 1954 62 084 0.7 2.8 100 048 1.1 2.0 37.9 1947 51 048 0.7 0.9 87 000 1.1 1.2 41.3 1933 45 066 0.7 1.1 73 828 1.1 –0.2 39.0 1921 39 399 0.7 2.7 75 604 1.4 –1.0 47.9 1911 30 052 0.7 –4.6 83 588 1.8 –1.2 64.0 1901 48 248 1.3 – 94 564 2.4 – 49.0 – = not available
a The denominator for this percentage includes those who did not state their Indigenous status in the census.
b Census counts and population estimates from 1901 to 1966 are for what the Australian Bureau of Statistics (ABS) termed ‘full blood Aborigines’, who were counted in the census to be excluded from population statistics. Because of this exclusion, denominators for these percentages have been counted by adding the Indigenous census counts and population estimates to the official non-Indigenous figures. Persons identified in the pre-referendum censuses as ‘half-caste’ were counted as non-Indigenous in these censuses and population estimates.
c This column uses Post-Enumeration Survey (PES) population estimates where possible (i.e. excluding those residents temporarily absent from Australia on census night) to consistently calculate the undercount rate.
d These undercount rates are calculated consistently using the method from the 2016 PES, and so do not match the published undercount rates from previous years.
e Excludes Torres Strait Islanders.
Notes: All PES-derived population estimates displayed above are based on the census of that year. To the best of the authors’ knowledge, the ABS did not produce estimates of the Indigenous population for censuses between 1966 and 1981. The 1996 PES-derived estimate is based on the estimated population at 30 June, while all other listed figures related to the population on census night in early August.
Sources: Population estimates for 1901–61 from ABS (1986, 2014), for 1986 and 1991 from ABS (1994), for 1996 from ABS (1996) and for 2001–16 from ABS (2017a). Census counts for 1911 from CBCS (1917), for 1921 from CBCS (1927), for 1933 from CBCS (1940), for 1947 from CBCS (1952), for 1954 from CBCS (1962), for 1961 from CBCS (1967), for 1966 from CBCS (1971), for 1901–66 from ABS (2014), for 1971–91 from ABS (2004) and for 1996–2016 from ABS community profiles (www.abs.gov.au/websitedbs/censushome.nsf/home/communityprofiles)
undercount. However, further research is needed to determine the cause of the elevated undercount, because such an understanding may suggest improvements that might be made to future enumeration methods.
The 3.5% annual growth of the Indigenous population between 2011 and 2016 outstripped demographic projections of population growth based on the 2011 Census by a considerable degree. As Fig. 2 shows, around 42 000 more Indigenous people were identified to be resident in Australia in 2016 than the ABS had predicted in projections based on the 2011 Census. In this chart, the black line represents the best estimate of the Indigenous population based on the census of that year, whereas the shaded region indicates the range of population estimates for that year produced by the ABS based on the immediately previous census. The ‘unexplained growth’ in the Indigenous population is illustrated by the gap between the black line and the shaded region on the chart.
Unexplained growth accounted for around 34% of intercensal population growth between 2011 and 2016. This unexplained growth is likely to result from the changing propensity of people to identify as Indigenous in the census and the PES, and from changes to the methods used to collect data for the census and the PES. Fig. 2 also demonstrates that the gap between the
Indigenous population estimates and projections based on the previous census has narrowed compared with growth in the Indigenous population between 2006 and 2011, during which period around 59% of growth was unexplained.
Changing geographic distribution
of Aboriginal and Torres
Strait Islander persons
States and territories
While the number of people counted in the censuses as being of Aboriginal and Torres Strait Islander origin increased by 100 801 between 2011 and 2016, this growth was not evenly distributed across the country. Three important patterns appear when growth in the Indigenous population count is examined by states and territories (Fig. 3). First, growth in the Indigenous population count continues to be fastest in New South Wales (an increase of 43 551 people) and Queensland (an increase of 30 656 people), continuing the long-term trend whereby the Indigenous population is increasingly concentrated in these two states (up from 48.1% of the Indigenous population in 1971 to 62.0% in 2016) (Biddle 2012). Second, the Northern Territory continues its unique long-term trend of decelerating population growth,
FIG . 2 .
Aboriginal and Torres Strait Islander population estimates compared with demographic
population projections based on the previous census, 1996–2016
300 000 400 000 500 000 600 000 700 000 800 000 1996 2001 2006 2011 2016 Indigenous people
Projection range based on previous census,
excluding identification change Population estimate based oncensus of that year
Note: The upper bounds of the projections for 2001 and 2006 have been modified to remove predicted unexplained population growth.
with the Indigenous population count increasing by just 0.5% per year (1469 people between 2011 and 2016). All other jurisdictions had an annualised growth rate in the Indigenous population count of between 1.8% and 4.7%. Perhaps more importantly, the Northern Territory retains a uniquely high proportion of the Indigenous population, at 28.3% in 2016 – much higher than the next closest states: Tasmania (4.9%) and Queensland (4.2%). However, the non-Indigenous population of the Northern Territory continues to grow more rapidly than the Indigenous population (1.4% per year). Third, the Indigenous populations of the remaining five states and territories all continue to grow rapidly, but contribute a relatively small proportion of population increase because of the relatively modest size of their Indigenous populations. The annual growth rates of the Indigenous population in Victoria (4.7%), South Australia (2.4%), Western Australia (1.8%), Tasmania (3.7%) and the Australian Capital Territory (4.7%) were not dissimilar to the growth rates of the Indigenous population in New South Wales (4.6%) and Queensland (3.7%). What sets New South Wales and Queensland apart is the combination of both large Indigenous populations and high growth rates.
Regional patterns of growth
Within states and territories, there are distinct patterns of growth in the Indigenous census count. When examined at the regional level, it is clear that growth in the Indigenous census count is concentrated in the most heavily populated parts of New South Wales and Queensland. As Fig. 4 shows, counts increased the most in the Brisbane (17 463 people), New South Wales Central and North Coast (17 452 people), and Sydney– Wollongong (13 852 people) Indigenous regions. These regions accounted for almost half of the recorded gross Indigenous population growth (47.9%). At the other end of the spectrum, several regions experienced a decline in the number of people counted as being of Aboriginal and Torres Strait Islander origin in the 2016 Census. Declining census counts were of a much smaller magnitude than population growth, with Kununurra (745 people) and Alice Springs (359 people) experiencing the largest falls in the number of Indigenous people counted in the census.
FIG . 3 .
Aboriginal and Torres Strait Islander census count by state and territory, 1971–2016
0 50 000 100 000 150 000 200 000 250 000 Aboriginal and Torres Strait Islander people 1970 1976 1981 1986 1991 1996 2001 2006 2011 2016 NSW Vic Qld SA WA Tas NT ACT
A similar geographic pattern of growth is apparent when Indigenous population change is mapped in terms of percentage growth rather than absolute growth. As Fig. 5 shows, percentage population growth was high across much of southeastern Australia, with the Indigenous populations of Victoria, Tasmania, the Australian Capital Territory, southern and eastern New South Wales, and southeast Queensland all growing by more than 20% between 2011 and 2016. The fastest growing regions were the New South Wales Central and North Coast (33.4%), Brisbane (32.8%) and Melbourne (34.5%), whereas population decline was most rapid in Kununurra (13.5%) and Alice Springs (7.2%).
While these results might be interpreted as suggesting that the distribution of the Indigenous population is becoming more similar to that of the non-Indigenous population, the census figures do not tell a simple story of converging geographic distributions. Clearly, the less urbanised Indigenous population continues the long-term trend of becoming increasingly likely to live in cities. As Table 2 shows, 36.8% of the Indigenous population lived in what the ABS terms ‘major cities’ in 2016, an increase of 2.6% from 34.2% in 2011, using a consistent geographic classification. This increase consists of a combination of natural increase, migration and identification change. However, during this same period,
FIG . 4 .
Change in the number of Indigenous people counted in the census by Indigenous region,
2011–16
–745 to 0Number of people
1 to 1000 1001 to 4000 4001 to 17 500 Broome West Kimberley Nhulunbuy Torres Strait Cape York Cairns– Atherton Townsville –Mackay Rockhampton Brisbane NE NSW NW NSW Tas Adelaide Port Augusta Apatula Alice Springs South Hedland Kalgoorlie Perth SW WA Sydney– Wollongong SE NSWVic excl Melbourne
Riverina– Orange Jabiru –Tiwi Toowoomba– Roma Katherine Tennant Creek Port Lincoln –Ceduna Kununurra Darwin Geraldton Melbourne ACT NSW Central & North Coast Mount Isa
the non-Indigenous population also became increasingly urbanised, with 72.3% of non-Indigenous Australian’s resident in major cities in 2016, an increase of 1.3% from 71.0% in 2011. However, the starkest divergence in population dynamics lies in ‘inner regional’ areas, where 24.1% of Indigenous people and 18.1% of non-Indigenous people now live. While the proportion of the Indigenous population living in inner regional areas continues to grow (up 1.7% from 2011), the proportion of the non-Indigenous population living in these locations fell by 0.5% between 2011 and 2016.
Another difference between the two populations is that much of the growth of non-Indigenous Australians in urban areas is likely to be driven by international immigration. For the Indigenous population, migration is negligible, with the small percentage of Indigenous Australians who move overseas mostly balanced by the small percentage who return. Growth in urban areas is therefore likely to be made up of a combination of excess of births over deaths, changing patterns of identification and internal migration. We will explore these patterns in detail when migration data from the 2016 Census become available.
FIG . 5 .
Percentage change in the number of Indigenous people counted in the census by Indigenous
region, 2011–16
Darwin ACT Melbourne Adelaide Perth –15% to 0% % growth 0% to 10% 10% to 20% 20% to 33% Broome West Kimberley Torres Strait Cape York Cairns– Atherton Townsville –Mackay Rockhampton Brisbane NE NSW NW NSW Tas Adelaide Port Augusta Apatula Alice Springs South Hedland Kalgoorlie Perth SW WA Sydney– Wollongong SE NSWVic excl Melbourne
Riverina– Orange Jabiru –Tiwi Toowoomba– Roma Katherine Tennant Creek Port Lincoln –Ceduna Kununurra Darwin Geraldton Melbourne ACT NSW Central & North Coast Mount Isa Nhulunbuy
Growth in people with Indigenous
status ‘not stated’
Type and prevalence of nonresponse
Given the well-publicised concerns about the quality of the 2016 Census (Harding et al. 2017), the growth in the number of census records with no valid response to the Indigenous status question is worthy of further attention. The number of records with Indigenous status not stated grew from 1 058 585 in 2011 (4.9% of people) to 1 411 492 in 2016 (6.0% of people), an increase of 33.3%. This is potentially concerning, because the number of census records with no answer for the Indigenous origin question is more than double the number of people who identified as Aboriginal and/or Torres Strait Islander. This quantity of missing data could be a problem if the increased propensity for the Indigenous origin question to be unanswered is correlated with other variables. If, for example, those who live in remote areas are more likely to constitute the population who left the Indigenous origin question unanswered for the first time, this might bias the results of other analyses. In this context, the predictors of the increase in the number of census records with no valid answer to the Indigenous origin question is of particular interest. While the quality assurance report commissioned by the ABS considered this matter, it did not do so in great detail for the Indigenous population specifically (Harding et al. 2017).
There are three broad categories of census records for which Indigenous status is not stated. The first category, which we term ‘partial form completion’, occurs when people return a partially completed census form to the ABS and leave the Indigenous origin question unanswered. In the 2016 Census, responses to the Indigenous origin question for which both the ‘No’ and a
‘Yes’ response were recorded were also coded as ‘not stated’, a change from the 2011 Census in which they were coded as non-Indigenous. The second category, which we term ‘household imputation’, occurs when whole households are missing from the census. This occurs when no census form is returned from a dwelling that census collectors deem to have been occupied on census night. In this case, the number of people living in the dwelling is imputed by the ABS. The third category, ‘individual imputation’ is similar to household imputation but occurs when individuals fail to appear on any census form and are imputed into the census by the ABS. This occurs in nonprivate dwellings (i.e. shared accommodation such as hotels, hospitals, prisons and other communal dwellings), when individuals who are listed as being present on census night fail to complete an individual census form. In household and individual imputation, the age, sex, marital status and place of usual residence are imputed for missing persons, but Indigenous status is not imputed. In 2016, partial form completion accounted for 223 165 census records (1.0%), household imputation for 1 005 727 census records (4.3%) and individual imputation for 182 606 census records (0.8%).
Examination of the number of census records in each nonresponse category for the Indigenous origin census question in the 2006, 2011 and 2016 censuses (see Fig. 6) reveals four key findings.1 First, the single largest
category of census records having no response for Indigenous status arises from household imputation – that is, by the imputation of persons into private dwellings deemed by census collectors to be occupied on census night and that did not return a census form. This category of nonresponse increased by 47.5% between 2011 and 2016 – a very substantial increase. Second, individual imputation has been growing consistently since 2006,
TABLE 2 .
Indigenous and non-Indigenous population count distributions by geographical
remoteness, 2016
Remoteness Indigenous population count Percentage of Indigenous count Change in percentage of Indigenous count, 2011–16 Non-Indigenous population count Percentage of non-Indigenous count Change in percentage of non-Indigenous count, 2011–16 Major cities 235 527 36.8 2.6 15 409 691 72.3 1.3 Inner regional 154 087 24.1 1.7 3 858 090 18.1 −0.5 Outer regional 130 976 20.5 −1.5 1 738 227 8.2 −0.6 Remote 40 689 6.4 −1.0 224 485 1.1 −0.1 Very remote 79 041 12.3 −1.9 90 897 0.4 −0.1Note: Not stated population excluded. Calculated on the basis of 2011 remoteness boundaries, using an area-based 2016 to 2011 Statistical Area 1–level concordance.
although at a slower rate and from a smaller base. In short, a growing number of people are being considered to have failed to return census forms, whether in private or nonprivate dwellings. This affects the census results across all questions, not just the Indigenous origin question. Third, partial form completion has consistently fallen since 2006, meaning that those who do return a census form are increasingly likely to complete the Indigenous origin question. This may be due in part to the increase in the number of forms completed online, for which it is much more difficult to leave individual questions unanswered. Fourth, the number of imputed records (1 188 333) is substantially greater than the number of records in which people identify as being of Aboriginal or Torres Strait Islander origin (649 168), suggesting that it is possible that changes to this category of people might be of sufficient magnitude to bias results for Indigenous people. Certainly, the characteristics of the population of people who fail to answer the Indigenous origin question is worthy of further investigation.
Characteristics of nonrespondents
in private dwellings
The overall growth in the number of census records with no valid response to the Indigenous origin question makes understanding the composition of those who are not represented in the census results important. While all forms of nonresponse are important, household imputation is perhaps the most noteworthy because it
contributes the majority of nonrespondents. It is also the type of nonresponse that increased most rapidly between 2011 and 2016.
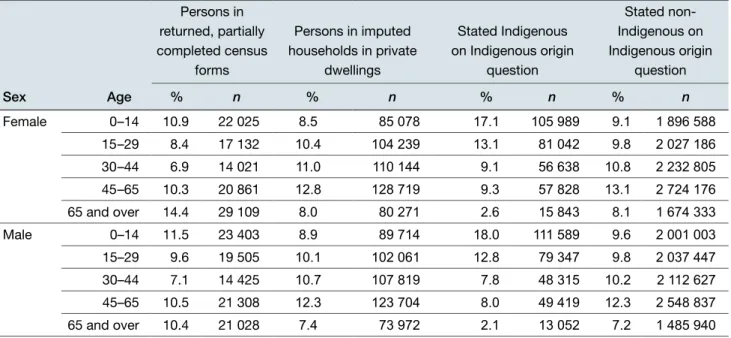
Table 3 presents what we know about the age–sex composition of those who did not complete the
Indigenous origin question, and compares it with that of those who did complete the question. Nonresponse is broken down by partial form completion and household imputation. In the case of item nonresponse, where respondents mostly did complete the age–sex questions themselves, the age–sex profile of nonrespondents is somewhere between that of Indigenous and non-Indigenous Australians. However, it is generally much closer to the non-Indigenous population distribution. This is consistent with unweighted data from the ABS (2017a), which suggest that, among the 223 000 people who partially completed a census form but did not answer the Indigenous origin question, 5.3% identify as Indigenous when asked in an interview. In the case of households who did not return a census form but whose members were imputed by the ABS, the imputed age– sex distribution is older even than the non-Indigenous population. This result should be treated with caution, however, as it is the outcome of the imputation process rather than answers to the survey itself.
In summary, the age–sex profile of item nonrespondents is somewhere between Indigenous and non-Indigenous Australians, whereas the imputed age–sex profile of imputed households looks like a more extreme version
FIG . 6 .
Nonresponse to the Indigenous origin question in the 2006, 2011 and 2016 censuses by
nonresponse type
0 200 000 400 000 600 000 800 000 1 000 000 1 200 000Identified as Aborignal and/or Torres Strait Islander on census form Partially completed census form
Records created by household imputation Records created by individual imputation
Number of persons or imputed persons
of the non-Indigenous population profile. This implies that the partial form–completing population occupies a distinctive place in the age–sex structure, close to the non-Indigenous population but with fewer people aged 30–65. In contrast, imputed people tend to underrepresent children aged 0–14 and overrepresent those aged 15–44.
People with a partially completed census form
We can learn more about people who returned partially completed census forms by examining their responses in the remainder of the census form (Table 4). People who were the ‘primary reference person’ for the census form were only slightly more likely to complete the Indigenous origin question (90.1%) than nonreference people (90.0%). The primary reference person is generally the first person listed on a census form, and may complete the form on behalf of other household members. We might expect to see a substantially lower rate of completion of the Indigenous origin question among those who were not the primary reference person if they were not confident in identifying the Indigenous origin of household members. However, this appears not to be the case.In general, those who were widowed (1.6% did not state their Indigenous status), poorer (0.9%) and less well educated (1.1%) were less likely to answer the Indigenous origin question than average. In addition, those who speak English at home (0.8% did not state their Indigenous status), those who did not provide unpaid care or assistance (0.8%) and those who were at home
on census night (1.4%) were also less likely to answer the Indigenous origin question.
Mutual patterns of nonresponse appear for the Indigenous origin question, and the age and sex questions. Only 0.9% of those who answered the age and sex questions, did not complete the Indigenous origin question. However, 12.9% of those who failed to answer the sex question and 20.2% of those who failed to answer the age question also did not answer the Indigenous origin question. This is part of a consistent but unsurprising pattern evident in Table 4 whereby those who did not answer other census questions were also unlikely to answer the Indigenous origin question. This is especially clear in the case of legal marital status, where more than one-third of people who did not state their marital status also did not state their Indigenous status. What is not evident in Table 4 is a clear question ‘exhaustion effect’, whereby people are less likely to answer questions towards the back of the census form. However, an exhaustion effect exists regardless of the answer to the Indigenous origin question. The nonresponse rate for the first census question on sex was 1.1% for people who identified as Indigenous, 0.5% for people who identified as non-Indigenous and 8.7% for people who did not answer the Indigenous origin question. In contrast, the nonresponse rate for one of the last questions on the form about providing unpaid care and assistance was 7.6% for Indigenous respondents, 3.0% for non-Indigenous respondents and 29.6%
TABLE 3 .
Age–sex profile and imputed age–sex profile of records that did not have a valid response
recorded for the Indigenous origin question in the 2016 Census and who lived in, or were imputed to
live in, a private dwelling
Sex Age Persons in returned, partially completed census forms Persons in imputed households in private dwellings Stated Indigenous on Indigenous origin question Stated non-Indigenous on Indigenous origin question % n % n % n % n Female 0–14 10.9 22 025 8.5 85 078 17.1 105 989 9.1 1 896 588 15–29 8.4 17 132 10.4 104 239 13.1 81 042 9.8 2 027 186 30–44 6.9 14 021 11.0 110 144 9.1 56 638 10.8 2 232 805 45–65 10.3 20 861 12.8 128 719 9.3 57 828 13.1 2 724 176 65 and over 14.4 29 109 8.0 80 271 2.6 15 843 8.1 1 674 333 Male 0–14 11.5 23 403 8.9 89 714 18.0 111 589 9.6 2 001 003 15–29 9.6 19 505 10.1 102 061 12.8 79 347 9.8 2 037 447 30–44 7.1 14 425 10.7 107 819 7.8 48 315 10.2 2 112 627 45–65 10.5 21 308 12.3 123 704 8.0 49 419 12.3 2 548 837 65 and over 10.4 21 028 7.4 73 972 2.1 13 052 7.2 1 485 940
for people who did not answer the Indigenous origin question. The exhaustion rate could be quantified as the ratio of the nonresponse rates for these two questions. This shows that Indigenous respondents were 7.2 times more likely to fail to complete the unpaid care question than the sex question, compared with 5.6 times for non-Indigenous respondents and 3.4 times for those who did not answer the Indigenous status question. In summary, the exhaustion effect appears to affect more those who did answer the Indigenous origin question than those who did not.
Imputed households
Imputed households, 2016
An understanding of the characteristics of imputed households is more difficult to come by because, by definition, they have not answered any questions on the census form. However, we can learn something about this large and growing part of the nonresponding population by examining the places in which nonresponding households live. This includes the proportion of an area who identify as Indigenous. The key assumption here is that, while people in imputed households may differ systematically from people in households that returned a census form, they are likely to be more similar to their immediate neighbours than they are to be similar to a randomly selected person in other parts of Australia. Consequently, an investigation of the areas in which imputed households live can tell us something about the characteristics of those households, about which little else is known.
Table 5 shows responses to selected census questions in the neighbourhoods where people in imputed households live. Here the ‘neighbourhood’ is approximated by census geographic units termed ‘Statistical Area 1’ (SA1) – areas of census tabulation with an average of approximately 400 people. The first column shows the ‘unadjusted’ percentage of people living in imputed households by the characteristics of their SA1. For example, in SA1s where between 0% and 2.8% of the population identified as Indigenous, 4.0% of census responses are from imputed households. However, in SA1s where between 10.0% and 33.3% of the population are Indigenous, 7.4% of census responses are from imputed households. This shows that rates of household imputation are higher in areas with a greater Indigenous presence, and suggests, therefore, that Indigenous people may be overrepresented among imputed households and therefore underrepresented in census counts.
Continuing down that ‘unadjusted’ column, it is clear that remote areas have the highest rate of household imputation, with 8.8% of census responses in these areas created by household imputation. Household imputation was lower in linguistically diverse neighbourhoods, and in neighbourhoods with low poverty rates and highly educated populations. Imputation rates were higher in areas with many nonfamily households (i.e. group houses, people living alone or visitor-only households), in areas with many apartment blocks and in areas with relatively little internet access.
However, many of these variables are correlated at the SA1 level. For example, areas that are more remote are also more likely to have a higher proportion of the population that are of Indigenous origin. For that reason, a multivariate regression model was created to adjust for this correlation and determine the extent to which each areal characteristic is driving household imputation rates. The ‘adjusted’ column presents the estimated household imputation rate after adjusting for correlated variation in other variables. It shows, for example, that 4.0% of people in SA1s where 0.0–2.8% of the population are of Indigenous origin are estimated to have been imputed. However, holding all other neighbourhood characteristics constant, an estimated 3.7% of households are
estimated to be imputed in SA1s with an Indigenous population of 33.3–100%. This suggests that in these areas it is not Indigenous status per se that is driving household imputation, but other characteristics of those areas such as remoteness and poverty. Indeed, the fact that household imputation rates are estimated to be lowest in areas where the highest proportion of the population is Indigenous suggests that the special enumeration strategies that are implemented to collect the census in these areas are effective.
Remoteness is revealed to be the single variable with the biggest impact on adjusted household imputation rates. Adjusted imputation rates rise along the remoteness gradient from 3.9% in major cities to 6.9% in remote areas, falling somewhat to 5.1% in ‘very remote’ areas. By definition, more remote areas are more difficult to reach, and this appears to affect household imputation rates. Efforts to reduce household imputation rates appear to require a focus on remote and outer regional areas. The adjustment process has a significant impact on the imputation rates for linguistically diverse areas. The unadjusted imputation rate was lower in linguistically diverse areas, which is somewhat counterintuitive because it might be expected that those speaking a language other than English might be less able to
complete the census. However, this surprising correlation is reversed after other variables are accounted for. It appears likely that it is the locations of linguistically diverse populations that are responsible for their low imputation rates, rather than linguistic diversity per se. Even after adjustment, imputation rates remained correlated with income poverty rates, education rates, rates of nonfamily households and rates of apartment living. However, the magnitudes of these gradients were reduced.
Change in household imputation rates, 2011–16
While the foregoing analysis describes the correlates of imputation rates in SA1s in 2016, it does not answer the question of which neighbourhoods saw the biggest increase in household imputation rates between 2011 and 2016. Answering this question is important because it helps us to understand both the drivers of this significant increase in nonresponse and potential biases that may be introduced when comparing 2011 and 2016 Census findings. In unadjusted terms, imputation rates increased most in areas where a high proportion of people
completing the census identified as Indigenous (2.2%), as well as in remote areas (2.7%), areas with little linguistic diversity (2.1%), areas with high poverty rates (1.6%) and areas with low education rates (2.2%).
Significantly, given the 2016 Census’s emphasis on online census form completion coupled with a website failure on census night, areas with a high degree of internet adoption had a smaller increase in household imputation rates than areas with little internet adoption. Considered along with the finding that the growth of household imputation was slowest in major cities (0.7%) – areas where the ABS was most likely to adopt the ‘digital first’ census completion strategy – this suggests that the growth in household imputation rates is unlikely to be driven by people who were inconvenienced by the website failure. This finding corresponds with the report of the Independent Assurance Panel (Harding et al. 2017), which suggested that changes to the method for constructing the sample frame of dwellings eligible to return a census form may be responsible for the increase in household imputation.
Analysis of the adjusted estimates of change in
household imputation rates confirms much of this story. However, in the case of Indigenous status, it suggests that household imputation rates grew most slowly (or actually decreased) in areas where the proportion of Indigenous residents was highest, all other things being equal. Consequently, it seems that the growth of household imputation between 2011 and 2016 was not driven by a decreased propensity to respond to the census among the Indigenous population. Rather, the
findings of this Census Paper suggest that the increase in the number of records with no response to the Indigenous origin question appears to mostly result from changing enumeration methods (Harding et al. 2017) and is unlikely to reflect an increased refusal to return census forms. As such, special measures to deal with census nonresponse among the Indigenous population do not appear to be necessary. The usual care required when interpreting incomplete census data is adequate.
Exploring the unexplained
population growth
The geography of unexplained population growth
Indigenous population growth between 2011 and 2016 was well above what could be explained by natural increase alone. As described above, the Indigenous population on 9 August 2016 was estimated to be 786 689 on the basis of the PES alone (excluding Indigenous residents temporarily overseas, the inclusion of whom brings the population estimate to 798 381). This was around 42 000 more than the upper range of the Indigenous population projections based on the 2011 Census. This unexplained population growth is likely to arise from identification change, and potentially from changes to enumeration and processing methods between the 2011 and 2016 censuses.There is little reason to expect that the unexplained population growth is evenly distributed across the country. Although too little information has been published to construct detailed regional population estimates, including age–sex distributions, provisional estimates can be arrived at using a simple, three-step procedure. First, those records with no response to the Indigenous origin question had their Indigenous status imputed based on the percentage of respondents who identified as Indigenous in their SA1. This increased the Indigenous population from a count of 643 136 (excluding those in migratory, shipping and offshore areas) to an estimate of 692 182. Second, a provisional population estimate for each region was arrived at by multiplying these regional, prorated Indigenous population estimates by 1.137. This multiplier was selected so that the sum of all regional population estimates equalled 786 689, the national estimate derived from the PES. Third, Indigenous population projections for each region for 2016, based on the 2011 Census, were subtracted from provisional population estimates for regions. The 2011-based projections were produced on the basis of natural increase and a repetition of 2006–11 migration patterns (Biddle 2013). Consequently, the subtraction of the 2011-based projection from the 2016-based estimate gives a measure of unexpected population
TABLE 4 .
Responses to selected census questions among those who returned a census form, by
nonresponse and response to the Indigenous origin question, 2016
Census question
Indigenous status not stated (%) Stated Indigenous (%) Stated non-Indigenous (%) Primary reference person on form
Yes 0.9 2.0 97.2 No 1.0 3.4 95.6 Sex Male 0.9 2.8 96.3 Female 0.9 2.9 96.3 Not stated 12.9 4.8 82.2 Age Stated 0.9 2.8 96.3 Not stated 20.2 11.7 68.1
Legal marital status
Never married 0.6 3.9 95.4 Widowed 1.6 1.5 96.9 Divorced 0.9 1.8 97.3 Separated 0.9 3.2 95.9 Married 0.6 1.1 98.3 Not stated 35.2 11.1 53.7
Language spoken at home
English 0.8 3.2 96.0
Indigenous language 0.2 98.5 1.3
Neither English nor Indigenous language 0.7 0.2 99.1
Not stated 14.4 7.9 77.7
Highest year of school
12 0.5 1.3 98.2 10 or 11 0.8 3.2 96.0 9 or less 1.1 4.1 94.8 Not stated 8.4 5.6 86.0 Personal income $399 or less 0.9 3.2 96.0 $400–$799 0.8 2.4 96.8 $800 or more 0.5 1.4 98.1 Not stated 7.1 5.4 87.5
Provided unpaid care or assistance
Yes 0.6 2.1 97.2
No 0.8 2.7 96.5
Not stated 8.0 5.2 86.8
Was away from home on census night
Yes 0.9 2.8 96.3
No 1.4 4.6 94.0
Total 0.9 2.9 96.2
Notes: All tabulations are for non-imputed people enumerated in private dwellings. Items are presented in the order of their appearance on the 2016 Census Household Form. Indigenous status appears on the form between the questions about marital status and language spoken at home. Questions on marital status, high-school completion, personal income and unpaid care were only asked of those aged 15 or older.
TABLE 5 .
Percentage of unit nonresponse in private dwellings, by SA1 characteristics, 2016
Characteristics of SA1s in the 2016 Census
Average household imputation rate, 2016
(%)
Change in average household imputation rate, 2011–16
(%)
Unadjusted Adjusted Unadjusted Adjusted Indigenous people 0.0–2.8% 4.0 4.0 0.9 1.4 2.8–10.0% 5.0 4.5 1.7 1.2 10.0–33.3% 7.4 5.2 2.2 0.8 33.3–100% 5.8 3.7 2.2 −0.3 Remoteness Major city 3.9 3.9 0.7 1.0 Inner regional 4.9 4.8 2.1 1.7 Outer regional 6.3 5.5 2.6 2.1 Remote 8.8 6.9 2.7 2.4 Very remote 5.9 5.1 2.0 2.0
People who speak a non-Indigenous language at home other than English
0.0–6.2% 4.7 4.0 2.1 1.5
6.2–21.8% 3.3 4.4 1.1 1.3
21.8–100% 3.3 4.4 0.5 1.0
Households in income poverty
0.0–9.6% 3.7 4.0 0.7 1.2
9.6–15.6% 4.2 4.2 1.1 1.2
15.6–100% 5.4 4.6 1.6 1.5
Adults who have completed Year 12
0.0–48.7% 5.2 4.3 2.2 1.3 48.7–65.2% 4.0 4.4 1.1 1.3 65.2–100% 4.1 4.0 0.4 1.3 Nonfamily households 0.0–20.3% 3.0 3.6 0.8 1.4 20.3–32.7% 4.2 4.3 1.2 1.3 32.7–100% 6.1 5.1 1.4 1.2
Households living in apartments in three-story or higher buildings
0.0% 4.0 4.0 1.3 1.3
0.1–32.6% 5.1 5.0 0.8 1.3
32.6–100% 7.4 6.8 0.0 0.9
Households with internet
0.0–82.7% 5.6 4.2 2.0 1.5
82.7–90.7% 4.3 4.3 1.0 1.2
90.7–100% 3.6 4.2 0.5 1.1
Total 4.4 4.4 1.3 1.3
Notes: Cell values indicate the percentage of census records of people in private dwellings in each category that are imputed. Unadjusted figures report the crude cross-tabulations. Adjusted figures report the results of a series of generalised linear models (GLMs). The adjusted cell values report the average modelled percentages, holding other variables constant at their means. SA1s, weighted by the number of residents in private dwellings, were used as the units of analysis for these models. Because of the large number of SA1s in the analysis, all variables in GLMs were significant, even when the effect sizes were very small. Consequently, only predicted values are displayed.
change for each region. Because some of this population change will be explained by changing migration patterns between 2011 and 2016, we term this population change ‘unexpected’ rather than ‘unexplained’. However, internal migration data will not be available until the second release of census data later this year.
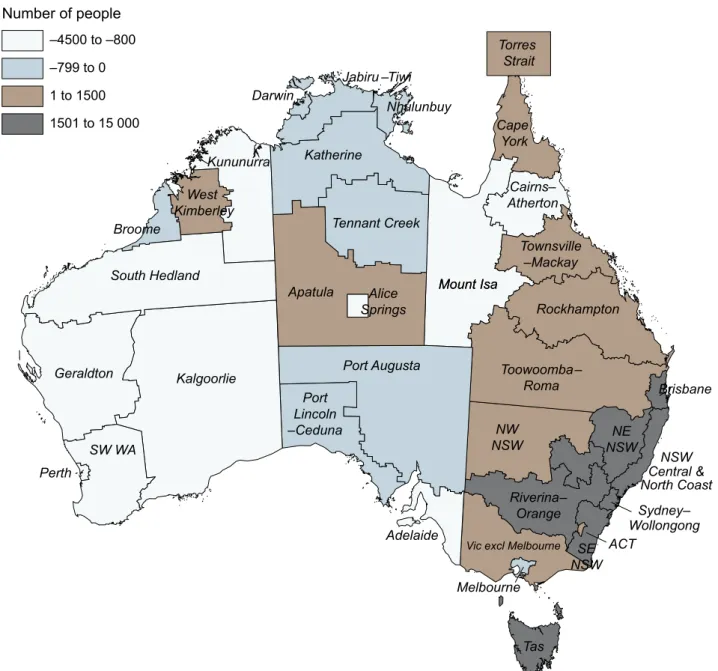
Estimates of unexpected population change are displayed in Fig. 7 and Table 6. Much of the unexpected population increase occurred in southeastern Australia. In particular, more than 75% of the unexpected population increase occurred in just five regions: New South Wales Central and North Coast (14 844), Sydney–Wollongong (7412), Brisbane (5813), Riverina–Orange (4713), and North-Eastern New South Wales (3600). While these regions
were projected to experience substantial population increase, the actual population increase substantially exceeded expectations. However, not all regions saw greater than expected population growth between 2011 and 2016. For example, the sixth most rapidly growing region, Townsville–Mackay, had an estimated Indigenous population increase of 4800 people, very close to the projected increase of 4600. Other regions experienced population changes that were substantially less than projected. For example, the Indigenous population of Perth was projected to increase by 5628 between 2011 and 2016, but instead grew by only 1734 people. Similarly, the Indigenous population of Alice Springs was projected to increase by 817 people, but our estimates suggest that it decreased by 745 people.
FIG . 7.
Unexpected population change by Indigenous region, 2011–16
Mount Isa –4500 to –800
Number of people
–799 to 0 Mount Isa 1 to 1500 1501 to 15 000 Broome West Kimberley Torres Strait Cape York Cairns– Atherton Townsville –Mackay Rockhampton Brisbane NE NSW NW NSW Tas Adelaide Port Augusta Apatula Alice Springs South Hedland Kalgoorlie Perth SW WA Sydney– Wollongong SE NSWVic excl Melbourne
Riverina– Orange Jabiru –Tiwi Toowoomba– Roma Katherine Tennant Creek Port Lincoln –Ceduna Kununurra Darwin Geraldton Melbourne ACT NSW Central & North Coast Mount Isa Nhulunbuy
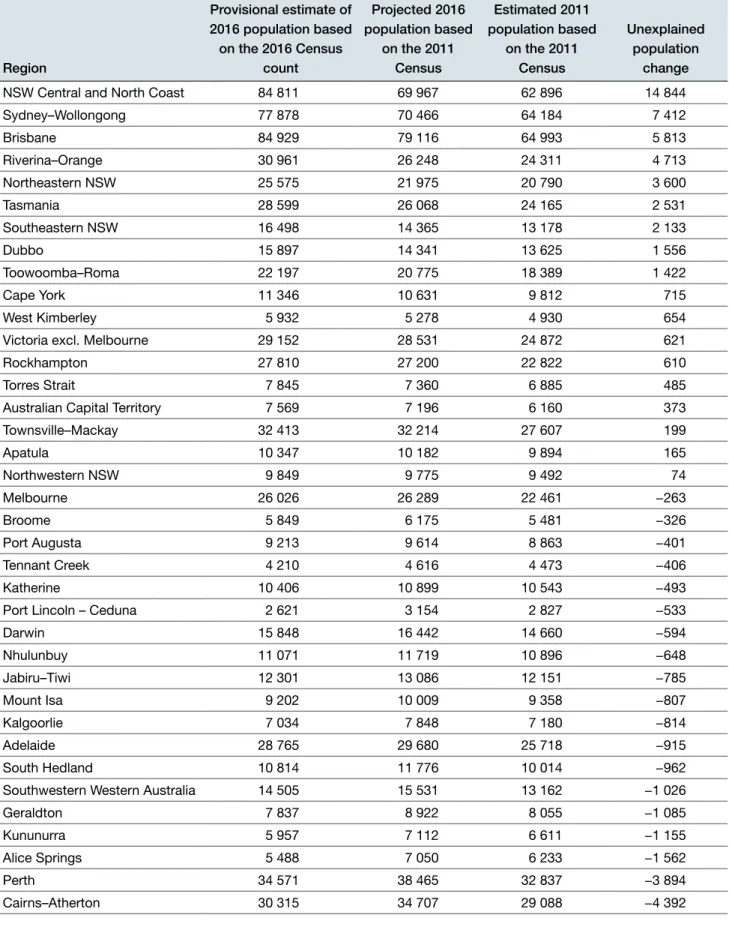
TABLE 6 .
Provisional estimates of the 2016 Indigenous population of regions based on the 2016
Census, compared with projections of the 2016 Indigenous population based on the 2011 Census and
natural increase
Region Provisional estimate of 2016 population based on the 2016 Census count Projected 2016 population based on the 2011 Census Estimated 2011 population based on the 2011 Census Unexplained population changeNSW Central and North Coast 84 811 69 967 62 896 14 844
Sydney–Wollongong 77 878 70 466 64 184 7 412 Brisbane 84 929 79 116 64 993 5 813 Riverina–Orange 30 961 26 248 24 311 4 713 Northeastern NSW 25 575 21 975 20 790 3 600 Tasmania 28 599 26 068 24 165 2 531 Southeastern NSW 16 498 14 365 13 178 2 133 Dubbo 15 897 14 341 13 625 1 556 Toowoomba–Roma 22 197 20 775 18 389 1 422 Cape York 11 346 10 631 9 812 715 West Kimberley 5 932 5 278 4 930 654
Victoria excl. Melbourne 29 152 28 531 24 872 621
Rockhampton 27 810 27 200 22 822 610
Torres Strait 7 845 7 360 6 885 485
Australian Capital Territory 7 569 7 196 6 160 373
Townsville–Mackay 32 413 32 214 27 607 199 Apatula 10 347 10 182 9 894 165 Northwestern NSW 9 849 9 775 9 492 74 Melbourne 26 026 26 289 22 461 −263 Broome 5 849 6 175 5 481 −326 Port Augusta 9 213 9 614 8 863 −401 Tennant Creek 4 210 4 616 4 473 −406 Katherine 10 406 10 899 10 543 −493
Port Lincoln – Ceduna 2 621 3 154 2 827 −533
Darwin 15 848 16 442 14 660 −594 Nhulunbuy 11 071 11 719 10 896 −648 Jabiru–Tiwi 12 301 13 086 12 151 −785 Mount Isa 9 202 10 009 9 358 −807 Kalgoorlie 7 034 7 848 7 180 −814 Adelaide 28 765 29 680 25 718 −915 South Hedland 10 814 11 776 10 014 −962
Southwestern Western Australia 14 505 15 531 13 162 −1 026
Geraldton 7 837 8 922 8 055 −1 085
Kununurra 5 957 7 112 6 611 −1 155
Alice Springs 5 488 7 050 6 233 −1 562
Perth 34 571 38 465 32 837 −3 894
Cairns–Atherton 30 315 34 707 29 088 −4 392
Table 6 suggests that, on average, regions with a larger population in 2011 had a greater proportion of unexpected population growth. However, this pattern should not be overinterpreted. The three most populous Indigenous regions, New South Wales Central and North Coast, Sydney–Wollongong, and Brisbane, recorded the greatest amount of unexpected population growth. After these three regions are set aside, however, there is no relationship between a region’s population in 2011 and the level of unexpected 2011–16 population change. Further research is needed to understand the spatial concentration of unexpected population change, estimating the relative contributions of changing rates of ‘out-marriage’, changing migration patterns and geographically uneven identification change to the observed patterns of unexpected population growth.
Identification change and
socioeconomic outcomes
It is important to note that identification change may play a role in changes to socioeconomic indicators for the Indigenous population between 2011 and 2016 that will be described in future CAEPR 2016 Census Papers. Previous research using the Australian Census Longitudinal Dataset (ACLD) to examine the socioeconomic position of those who did not identify as Indigenous on the 2011 Census but did identify as Indigenous in the 2016 Census found that this group of ‘new identifiers’ occupied an intermediate socioeconomic position between those who identified as Indigenous in both censuses and those who identified as non-Indigenous in both censuses (Biddle & Crawford 2015). This implies that identification change is likely to confound apparent socioeconomic changes for the Indigenous population between censuses. In other words, there is a risk that we can misinterpret changes to the aggregate socioeconomic position of the Indigenous population between the 2011 and 2016 censuses as meaning that the life chances of the cohort are improving. This is not necessarily the case if some of that improvement may be the result of the changing composition of the group of people who are identified as Indigenous in the census.
Figs 8 and 9 illustrate this phenomenon. In Fig. 8, the percentage of the population that stated that both of their parents were born in Australia is plotted by age for Indigenous and non-Indigenous people. Because the actual birthplace of parents for individuals will rarely change over time, we can compare the population percentages for 2016 with those for 2006 and 2011 by calculating the 2016 age of 2006 and 2011 respondents. Consequently, the horizontal axis of this graph shows the population age in 2016, while separate lines are drawn to
indicate responses to the 2006, 2011 and 2016 censuses. Those who arrived in Australia during intercensal periods are excluded. If respondents answered the birthplace of parents consistently over time and the same respondents were consistently classified as Indigenous across multiple censuses, we would expect these lines to coincide. However, it is evident that there are gaps between the lines for 2006 and 2016.
We can suggest four possible mechanisms that might contribute to the change in the percentage of the
Indigenous population reporting that both of their parents were born in Australia. First, people may have changed their responses to the birthplace of parents’ question between censuses. We can think of few reasons to expect a systematic change in answers to this question for Indigenous people but not for non-Indigenous people, however. Second, Indigenous people with both parents born in Australia may have had a higher mortality rate between censuses than those with a parent born overseas. This may be a plausible contribution to the intercensal change in outcomes, but it is of unknown magnitude. Third, it is possible that those with both parents born in Australia may be more likely to emigrate. However, this is unlikely given that having overseas relatives seems likely to increase propensity to emigrate (cf. Conway & Potter 2009). Finally, and most relevant to this paper, there is likely to be a greater proportion of people with a parent born overseas among members of the population who identified as Indigenous for the first time in 2016, compared with the population that identified as Indigenous in 2011.
Fig. 8 suggests that several of these phenomena are likely to be occurring. In particular, younger non-Indigenous people appear to be more likely over time to report that one of their parents was not born in Australia, indicative of changing answers to the parents’ birthplace question. More importantly for the purposes of this paper, between 2006 and 2016, Indigenous people across the age spectrum have become more likely to report that at least one of their parents was born overseas. This shift is likely to reflect a change in the composition of the Indigenous population, with those who identified as Indigenous for the first time in 2016 being more likely to have a parent born overseas than those who have identified as Indigenous since 2006.
Fig. 9 illustrates a similar pattern but with respect to high-school attainment. Here we plot the proportion of the population that has not completed Year 10 or higher by age in 2016 for Indigenous and non-Indigenous identifiers in the 2006, 2011 and 2016 censuses. Those who arrived in Australia during intercensal periods are
excluded. Here the non-Indigenous population shows almost no change in high-school attainment over time, suggesting that individuals are answering this question consistently over time. Large differences appear for the Indigenous population, however. Specifically, the Year 10 attainment rate increased by around 5% between 2006 and 2016 across the life course. Such an increase is unlikely to be explained by either Indigenous people of all ages returning to high school or by changing responses to the educational attainment questions on the census.
Rather, they are likely to indicate that those who changed their Indigenous identification between 2006 and 2011 or between 2011 and 2016 have a substantially greater high-school attainment rate than those who have always identified as Indigenous. Furthermore, because education is a determinant of health for Indigenous and
non-Indigenous Australians (Marmot 2011, Shepherd et al. 2012, Crawford & Biddle 2017), it is likely that some of the apparent increase in the education levels of Indigenous people is a result of the premature deaths of the less well educated.
FIG . 8 .
Change in the percentage of the
population with both parents born in Australia for
Indigenous and non-Indigenous Australians, by
age in 2016
40 50 60 70 80 90 100 Female 40 50 60 70 80 90 100 MalePopulation with both parents born in
Australia (%)
10–14 years15–19 years20–24 years25–29 years30–34 years35–39 years40–44 years45–49 years50–54 years55–59 years60–64 years65–69 years70–74 years75–79 years80–84 years85 years and over
Age in 2016 Indigenous Non-Indigenous
2006 2011 2016
FIG . 9.
Change in the percentage of the
population that left high school after Year 9, for
Indigenous and non-Indigenous Australians, by
age in 2016
0 20 40 60 80 100 0 20 40 60 80 100 Female MalePopulation complated no more than
Year 9
35–39 years40–44 years45–49 years50–54 years55–59 years60–64 years65–69 years70–74 years75–79 years80–84 years85 years and over 30–34 years
Age in 2016 Indigenous Non-Indigenous