Hungry Cities Partnership Reports and Papers
2015
Entrepreneurship and Inclusive Growth in South Africa, Zimbabwe
Entrepreneurship and Inclusive Growth in South Africa, Zimbabwe
and Mozambique
and Mozambique
Jonathan Crush
Balsillie School of International Affairs/WLU, jcrush@wlu.ca
Caroline Skinner
University of Cape Town
Abel Chikanda
University of Kansas
Follow this and additional works at: https://scholars.wlu.ca/hcp
Part of the Food Studies Commons, Human Geography Commons, Politics and Social Change Commons, and the Urban Studies and Planning Commons
Recommended Citation Recommended Citation
Crush, J., Skinner, C. & Chikanda, A. (2016). Entrepreneurship and Inclusive Growth in South Africa, Zimbabwe and Mozambique (rep., pp. 1-72). Waterloo, ON: Southern African Migration Programme. SAMP Migration Policy Series No. 68.
This Other Report is brought to you for free and open access by the Reports and Papers at Scholars Commons @ Laurier. It has been accepted for inclusion in Hungry Cities Partnership by an authorized administrator of Scholars Commons @ Laurier. For more information, please contact scholarscommons@wlu.ca.
I
nformal
m
Igrant
E
ntrEprEnEurshIp
and
I
nclusIvE
g
rowth
In
s
outh
a
frIca
, Z
ImbabwE
and
m
oZambIquE
i
nformal
m
iGrant
e
ntrePreneurshiP
and
i
nClusive
G
rowth
in
s
outh
a
friCa
, Z
imbabwe
and
m
oZambique
j
onathanC
rush, C
arolines
kinner anda
belC
hikandamiGration PoliCy series no. 68
s
eriese
ditor:
P
rof. j
onathanC
rushs
outhern
a
friCan
m
iGration
P
roGramme
(samP)
i
nternational
m
iGration
r
esearCh
C
entre
(imrC)
funding the Growing Informal Cities Project, a partnership between SAMP, the African Centre for Cities (UCT), the International Migration Research Centre (Balsillie School of International Affairs), the Gauteng City Regional Observatory and Eduardo Mondlane University (Mozambique). Our thanks to Bronwen Dachs for her assistance with this report.
© Southern African Migration Programme (SAMP) 2015 ISBN 978-1-920596-10-1
First published 2015
Production by Bronwen Dachs Müller, Cape Town
All rights reserved. No part of this publication may be reproduced or transmitted, in any form or by any means, without prior permission from the publishers.
introduCtion 9
urbaniZationand informality 12
international miGrationin southern afriCa 17
miGrantsandthe informal eConomy 24
informal Cross-border tradinG 29
informal remittinG enterPrise 34
Gender, mobilityand entrePreneurshiP 36
miGrant entrePreneurial motivation 38
PatholoGiZinG sPaCe, PoliCinG informality 39
ConClusion 45
endnotes 49
miGration PoliCy series 69
l
ist oft
ablesP
aGetable 1: reGionof oriGinof visitorsto south afriCa, 2013 18
table 2: foreiGn CitiZens livinGin south afriCa, 2011 18
table 3: foreiGn miGrants livinGin south afriCaby Countryof 19
birthand emPloyment status
table 4: dePortationsof Zimbabweansfrom south afriCa, 1999-2008 21
table 5: dePortationof moZambiCansfrom south afriCa, 1999-2008 23
table 6: finanCial bootstraPPinGby miGrant entrePreneursin 27
inner-City johannesburG
table 7: emPloyment Creationby informal entrePreneurs, 29
s h C (%)
table 10: Problems faCedby Cross-border tradersin johannesburG 33
table 11: remittanCe Channels usedby moZambiCanand Zimbabwean 35
miGrantsin south afriCa
l
istoff
iGuresP
aGefiGure 1: Currentand ProjeCted urbaniZationin sadC Countries 9
fiGure 2: southern afriCa urban PoPulation Growth, 1950-2050 10
fiGure 3: emPloymentinthe informal seCtorin seleCted afriCan 11
Countries (% ofnon-aGriCulturalwork)
fiGure 4: south afriCan arrivalsand dePartures, 2000-2013 17
fiGure 5: aPPliCationsfor refuGee statusin south afriCa, 1996-2012 19
fiGure 6: leGal entriesof Zimbabweansinto south afriCa, 1980-2012 20
fiGure 7: asylum aPPliCationsby Zimbabweansin south afriCa, 22
2001-2010
fiGure 8: leGal entriesof moZambiCansinto south afriCa, 1999-2013 23
fiGure 9: intra-sadC informal Cross-border tradein food staPles, 30
2005-2012
fiGure 10: money sPentin south afriCa Per visitby Cross-border 32
traders
fiGure 11: numberof triPsto south afriCa Per yearby Cross-border 32
e
xeCutives
ummaryW
hile increasing attention is being paid to the drivers and forms of entrepreneurship in informal economies, much less of this policy and research focus is directed at understanding the links between mobility and informality. This report examines the current state of knowledge about this relationship with particular reference to three countries (Mozambique, South Africa and Zimbabwe) and four cities (Cape Town, Harare, Johan-nesburg and Maputo), identifying major themes, knowledge gaps, research questions and policy implications. In many African cities, informal enter-prises are operated by internal and international migrants. The extent and nature of mobile entrepreneurship and the opportunities and challenges confronting migrant entrepreneurs are under-researched in Africa in gen-eral and Southern Africa in particular. Their contribution to the informal economy and employment generation in countries of destination and origin are similarly undervalued by policy-makers. Informal migrant entrepreneurs are often viewed with suspicion, if not hostility, by citizens and officials. In part, this is because central and municipal governments see them as increas-ing the growth of an informal sector that they want tamed, if not eradicated. Also, it is because they are often incorrectly seen as all “illegal immigrants” and, by definition, engaged in illicit activities. And, in countries with high levels of xenophobia such as South Africa, migrant-owned businesses are a visible and easy target for xenophobic attacks. Violent attacks on migrant entrepreneurs and their property have become extremely common in many South African cities.South Africa’s relatively small informal sector is accompanied by very high unemployment levels. Many commentators therefore feel that the South African informal economy ought to be much larger than it is. Given the apartheid-era repression of informal entrepreneurship, the key question may not be why the informal economy is not larger, but why, after decades of repression, it is as large and important as it is. One of the reasons is that the informal economy is not just populated by South African citizens. Migrants from other African countries play an increasingly important role in the sector and experience considerable success, something that eludes many locally-owned start-ups. Informal retailing has been the major focus of economic research on different sub-sectors of the informal economy. Particularly common are small-area case studies of survivalist street trading (particularly of food and handicrafts) in the inner city. The spaza shop sec-tor in low-income residential areas has also been studied. Other informal entrepreneurial activities that have attracted attention include the minibus taxi industry, waste collection and recycling, shebeens, trade in medicinal plants and poverty tourism.
As well as documenting the economic challenges of informality, the existing literature on the South African informal economy raises two other
important issues that have a bearing on the environment for entrepreneur-ship. The first is the relationship between formal and informal retail. The central research question is whether the rapid expansion of malls and supermarkets across the South African urban landscape, and their recent penetration of low-income areas, is having a negative impact on the infor-mal economy. The second issue concerns the forinfor-malization of inforinfor-mal businesses, partially due to the ILO’s 2014-15 standard-setting process on “Formalizing the Informal Economy.” For reasons including greater legal control, collection of taxes and registration fees, enforcement of labour leg-islation and identification and deportation of irregular migrants, the South African authorities would like to see the informal economy subject to formal rules and regulations. In South Africa, the drive towards formalization has progressed furthest in the taxi industry but many sectors of the informal economy remain outside the regulatory fold. Most informal entrepreneurs are opposed to formalization, stressing the financial costs and constraints on business flexibility.
The Zimbabwean experience raises important questions about the links between the collapse of the formal economy and the growth of informality. At independence in 1980, Zimbabwe’s urban informal economy was small, absorbing about 10% of the labour force. By 2003, it accounted for over 70% of the labour force and its contribution to gross national income (GNI) had grown to around 60%. In 2011, 84% of the workforce were in informal employment. The largest number were in retail and wholesale trade fol-lowed by repair of motor vehicles and cycles, services and manufacturing. Women constituted 53% of those in informal employment. There have been few studies of the impact of state failure on the urban informal economy. Yet, under conditions of economic crisis, participation in more lucrative income-generating activities in the informal sector becomes essential and there are strong indications that the collapse of the economy actually had a positive impact on Zimbabweans’ entrepreneurial motivations and skills.
Mozambique represents a different scenario in terms of the links between informal entrepreneurship and formal economic growth. The Mozambican economy was virtually destroyed by the civil war in the 1980s and the vast majority of urban residents managed to survive through the informal econo-my. In the last two decades, Mozambique has had one of the fastest-growing formal economies in Africa. Yet, the informal economy has proven to be extremely resilient. A 2005 survey concluded that 75% of the economically-active population was employed informally in Mozambique. Another survey of Maputo found that 70% of the city’s households are involved in informal economic activities and about 65% of jobs are in the informal economy. Although research on the informal economy is not as extensive as in Zimba-bwe or South African cities, several studies have highlighted the dynamism and heterogeneity of the sector and the role of informal entrepreneurship in
poverty reduction. The most common type of informal economic activity is the sale of foodstuffs and petty commodities.
Mobility is essential to the urban informal economy in Southern African cities. Within urban areas, mobility is a vital component of the business strategies of informal operatives who identify spaces with niche markets or a relative absence of the formal sector. While some businesses operate from fixed sites, others use different parts of the city on different days or at dif-ferent times of a single day. Many participants in the informal economy are internal or international migrants, often in competition with one another for the same market share. Although the numbers of international migrants are frequently exaggerated, it is clear that they have played an increasingly important role in the informal economies of Southern African cities over the last two decades and have reshaped the nature of informality and infor-mal entrepreneurship in the region. Yet the importance of that role is often underestimated, invisible to researchers and denigrated by policy-makers.
Recent studies of migrant entrepreneurship in South Africa focus on several key issues:
-neurs;
capital, cost-saving strategies such as shared shop spaces, revenue-boosting strategies such as bulk buying, and material support such as accommodation for newly-arrived migrants;
a constant threat to migrant business activity; owners;
activity; and
-neurship.
Migrants are often more entrepreneurial than most, yet the constraints they face in establishing and growing their businesses are considerable. Their general contribution to employment creation and inclusive growth is undervalued and often misrepresented as a threat. Foreign migrants in the South African informal economy do have considerable entrepreneurial ambition but are severely hampered in growing their enterprises by obstacles including:
and conditions of entry and the ability to move along migration corridors between countries;
-cial and support services;
deportation disrupting business activity; refused bank accounts and loans);
sector, and hostile and xenophobic local attitudes.
Violent attacks on the persons and properties of migrant business opera-tions – whether motivated by rivalry, criminality or xenophobia or a combi-nation of these – are regular and frequent and involve considerable loss of property and life.
In terms of economic challenges confronting informal-sector entrepre-neurs, both South African and migrant, a major issue is the lack of access to financial services including start-up capital and ongoing credit. Formal financial institutions are extremely reluctant to do business with migrant informal entrepreneurs. As a result, many rely on various financial boot-strapping alternatives to minimize their capital outlay and running costs. Despite these financial challenges, there is evidence of upward mobility of migrant-owned businesses in terms of the growth of business capital. A central premise of the hostility towards foreign migrants in South Africa is that they “steal” jobs from South Africans. However, the studies reviewed in this report suggest the opposite. Migrant entrepreneurs certainly create employment opportunities for other migrants but they also hire many South Africans. More research is needed, however, on why migrant entrepreneurs employ South Africans and under what conditions. The essence of an inclusive-growth perspective on informality is that the sector should create “decent” jobs. Whether or not the jobs created deserve this label has yet to be established.
Among the most common manifestations of mobile informality in South-ern Africa are the inter-urban linkages across intSouth-ernational boundaries. When it comes to relations between South Africa, Mozambique and Zim-babwe, most of this business is conducted by individuals travelling overland and engaged in so-called ICBT (informal cross-border trade). ICBT plays a vital, though largely unrecognized, role in regional economic integration and in linking informal economies in different SADC cities. Informal trad-ers need to be seen as entrepreneurs and their activities as a potentially strong promoter of inclusive growth and employment creation across the region. In Mozambique and Zimbabwe, a sizeable number of informal entre-preneurs are international migrants. They establish their businesses in their home cities, such as Maputo and Harare, and grow them by taking advan-tage of the opportunities provided by cross-border economic linkages and migration. Informal cross-border traders, many of them women, thus play a critical role in the circulation of formally and informally produced goods throughout the SADC region.
A related aspect of the relationship between migration and informal entrepreneurship is the massive flow of cash remittances and goods that migrants in Johannesburg and Cape Town send to Mozambique and Zimba-bwe, including the cities of Maputo and Harare. The use of formal channels for remittance transfers is very limited in both Mozambique and Zimbabwe. The business opportunities for small-scale entrepreneurs in the remittances industry are largely in the channels through which remittances of cash and goods are sent home by migrants. Informal transport operators called the Omalayisha move cash, people and consumer goods between Zimbabwe and South Africa, for example.
Gender issues are of particular relevance in understanding the nature of informal enterprise in Southern African cities. Cross-border migration has always been highly gendered in the region. The feminization of migra-tion is well under way with the numbers and propormigra-tion of female migrants to South Africa increasing rapidly. Unable to obtain work permits, many women are hired as irregular migrants, which heightens their vulnerability. Others are forced into survivalist activities in the urban informal economy. In both Harare and Maputo, gender-based tussles characterize the informal economy. The collapse of the formal economy pushed many more men into the sector and made the highly competitive informal business environment a site of new conflict. Cross-border trade between Zimbabwe, Mozambique and South Africa was initially dominated by women but high rates of unemployment amongst men have prompted them to move into the trade, leading to growing gender conflict over control of sectors of the trade and the proceeds of trade.
These gender-based issues can be reformulated as a set of key research questions: (a) does the feminization of migration impact on the nature of participation of women in the informal economy, are there gender differ-ences in the types and opportunities for involvement of men and women in informal entrepreneurship and does small business development offer women (and especially women-headed households) a way out of urban poverty? (b) what kinds of challenges affect migrant female and not male entrepreneurs and what strategies do they adopt to establish and grow their businesses? (c) how do intra-household gender roles and expectations impact on the ability of women to establish and grow their informal enter-prises? and (d) are national and local policies on migration and the informal economy disadvantageous to female entrepreneurs and what kinds of policy reforms would mitigate this situation?
Participation in the informal economy may be enforced, in the sense that there are no alternatives, but that does not mean that all participants are therefore just “getting by” until a better opportunity presents itself in the formal economy. One of the most vexing questions for small-business advocates in South Africa is what is commonly seen as an underdeveloped
entrepreneurial motivation or “spirit” amongst those living in more disad-vantaged areas of the country. Some studies have contested this stereotype while others have sought explanations that are lodged in the repressive legacy of apartheid and the dysfunctional South African education system. The perception that migrants are far more successful entrepreneurs than South Africans in the informal economy has prompted a new research focus on migrant entrepreneurial orientation and motivation and favourable com-parisons with South African entrepreneurs. Migrants tend to score better than South Africans on various indicators of entrepreneurial orientation including achievement, innovation, personal initiative and “competitive intelligence.”
The three countries (and four municipalities) discussed in this report represent contrasting policy responses to the informal economy and infor-mal migrant entrepreneurship. The predominant attitude towards the informal economy in Zimbabwe over the last decade has been extremely negative and at odds with the reality of survival in a rapidly shrinking formal economy with mass unemployment. These views culminated in the nation-wide assault on informality through Operation Murambatsvina (Clean Out the Trash) in 2005, which attempted to destroy all manifestations of urban informality: businesses, markets and shelter. Murambatsvina temporarily devastated the informal economy and the livelihoods of the urban poor in many Zimbabwean cities but informality quickly rebounded and returned to the urban spaces from which it had been erased. If Zimbabwe’s economic recovery continues, it is important to know whether the state will adopt a more tolerant approach to informality or whether the vast informal econ-omy will continue to “fly under the radar” and be the target of repression.
In Mozambique, national and municipal authorities have traditionally adopted a tolerant approach to the informal economy. While it has been subject to periodic harassment, it is generally viewed within official circles as an important and sustainable source of livelihood for the urban poor. The policy aim is not to eliminate informality but to “discourage” illegal-ity through registration and formalization. One mechanism has been the establishment of formal urban markets where vendors pay rent for stands. However, many of these stands remain unoccupied. In 2008, a simplified tax for small businesses was introduced, payable as a percentage of turnover or as a lump sum. However, uptake has been low. Informal entrepreneurs have been largely resistant to such efforts, which are viewed as a “money grab by the state.” There is some evidence that operators who have registered and paid licences and taxes are more productive than those who spend a great deal of effort evading the authorities, but the obstacles to formalization and why this might be avoided or resisted need further research, as do the implications of formalization.
The South African response to informality lies somewhere between the Mozambican and Zimbabwean, but has been neither consistent nor coher-ent. At the national level, recent initiatives illustrate the kinds of anti-foreign thinking that inform the national government’s policy response. The National Informal Business Upliftment Strategy was launched in 2013 focusing on skills development, product improvement, technology sup-port, equipment, and help with registration. The stated target of business upliftment is entrepreneurial activity in the informal economy. However, it also expresses clear anti-foreign sentiments. Another was the tabling in Parliament of the draconian Licensing of Businesses Bill in 2013. The Bill is extremely punitive and would result in large-scale criminalization of current informal activities. It also suggests that community-based organizations, non-governmental organizations and others will be given the job of working with the licensing authorities to police non-South African businesses. The xenophobic attacks of 2008 demonstrated that there are elements in many communities who need no encouragement to turn on their neighbours from other African countries.
At the local level, in both Cape Town and Johannesburg, there are con-tradictions between policy statements affirming the positive contribution of the informal economy and the actual implementation of policy. In late 2013, the Johannesburg City Council violently removed and confiscated the inventory of an estimated 6,000 inner-city street traders, many of them migrants. The City has commissioned a project to consider alternatives to informality while simultaneously pursuing the declaration of large inner city areas restricted and prohibited trade zones. Recent research on inner-city Cape Town suggests that there is less violent but more systemic exclusion and there is evidence of ongoing harassment of traders throughout the city. Some of the most dedicated, enterprising and successful entrepreneurs in the South African informal economy are migrants to the country. Under any other circumstances they would probably be lauded by government as exam-ples of successful small-scale micro-entrepreneurship. However, the state and many citizens view their activities as highly undesirable simply because of their national origins. Harassment, extortion and bribery of officialdom are some of the daily costs of doing business in South Africa. Many entre-preneurs, especially in informal settlements and townships, face constant security threats and enjoy minimal protection from the police.
The Growing Informal Cities (GIC) project is examining and profil-ing the “hidden” role of migrant informal entrepreneurship in different Southern African cities. The cities were chosen for analysis and compari-son because they represent different forms of migrant entrepreneurship. In South African cities like Cape Town and Johannesburg, migrant entrepre-neurs come from throughout Africa including Zimbabwe and Mozambique. In Maputo and Harare, most migrant entrepreneurs are local but they
struc-ture their businesses around the opportunities afforded by growing regional integration and cross-border migration to and from South Africa. Policies towards informality and informal entrepreneurship vary from country to country. In Zimbabwe, the informal economy has been ruthlessly repressed but survives nonetheless. In Mozambique, there is a laissez-faire attitude towards the informal economy and attempts to formalize informal businesses through registration have not been particularly successful. In South Africa, informality is generally encouraged at the national level through training programmes and support activities. But at the municipal level, the informal economy is often viewed in negative terms and pathologized. The impacts of national and municipal programmes and actions are uncertain especially for migrant entrepreneurs. Indeed, these entrepreneurs, who could and do contribute to inclusive growth, are subjected to social and economic exclu-sion which spills over into xenophobia.
The GIC project is generating a comparative body of knowledge about informal migrant entrepreneurs, raising their profile in regional, national and municipal policy debates with a view to effecting positive change in the regulatory environment in which they operate. By allowing migrant entrepreneurs to expand and reach their full potential, free of harassment and exclusion, a major contribution can be made to facilitating inclusive growth through informal entrepreneurship. To this end, GIC is advancing understanding of the reciprocal links between mobility and informal entre-preneurship in Southern African cities through a programme of rigorous research oriented to the economic growth and poverty reduction goals of SADC governments, and impacting on policy implementation processes around migration, development and urban management.
i
ntroduCtionC
ities in the South will absorb 95% of urban growth in the next two dec-ades and by 2030 will be home to almost 4 billion people (or 80% of the world’s urban population).1 Urban growth will be most intense in the citiesof Asia and Africa. Over half of the population of the African continent will be living in urban areas by 2030 (or an estimated 750 million people). Southern Africa is one of the fastest-urbanizing regions in the world.2 The
region currently has a population of approximately 210 million, at least 100 million of whom live in urban and peri-urban areas. More than 60% of the population of two countries (Botswana and South Africa) is already urban-ized.3 By mid-century, 11 countries are projected to have more urban than
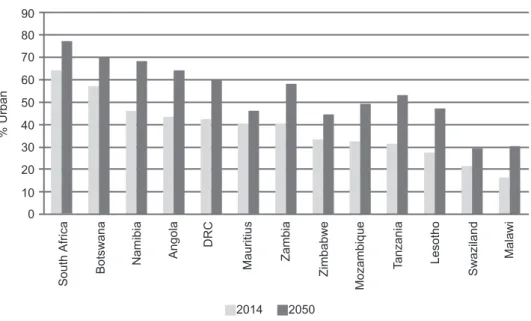
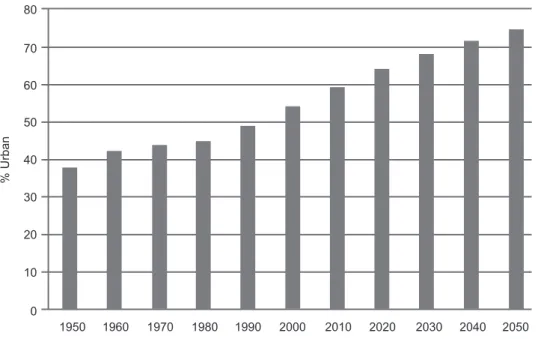
rural dwellers (Figure 1). More than half of the overall regional population already live in urban areas, a figure projected to rise to three-quarters by 2050. With rapid urbanization and persistent urban poverty, urban develop-ment challenges are set to intensify.4
Figure 1: Current and Projected Urbanization in SADC Countries
Source: Adapted from UN Department of Economic and Social Affairs5
% Urban 0 10 20 30 40 50 60 70 80 90 2050 2014 South Africa Botswana Namibia Angola DRC
Mauritius Zambia Zimbabwe
Mozambique
Figure 2: Southern Africa Urban Population Growth, 1950-2050
Source: Adapted from UN Department of Economic and Social Affairs, Population Division (2014)6
The African city is characterized by high and expanding degrees of informality. Old dualistic conceptions of an economically and territorially bounded “informal sector” in which desperate people participate as a tem-porary survival strategy until they can access the formal sector have given way to the reality that informality is the permanent condition for many new urbanites and is the defining feature of the landscape, politics and economy of the contemporary African city.7 As Simone has argued, “accelerated
urbanization in Africa has produced cities whose formal physical, political and social infrastructures are largely unable to absorb, apprehend or utilize the needs, aspirations and resourcefulness of those who live within them. As a result, the efforts to secure livelihoods depend on largely informalized processes and a wide range of provisional and ephemeral institutions which cultivate specific orientations toward, knowledge of, and practices for, deal-ing with urban life. Soon, the majority of Africans will live in peri-urban and informal settlements often at the physical, if not necessarily social, margins of the city.”8
The extent and importance of informality in African cities and to Afri-can economies is subject to widely varying estimates. The Economic Com-mission for Africa recently noted, for example, that “informal trade is as old as the informal economy. It is the main source of job creation in Africa, providing between 20 per cent and 75 per cent of total employment in most countries.”9 In most African cities, informality is the “main game in town.”10
1950 0 10 20 30 40 50 60 70 80 1960 1970 1980 1990 2000 2010 2020 2030 2040 2050 % Urban
Yet, as Potts notes, the lack of adequate data about informality “is scarcely surprising as one defining feature is that it is unregistered, and very loose treatment of the issue of ‘underemployment’ which often gets classified, erroneously, as unemployment.”11 The International Labour Organization
(ILO) and the research-policy network Women in Informal Employment: Globalizing and Organizing (WIEGO) have recently made considerable advances in generating country comparable and regional estimates of the size of the informal economy.12 Their data shows that informal employment
comprises more than half of non-agricultural employment in most regions of the Global South – 82% in South Asia, 66% in Sub-Saharan Africa, 65% in East and Southeast Asia and 51% in Latin America.13 There is also
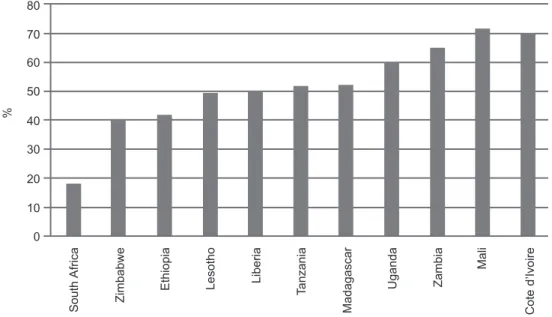
significant variation between countries. For example, the proportion of non-agricultural work in the informal sector ranges from 18% in South Africa to 40% in Zimbabwe to 71% in Mali (Figure 3).
Figure 3: Employment in the Informal Sector in Selected African Countries (% of non-agricultural work)
Source: ILO14
Although the individual incomes of informal workers are often low, cumulatively their activities contribute significantly to gross domestic prod-uct (GDP). The ILO has compiled data on the contribution of informal enterprises to national GDP in 16 Sub-Saharan countries and, on aver-age, the informal economy contributed 41%.15 The proportion varied from
58% in Ghana to 24% in Zambia. A more recent ILO publication provides evidence of the contribution of the informal economy to the GDP of a
South
Africa
Zimbabwe Ethiopia Lesotho
Liberia Tanzania Madagascar Uganda Zambia Mali Cote d ’ Ivoire 0 10 20 30 40 50 60 70 80 %
smaller number of countries. It finds, for example, that in Benin, Niger and Togo, the informal economy contributes more than 50% of non-agricultural GDP.16 These figures show that the informal economy not only plays an
important employment generation and poverty alleviation role, but is criti-cal to locriti-cal economies.
In many African cities, informal enterprises are operated by internal and international migrants. The extent and nature of mobile entrepreneurship and the opportunities and challenges confronting migrant entrepreneurs are under-researched in Africa in general and Southern Africa in particular.17
Their contribution to the informal economy and employment generation in countries of destination and origin are similarly undervalued by policy-makers. Informal migrant entrepreneurs are often viewed with suspicion, if not outright hostility, by citizenries and officialdom. In part, this is because central and municipal governments see them as increasing the growth of an informal sector that they would rather see tamed or eradicated. Also, it is because they are often incorrectly viewed as “illegal migrants” and therefore, by definition, engaged in illicit activities. And, in countries with high levels of xenophobia such as South Africa, migrant-owned businesses are a very visible and easy target for xenophobic attacks.18 Violent attacks
on the property and lives of migrant entrepreneurs have become extremely common in many South African cities – but are certainly not confined to South Africa.19
This report provides the backdrop for a new and systematic research agenda on migrant entrepreneurship in African cities. While increasing attention is being paid to the drivers and forms of entrepreneurship in infor-mal economies, much less of this policy and research focus (with the pos-sible exception of informal cross-border trade) is directed at understanding the links between mobility and informality. This report examines the current state of knowledge about this relationship with particular reference to three countries (Mozambique, South Africa and Zimbabwe) and four major cities (Cape Town, Harare, Johannesburg and Maputo), identifying major themes, knowledge gaps, research questions and policy implications.
u
rbaniZation andi
nformalityI
n Southern Africa, differences in the countries and cities of South Africa, Zimbabwe and Mozambique allow a comparative exploration of the links between the informal economy, entrepreneurship and inclusive growth. South Africa has the largest formal economy in the region but a relatively small informal sector. Statistics South Africa’s (SSA) 2014 April to June Quarterly Labour Force Survey recorded 2,379,000 people working in the informal sector.20 This constitutes only 16.5% of non-agriculturalretail trade (44%), community and social services (15%) and construction (15%). Unlike in many other developing countries, only a small group of people are involved in manufacturing (10%).22 Another unusual feature
of the South African informal economy is its gender composition. In the majority of Sub-Saharan African countries, the percentage of women in the informal sector is much higher than men; however, in South Africa more men than women work in the informal sector.23 In Quarter 1 (2008), 46% of
those reporting that they worked in the informal sector were women while by Quarter 4 (2014) this percentage was down to 40%, suggesting rapid change.24
South Africa’s small informal sector is accompanied by very high unem-ployment levels. The latest available SSA figures recorded 5,154,000 people as unemployed, while a further 2,419,000 were recorded as “discouraged” job seekers.25 Combined, this constitutes 33.4% of the labour force.26 Many
commentators therefore feel that the South African informal economy ought to be much larger. What is sometimes forgotten, however, is that until the 1990s the informal economy was viewed by apartheid policymak-ers as “an ominous and unpleasant aberration (and) a blot on the urban landscape.” The overwhelming policy thrust was “towards repression of small-scale enterprises, seeking their excision from the urban landscape.”27
Given this apartheid legacy and associated hostility towards informality, the key question may not be why the informal economy is not larger, but why, after decades of repression, it is as large and important as it is. That said, a body of research is emerging that looks at the barriers to self-employment in contemporary South African cities. These include crime, the risk of business failure, lack of start-up capital, high transport costs and social disincen-tives.28
Data for the Quarterly Labour Force Survey is gathered in such a way that city-level statistics are unreliable. Disaggregation by province sug-gests that the size and nature of the informal sector differs significantly. In the two most industrialized and urbanized provinces, the Western Cape and Gauteng, the informal sector is relatively small (at 11% and 14% of non-agricultural employment respectively).29 This contrasts with Limpopo
where 32% of non-agricultural work is in the informal sector. The Gauteng City-Region Observatory’s Quality of Life Survey of 2013 interviewed a representative sample of residents and suggests a bigger informal sector in the region, however.30 Twenty-two percent of respondents who were
employed worked in the informal sector and 27% of respondent households received some income from the informal sector. The main difficulty with employment figures, of course, is that they inevitably include both business owners and employees. The actual number of enterprises is more difficult to gauge, especially as business failure is high and turnover common.31 A
55% of those operating in 2007 had failed by 2010.32 In 2004, the Bureau for
Market Research estimated that there were 748,700 informal outlets in the country including 261,000 hawkers, 127,600 spaza shops, 40,100 shebeens and 320,000 other types of businesses.33
Informal retailing has been the major focus of economic research on dif-ferent sub-sectors of the informal economy in both Johannesburg and Cape Town.34 Particularly common are small-area case studies of survivalist street
trading (particularly of food and handicrafts) in the inner city.35 The spaza
shop sector in low-income residential areas has also been increasingly stud-ied.36 Other informal entrepreneurial activities that have attracted
atten-tion in Cape Town and Johannesburg include the minibus taxi industry,37
waste collection and recycling,38 shebeen operation,39 trade in medicinal
plants,40 poverty tourism41 and informal construction activity.42
Meth-odologically, an interesting approach to understanding the complexity and dynamics of informal retail has been the use of GIS to map the spatial dis-tribution of informal retail outlets and to relate this to other urban features such as the transportation infrastructure and the location of competitor formal retailers.43
As well as documenting the economic challenges of informality, the lit-erature on Cape Town and Johannesburg raises two other important issues, both of which have a bearing on the environment for entrepreneurship. The first is the relationship between formal and informal retail. The linkages between formal and informal enterprise are often overlooked in the conven-tional dualistic model that undergirds much analysis of a funcconven-tionally and spatially bounded informal sector.44 With regard to the issue of economic
competition, the central research question is whether the rapid expansion of malls and supermarkets across the South African urban landscape, and their recent penetration of low-income areas, is having a negative impact on the informal economy.45 One study, for example, has argued that “one
of the primary threats is the encroachment of supermarkets into areas tra-ditionally occupied by the informal market. There is, for example, strong evidence that the informal sector is losing significant market share as a result of the encroachment of supermarkets into the territories occupied by the informal sector.”46 The study reports that between 2003 and 2005, spaza
shop turnover in some areas was reduced by as much as 22% as a result. In contrast, a study of Tshwane argues that supermarkets have had a major impact on corner stores and greengrocers but that informal vendors are far more resilient.47
Studies in Soweto have found that the impact varies with the type of informal business: although spazas and general dealers were negatively affected by the advent of malls, street traders were not.48 In nearby
Ekurhu-leni, however, formal retail dominates the informal food economy because the latter’s collective buying power is not being used in the same way as
large formal retailers of fruit and vegetables to obtain better terms of trade with suppliers.49 The African Food Security Urban Network (AFSUN) data
for Cape Town and Johannesburg shows that the majority of poor urban households source food from both supermarkets (for staples in bulk on a monthly basis) and informal vendors (for street food and fresh produce several times a week).50 The possibility of corporate social responsibility
pro-grammes being directed to supporting informal entrepreneurs has recently been mooted. One study concludes that “business development support has a positive effect on lifting income and reducing poverty for microenterprise owners.”51
Formalization of informal businesses is the other issue that has become increasingly important in South Africa. This has been given greater profile in part due to the ILO’s 2014-15 standard-setting process on “Formalizing the Informal Economy.” For reasons including greater legal control, collec-tion of taxes and registracollec-tion fees, enforcement of labour legislacollec-tion and identification and deportation of irregular migrants running businesses, the central, provincial and local South African authorities would all like to see the informal economy subject to formal rules and regulations. Many researchers see formalization as good for informal business since it would promote access to private finance and state-funded training programmes.52
Chen does caution that “it is important to ensure that formalization offers the benefits and protections that come with being formal and does not sim-ply impose the costs of becoming formal.” She also notes that formalization has different meanings and implications for different categories of informal workers.53 In South Africa, the drive towards formalization has progressed
furthest in the taxi industry but many sectors of the informal economy remain outside the formal regulatory fold. Most informal entrepreneurs are opposed to formalization, stressing the financial costs and constraints on business flexibility. Attempts by the state to promote formalization in the liq-uor sector have led, perhaps counterintuitively, to greater informalization.54
The Zimbabwean experience raises important questions about the links between the collapse of the formal economy and the growth of informality.55
At independence in 1980, Zimbabwe’s urban informal economy was small, absorbing about 10% of the labour force. By 2003, it accounted for over 70% of the labour force and its contribution to GNI had grown to around 60% – one of the highest in Sub-Saharan Africa.56 In Harare, the informal
economy rapidly expanded even as the formal economy shrank and rates of unemployment soared above 80%.57 In 2011, a ZimStat survey found that
84% of the workforce were in informal employment. The largest number were in retail and wholesale trade followed by repair of motor vehicles and cycles, services and manufacturing. Women constituted 53% of those in informal employment.58 There have been few studies (in Zimbabwe and
Yet, as Dube points out, under conditions of economic crisis and state fail-ure there are “many business opportunities that may arise and being tied to an employer in the formal sector may preclude an entrepreneurial worker’s participation in more lucrative income generating activities in the informal sector.”59
There are strong indications that the collapse of the Zimbabwean econ-omy actually impacted positively on the entrepreneurial motivations and skills of ordinary Zimbabweans.60 One case study has suggested that after
2004 there was a major shift within the informal economy from household informal employment towards small enterprise development and employ-ment.61 At the very least this points to the informal economy not as a site
of desperation and last resort but a space of energy and innovation. As Dube concludes, “instead of treating the informal sector as an undifferentiated residual sector, there is a need for studies on informality in Zimbabwe that disaggregate this sector by sub-sector of activities and by locales – examin-ing differences in activities, barriers to entry/exit and employment relation-ships in the various sub-sectors and/or locales.”62
Mozambique, and Maputo in particular, represent a different context within which to explore the links between informal entrepreneurship and formal economic growth. The Mozambican economy was virtually destroyed by the civil war in the 1980s and the informal economy was how the vast majority of urban residents managed to survive.63 In the last two decades,
however, Mozambique has had one of the fastest growing formal economies in Africa. Yet, the informal economy has proven to be extremely resilient. The Ministry of Planning and Development, for example, estimated that informal activity represented 41% of GDP in 2003 and 40% in 2004.64 A
2005 national sample survey concluded that 75% of the economically active population was employed informally in Mozambique. Another survey of Maputo found that 70% of households were involved in informal economic activities and 64% of jobs were estimated to be in the informal economy. The involvement was significantly higher in female-headed households (86%) than male-headed households (62%).65
Although research on the informal economy in Maputo is not as exten-sive as in Harare or South African cities such as Johannesburg, a number of studies have highlighted the dynamism and heterogeneity of the sector and the role of informal entrepreneurship in poverty reduction.66 The most
common type of informal economic activity is the sale of products such as foodstuffs and petty commodities. Many are also involved in desenrascar (“finding a way out”), which involves everything from small-scale repairs to sex work and theft. The most profitable activities are hairdressing, the sale of second-hand clothes and traditional medicine. Other common informal activities include the sale of water, production of building material and fur-niture, garbage picking, selling cell-phone airtime and the sale of charcoal and home-made brews.67
i
nternationalm
iGration ins
outherna
friCaT
he end of apartheid brought a major reconfiguration of international migration flows in Southern Africa.68 Legal entries through SouthAfrican land border posts and airports rose from less than 1 million in 1990 to 6 million in 2000, and 15 million in 2014.69 These entrants (totalling
nearly 130 million from 2000 to 2013) include tourists, visitors, migrant workers, immigrants, students, medical travellers, shoppers, investors, con-ference delegates, diplomats, asylum-seekers and informal traders. Among the entrants are those who give one purpose for entry (for example, holi-day) and then engage in other activities, such as working in the informal economy. The vast majority of those who enter do so on a temporary basis, although there is some discrepancy in official statistics between arrivals and departures each year (Figure 4). The departure figures are likely to be a seri-ous underestimate as exits are not tracked as conscientiseri-ously as entries.70
This clearly shows the problems associated with the exit data. At the Zim-babwean border, for example, busloads of passengers are often simply waved through by South African immigration officials.71 However, arrivals data
also includes many non-visitors.
Figure 4: South African Arrivals and Departures, 2000-2013
Source: Statistics South Africa72
Data collected by Statistics South Africa on foreign arrivals is split into two categories: non-visitors (e.g. temporary or permanent migrants, labour migrants, asylum seekers, students) and visitors (same-day visitors and tour-ists). Of the 15,154,991 people who visited South Africa in 2013, 837,083
0 2,000,000 4,000,000 6,000,000 8,000,000 10,000,000 12,000,000 14,000,000 16,000,000 Departures Arrivals 2000 2001 2002 2003 2004 2005 2006 2007 2008 2009 2010 201 1 2012 2013
(5.5%) were non-visitors while 14,317,908 (94.5%) were visitors (Table 1). The visitors were made up of 4,781,340 same-day visitors and 9,536,568 overnight visitors or tourists. The vast majority of the same-day visitors (98%) came by road from neighbouring SADC countries and 69% of the tourists also came from SADC countries, including Zimbabwe (20.3% of the total number of tourists), Lesotho (15.3%), Mozambique (11.7%), Swa-ziland (8.8%) and Botswana (5.6%).
Table 1: Region of Origin of Visitors to South Africa, 2013
Number Percentage Non-visitors 837,083 5.5 Visitors 14,317,908 94.5 Same day Overseas 222,128 1.5 SADC 4,542,149 30.0 Other Africa 13,906 0.1 Unspecified 3,157 0.0 Total 4,781,340 31.5 Tourist Overseas 2,660,631 17.6 SADC 6,618,866 43.7 Other Africa 237,186 1.6 Unspecified 19,885 0.1 Total 9,536,568 62.9 Total 15,154,991 100.0 Source: Statistics South Africa73
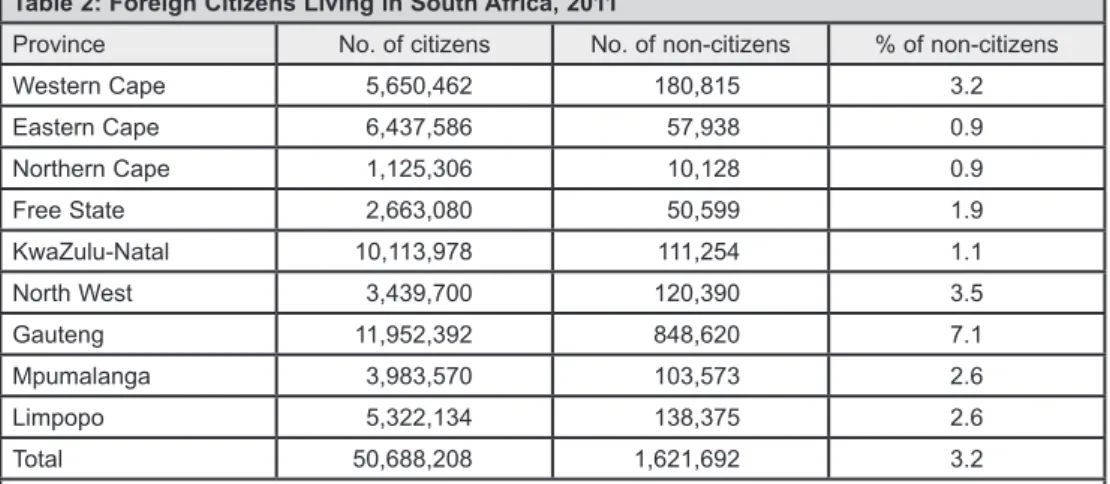
The precise numbers of international migrants living in South Africa are unknown, although the 2011 South African Census provides the best cur-rent set of estimates. The Census recorded a total of 1.6 million non-citizens in the country, half of whom were in the province of Gauteng (Table 2).
Table 2: Foreign Citizens Living in South Africa, 2011
Province No. of citizens No. of non-citizens % of non-citizens Western Cape 5,650,462 180,815 3.2 Eastern Cape 6,437,586 57,938 0.9 Northern Cape 1,125,306 10,128 0.9 Free State 2,663,080 50,599 1.9 KwaZulu-Natal 10,113,978 111,254 1.1 North West 3,439,700 120,390 3.5 Gauteng 11,952,392 848,620 7.1 Mpumalanga 3,983,570 103,573 2.6 Limpopo 5,322,134 138,375 2.6 Total 50,688,208 1,621,692 3.2 Source: Statistics South Africa74
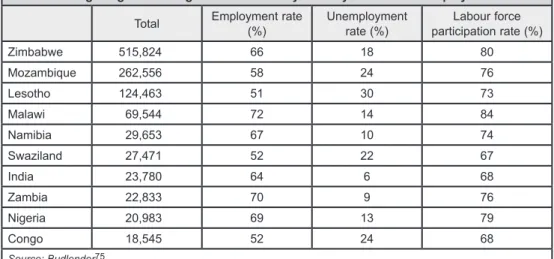
The South African migrant stock (those born outside the country) was dominated by Zimbabweans (a total of 515,000 adults between the ages of 15 and 64) (Table 3). Other countries with 70,000 migrants or more in South Africa include Mozambique, Lesotho and Malawi. The only non-African country in the top 10 is India (at 24,000). Many migrant entrepreneurs in South Africa entered the country as asylum-seekers and later obtained refugee status. The number of asylum applications rose dramatically from around 16,000 in 1996 to a peak of about 220,000 in 2009, primarily as a result of claims submitted by Zimbabweans (Figure 5).
Table 3: Foreign Migrants Living in South Africa by Country of Birth and Employment Status Total Employment rate (%) Unemployment rate (%) participation rate (%)Labour force Zimbabwe 515,824 66 18 80 Mozambique 262,556 58 24 76 Lesotho 124,463 51 30 73 Malawi 69,544 72 14 84 Namibia 29,653 67 10 74 Swaziland 27,471 52 22 67 India 23,780 64 6 68 Zambia 22,833 70 9 76 Nigeria 20,983 69 13 79 Congo 18,545 52 24 68 Source: Budlender75
Figure 5: Applications for Refugee Status in South Africa, 1996-2012
Source: UNHCR Statistical Yearbook (Various Reports) 1996 0 50,000 100,000 150,000 200,000 250,000 1997 1998 1999 2000 2001 2002 2003 2004 2005 2006 2007 2008 2009 2010 2011 2012 No. of new applica tions
Migration to South Africa has been the dominant form of movement from post-colonial Zimbabwe, especially for the semi-skilled and unskilled.76
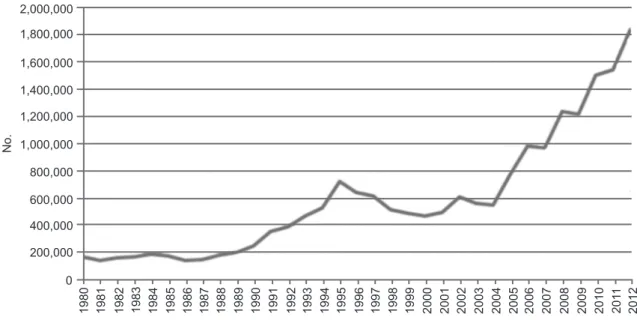
Movement from Zimbabwe to South Africa has grown rapidly in recent dec-ades (Figure 6). The number of Zimbabweans entering South Africa legally and temporarily for various reasons rose from 255,988 in 1990 to 477,380 in 2000 and to 1,847,973 in 2012. In 2012, the majority of Zimbabweans (97%) indicated holiday as their purpose of entry while other categories included transit (1.5%), business (1%) and study (0.6 %). Many “holiday makers” from Zimbabwe are known to engage in a wide variety of income-generating activities in South Africa, particularly informal trade.
Figure 6: Legal Entries of Zimbabweans into South Africa, 1980-2012
Source: Statistics South Africa, Various reports
In 2001, the South African Census recorded 130,090 Zimbabwe-born people in the country (a figure that included 54,294 whites who had left Zimbabwe after independence in 1980). Only a decade later, the 2011 Census counted a total of 515,824 Zimbabweans aged between 15 and 64 in South Africa.77 This increase occurred despite a major campaign to deport
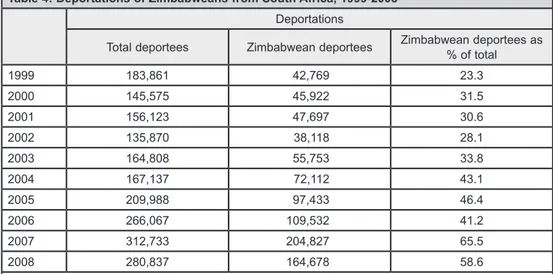
Zimbabweans, which saw the number of deportees rise from 43,000 in 1999 (or 23% of total deportations) to 205,000 in 2007 (or two-thirds of the total) (Table 4). In total, between 2000 and 2008, nearly 600,000 Zimba-bweans were deported from South Africa.
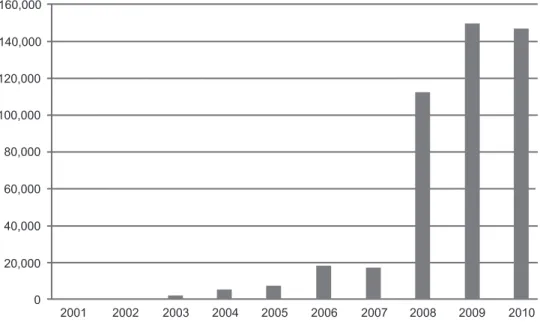
Zimbabwean migrants responded to the mass deportations by applying in large numbers for refugee status in South Africa, which would protect them from deportation. The number of refugee claimants rose from just four in 2001 to 149,453 in 2009 (Figure 7). Holders of renewable asylum-seeker
1980 1981 1982 1983 1984 1985 1986 1987 1988 1989 1990 1991 1992 1993 1994 1995 1996 1997 1998 1999 2000 2001 2002 2003 2004 2005 2006 2007 2008 2009 2010 201 1 2012 0 2,000,000 1,800,000 1,600,000 1,400,000 1,200,000 1,000,000 800,000 600,000 400,000 200,000 No.
permits were allowed to remain legally in South Africa until their claims were adjudicated. The mounting pressures on the refugee determination system and the costly failure of the deportation campaign led the South African government to introduce a moratorium on deportations that lasted from 2009 to 2012. It also implemented an “immigration amnesty” for Zim-babweans in 2010.78 By the time the amnesty ended in mid-2011, a total
of 242,371 Zimbabweans had been granted four-year residence permits in South Africa. In August 2014, the South African government introduced a new programme extending these permits by a further three years.
Table 4: Deportations of Zimbabweans from South Africa, 1999-2008 Deportations
Total deportees Zimbabwean deportees Zimbabwean deportees as % of total 1999 183,861 42,769 23.3 2000 145,575 45,922 31.5 2001 156,123 47,697 30.6 2002 135,870 38,118 28.1 2003 164,808 55,753 33.8 2004 167,137 72,112 43.1 2005 209,988 97,433 46.4 2006 266,067 109,532 41.2 2007 312,733 204,827 65.5 2008 280,837 164,678 58.6 Source: Department of Home Affairs (South Africa) Annual Reports
A 2010 SAMP survey of working-age Zimbabweans in two South Afri-can cities (Cape Town and Johannesburg) prior to the amnesty found that 52% held asylum-seeker permits, 19% held work permits and only 2% had acquired permanent residence.79 Until recently, most migrants from
Zim-babwe engaged in circular migration, spending only short periods in South Africa, returning home frequently and showing little inclination to remain in South Africa. The 2010 SAMP survey was limited to migrants who had gone to South Africa for the first time between 2005 and 2010 and painted a very different picture. South Africa is increasingly seen as a longer-term destination rather than a temporary place to earn quick money. Nearly half of the respondents said that they wanted to remain in South Africa “for a few years” and another 21% that they wanted to remain indefinitely or permanently. In other words, two-thirds of recent migrants viewed a long-term stay in South Africa as desirable and many are bringing their families with them.
Figure 7: Asylum Applications by Zimbabweans in South Africa, 2001-2010
Source: UNHCR Statistical Online Population Database
Post-apartheid migration patterns between Mozambique and South Africa have a rather different history. The dominant form of movement between the two countries for most of the twentieth century was contract migration to the South African mines, predominantly from rural areas of Mozambique.80 In the 1980s, however, the civil war in Mozambique led
to a major influx of asylum-seekers, estimated to be anywhere between 300,000 and 400,000 people. Most settled along the border between the two countries and were integrated into local communities and worked on local farms.81 Those who migrated to the cities tended to work in the informal
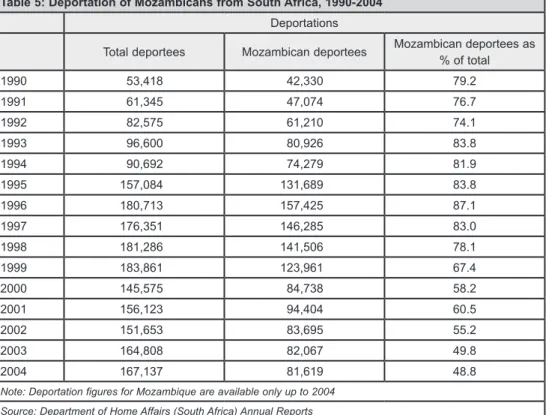
economy although many were arrested and deported, with the number of deportations peaking at 156,000 in 1996 (Table 5). In 2000, an immigra-tion amnesty gave South African residency status to an estimated 110,000 former refugees and the number of deportations immediately fell by 50%.82
After 2004, and the abandonment of visa restrictions on Mozambicans, cross-border traffic increased from around 400,000 documented entries per annum to nearly 1.8 million in 2013 (Figure 8). As with Zimbabweans, the Mozambicans comprised a wide variety of migrants with different reasons for entry. And as with Zimbabweans, many of the migrants overstayed as “undocumented migrants” where they did menial jobs and worked in the informal economy.83 However, one of the primary motivators was
cross-border informal trade between Maputo and South African cross-border towns as well as cities such as Johannesburg.
2001 2002 2003 2004 2005 2006 2007 2008 2009 2010 0 20,000 40,000 60,000 80,000 100,000 120,000 140,000 160,000
Table 5: Deportation of Mozambicans from South Africa, 1990-2004 Deportations
Total deportees Mozambican deportees Mozambican deportees as % of total 1990 53,418 42,330 79.2 1991 61,345 47,074 76.7 1992 82,575 61,210 74.1 1993 96,600 80,926 83.8 1994 90,692 74,279 81.9 1995 157,084 131,689 83.8 1996 180,713 157,425 87.1 1997 176,351 146,285 83.0 1998 181,286 141,506 78.1 1999 183,861 123,961 67.4 2000 145,575 84,738 58.2 2001 156,123 94,404 60.5 2002 151,653 83,695 55.2 2003 164,808 82,067 49.8 2004 167,137 81,619 48.8 Note: Deportation figures for Mozambique are available only up to 2004
Source: Department of Home Affairs (South Africa) Annual Reports
Figure 8: Legal Entries of Mozambicans into South Africa, 1999-2013
Source: Statistics South Africa, Various Reports
1999 No. 2000 2001 2002 2003 2004 2005 2006 2007 2008 2009 2010 201 1 2012 2013 0 200,000 400,000 600,000 800,000 1,000,000 1,200,000 1,400,000 1,600,000 1,800,000 2,000,000
m
iGrants and thei
nformale
ConomyM
obility is essential to the operation and dynamism of the urban infor-mal economy in Southern African cities. Within urban areas, mobility is a vital component of the business strategies of informal operatives who identify spaces with niche markets or a relative absence of the formal sector. While some businesses operate from fixed sites others are extremely mobile, operating in different parts of the city on different days or at different times of a single day. Many of the participants in the informal economy are inter-nal or internatiointer-nal migrants, often in competition with one another for the same market share. Although the numbers of international migrants are frequently exaggerated, it is clear that they have played an increasingly important role in the informal economies of Southern African cities over the last two decades and have reshaped the nature of informality and infor-mal entrepreneurship in the region. Yet the importance of that role is often underestimated, invisible to researchers and denigrated by policy-makers.84The emerging literature on migrant entrepreneurship in South Africa focuses on several issues:
-neurs;85
86
capital, cost-saving strategies such as shared shop spaces, revenue-boosting strategies such as bulk buying, and material support such as accommodation for newly-arrived migrants;87 and
In the 1990s and early 2000s, most migrant entrepreneurs settled in Johannesburg or Cape Town.88 These two cities continue to be the major
sites of informal migrant enterprise. However, one of the distinctive spatial features of migrant entrepreneurship is its diffusion throughout the country and down the urban hierarchy to many intermediate and smaller cities. A growing number of recent studies attest to the increase in business activity of migrant entrepreneurs in other South African urban centres.89 This is a
response to the fact that the policing of informality and immigration is more relaxed in smaller centres, as well as being a search for new markets.
According to census data, rates of unemployment amongst migrants in South Africa are generally lower than amongst South Africans, varying from a low of 6% in the case of Indian migrants to a high of 30% in the case of migrants from Lesotho. Only 18% of Zimbabwean and 24% of Mozam-bican migrants were unemployed in 2011 (Table 3). Many of those formally recorded as unemployed are, in fact, working in the informal economy.90
A 2010 SAMP survey of post-2005 Zimbabwean migrants in Johannesburg and Cape Town, for example, found that 20% were involved in the
infor-mal economy.91 Studies of other migrant groups such as Somalis suggest
even higher rates of informal economy participation.92 Asylum seekers and
refugees from various countries are largely excluded from the formal labour market and show high levels of enterprise and innovation in the informal economy.93
The Bureau of Market Research estimated that 80% of 4,584 informal traders in inner-city Johannesburg in 2004 were non-South Africans, with 30% Nigerians, 30% Ethiopians and Somalis and 20% a mixture of Rwan-dans, Congolese and Zimbabweans.94 A recent analysis of the 2012 South
African Quarterly Labour Force Survey (Q3) showed clear differences between South Africans and international migrants.95 For example, 21% of
international migrants were classified as self-employed compared with 7% of internal migrants and 9% of non-migrants. However, only 13% of the total number of self-employed were international migrants compared with 15% of internal migrants and 71% of non-migrants. These differences were amplified in data by sector. As many as 33% of international migrants were in the informal sector, compared with 11% of internal migrants and 16% of non-migrants. Again, the absolute number of international migrants was much smaller, at 12% of the total compared with 14% of internal migrants and 74% of non-migrants. There is also evidence of a growing diversifica-tion of migrant source countries. Most migrants are still from neighbouring countries but there are growing numbers from many other African countries as well as farther afield, including Bangladesh, Pakistan and China.96
Migrants are often more entrepreneurial than most, yet the constraints they face in establishing and growing their businesses are considerable. Their general contribution to employment creation and inclusive growth is undervalued and often misrepresented as a threat. Foreign migrants in the South African informal economy do have considerable entrepreneurial ambition but are severely hampered in growing their enterprises by a range of obstacles.97 These have not been systematically researched but include:
and conditions of entry and the ability to move along migration corridors between countries;
-cial and support services;
deportation disrupting business activity; refused bank accounts and loans); sector; and
Violent attacks on the persons and properties of migrant business operations – whether motivated by rivalry, criminality or xenophobia or a combination of these – are regular and frequent and involve considerable loss of life. The nature and challenges posed by violence against migrant entrepreneurs are considered in detail in two companion SAMP reports.99
In terms of economic challenges confronting informal-sector entrepre-neurs, both South African and migrant, a major issue is the lack of access to financial services including start-up capital and ongoing credit. Formal financial institutions are extremely reluctant to do business with migrant informal entrepreneurs. These entrepreneurs “have limited access to debt finance from commercial banks as they have problems in opening bank accounts, and acquiring visas and permits. In addition, most…have never applied for credit, despite the need for credit and may thus be classified as discouraged borrowers.”100 Fatoki’s study of 148 migrant entrepreneurs in
inner-city Johannesburg found that 29% had applied for credit and another 43% who were in need of credit had not. Of those who applied, only a third were successful.101 Tengeh’s study of 135 migrant entrepreneurs in
Cape Town found that only 10% had obtained a bank loan to start their businesses.102 Khosa’s recent study of 93 Cape Town entrepreneurs from 19
African countries found that only 9% had acquired a bank loan as start-up capital compared with 37% who had used personal funds and 36% who had relied on family and friends.103 As a result of the lack of credit, many
migrant entrepreneurs rely on various financial bootstrapping alternatives to minimize their capital outlay and running costs (Table 6).
Despite these financial challenges, there is evidence of upward mobility of migrant-owned businesses in terms of the growth of business capital. In one study, the majority of African immigrant entrepreneurs in Cape Town (71%) had initial start-up business capital in the ZAR1,000 to ZAR5,000 range. After three or more years of operation the financial capital of nearly 40% had grown to an estimated range of ZAR50,000 to ZAR100,000.105
This was a notable achievement in an environment where the rate of new-business failure is estimated at between 70% and 80%.106 Immigrant
entre-preneurs in South Africa, for instance, have long working hours, resulting in increased gross earnings.107 Through risk-taking and heavy investment
in their businesses, some entrepreneurs have been able to increase the size of their operations and have even managed to turn them into formal busi-nesses.108 Many use mobile phones and other technology that allows for
increased interaction with suppliers and customers while reducing the need to travel.109 Some also make use of social media, for instance, advertising
their services on Facebook. However, a large number still lack access to computers, and records continue to be kept manually.110 It has been
sug-gested that the success of some immigrant-owned businesses in South Africa is largely due to immigrant entrepreneurs’ superior qualifications. One study
in Cape Town, for example, showed that at least 30% had completed tertiary education.111 Empirically, it has been demonstrated that learning
contrib-utes to higher levels of earnings by providing a solid basis for the develop-ment of an entrepreneurial culture.112
Table 6: Financial Bootstrapping by Migrant Entrepreneurs in Inner-City Johannesburg No. % Share premises with others 141 95 Delay owner’s/manager’s salary 136 92 Obtain loans from family and friends 123 83 Employ relatives and/or friends at non-market salary 115 78 Seek out best conditions possible with suppliers 113 76 Buy on consignment from suppliers 108 73 Contribute capital via other projects that pay the owner 101 68 Offer customers discounts for cash payments 86 58 Get payments in advance from customers 80 54 Use manager’s private credit card for business expenses 77 52 Buy used rather than new equipment 77 52 Deliberately delay payments to suppliers 76 51 Deliberately choose customers who pay quickly 73 49 End a business relationship with a frequently-late-paying customer 72 48 Use different routines for minimizing capital invested in stock 65 44 Use routines to speed up invoicing 62 42 Coordinate purchases with other businesses (for better agreements) 61 41 Borrow equipment or machinery from other businesses 56 38 Hire staff for short periods instead of employing permanently 56 38 Share equipment with other businesses 37 25 Give the same terms of payment to all customers 16 11 Source: Fatoki104
Proponents of the idea of “brain waste” argue that the educational qualifications of migrants are devalued and wasted if they cannot obtain suitable employment in the formal economy. This may well be the case when migrants are unable to obtain jobs that are commensurate with their levels of education and training. However, the brain-waste thesis also sug-gests that working in the informal economy is the ultimate form of wast-age, “where educated immigrants find employment in the informal sector, which is typically characterised by low worker productivity, poor working conditions, low or non-existent worker protection and uncertain job pros-pects.”113 While this is not necessarily incorrect regarding employment