Developing an Individualized Survival
Prediction Model for Colon Cancer
Ana Silva1, Tiago Oliveira1, Paulo Novais1, Jos´e Neves1, Pedro Le˜ao21
Algoritmi Centre/Department of Informatics, University of Minho, Braga, Portugal
{toliveira,pjon,jneves}@di.uminho.pt
2
ICVS/3B’s - PT Government Associate Laboratory, Braga/Guimar˜aes, Portugal
Abstract. In this work a 5-year survival prediction model was devel-oped for colon cancer using machine learning methods. The model was based on the SEER dataset which, after preprocessing, consisted of 38,592 records of colon cancer patients. A total of 6 features were obtained from the feature selection phase. They were used to develop a prediction model based on a Stacking classification scheme. This model was compared with another one using the same classification scheme, but with 18 features indicated by an expert physician. Results show that the performance of the model using fewer features is close to that of the model using more, which indicates that the first may be a good compromise between usability and performance.
1
Introduction
Colorectal cancer or bowel cancer is a pathology that affects the lower portion of the gastrointestinal tract. It develops in the cells lining the colon and rectum when they suffer mutations causing their uncontrollable growth [22]. They be-gin to invade healthy tissues, yielding malignant tumors and may also spread to other parts of the body by entering the bloodstream or the lymphatic system. This is the most common cancer of the digestive system and the third most frequent worldwide with an incidence of 9.7%, and the fourth most lethal with a mortality rate of 6.41% [9]. Risk factors for the development of colon cancer include age over 50 years old, a personal or family history of colorectal cancer, in-herited gene mutations known to be associated with polyp development, among others. About 70% of all colorectal cancers are colon cancers, and the remaining 30% are cases of rectal cancer [2]. Although colon and rectal cancers are con-sidered to be very similar pathologies, the truth is they appear in anatomically different regions, they may be associated with different genetic causes, and may progress differently according to distinct molecular pathways and interactions, thus requiring different treatments [25]. For this reason, the prognosis for pa-tients with these pathologies may also differ significantly. The work disclosed herein focuses solely on colon cancer which may develop in the cecum, ascending colon, transverse colon, descending colon, and sigmoid.
Surgical resection is the primary treatment modality for early stages of colon cancer. The accurate prediction of survival is important for patients with cancer so that they can make the most out of the rest of their lives. It is also impor-tant to help clinicians to make the best decisions for patients and it is essential for palliative care. The level of experience of a physician in estimating survival might affect how prognosis is formulated, but even experienced oncologists find it difficult to predict survivability. Therefore, the objectives of this work are the following: i) to make an individualized prediction of the survivability of a colon cancer patient in each year of the five years following treatment; ii) to deter-mine the ideal number of features necessary for an accurate prediction; and iii) to determine which features are the most important for survival prediction of colon cancer patients. The number of features is important in order to make the prediction model available in a clinical decision support application, which is the end goal of the work. If a physician has to provide too many inputs, thus making the task of using the application difficult and time-consuming, he may lose interest and not use the tool at all. The prediction model was developed using data from the Surveillance, Epidemiology, and End Results (SEER) pro-gram [15], a large cancer registry in the United States, and arguably the most complete cancer database in the world. The dataset includes records of patients diagnosed with different types of cancer from 1973 to 2012, featuring a total of 8,689,771 cases. After the extraction of data of colon cancer patients in several pre-processing steps, different machine learning strategies were applied in order to produce a survival prediction model in the form of several classifiers.
This paper is structured as follows. Section 2 mentions and provides insight into previous works in colon cancer survival prediction, with a particular focus on the differences between those approaches and the one followed in this work. Section 3 explains the prediction system under development with the specifica-tion of the type of inputs it should receive and the outputs it should produce. It also describes the steps and machine learning methods used to develop the prediction model. The corresponding experimental results are disclosed and dis-cussed in Section 4. Finally, Section 5 provides concluding remarks about the work done so far and future work considerations.
2
Related Work
Most of the existing approaches for colon cancer survival prediction are based on the SEER data. An example is the web-based calculator3developed in [5] whose
underlying prediction model is the Nodes + Prognostic Factors (NAP), based on the number of positive lymphatic nodes combined with other prognostic features. The model has an underlying biological motivation, reflected in the use of the probability of a cancerous cell invading healthy tissues to formulate equations for cancer lethality, combined with other prognostic features estimated by means
3
Application available at http://www.lifemath.net/cancer/coloncancer/ outcome/index.php.
of simulation of several statistical tests. The model requires inputs for 9 features and provides a prediction of the mortality risk over the period of 15 years.
Another SEER-based approach is the one followed in [6], also made available in the form of a web application4. The prediction model has 5 input features,
derived through a Cox regression analysis to evaluate simultaneous effects of multiple variables on survival. This resulted in adjusted survival functions strat-ified by 5 features. The conditional survival probabilities for a period of 10 years produced by the model are calculated on the basis of the adjusted survival func-tions for the features, controlled for the influence of other covariates in the final model.
A similar approach was followed in [23], in which a survival prediction model for a period of 5 years was developed based on multi-variable regression, with Cox proportional hazards modelling, using 7 prognostic features 5. All the fea-tures were chosen a priori, on the basis of their well established independent association with overall survival and their availability in the SEER data.
In [21] an artificial neural network model and a regression-based model were developed to predict patient survival status 5 years after treatment. The models have 12 input features and were based on data from the National Cancer Data Base (NCDB), a cancer registry in the United Kingdom. This work had a strong machine learning component and is among the first to apply methods from this field of computer science to colon cancer survival prediction. Another example is the work in [1], in which a 5-year survival prediction model was developed using ensemble machine learning with supervised classification. The number of selected features for prediction in this work was 13 and the resulting model achieved an overall high performance in terms of precision, accuracy, and receiver operating characteristic (ROC).
The work developed herein distances itself from the works in [5, 6, 23] by treating survival prediction as a classification problem and applying varied ma-chine learning methods to obtain a model capable of individualized survival prediction. In this regard, it is influenced by the methodology followed in [1], whose work will serve as a reference for direct comparison. At the same time, this work aims to produce 5-year survival predictions using fewer features than the existing approaches, which may be the deciding factor for the adoption of a clinical decision support application.
3
Development of the Prediction Model
The survival prediction system for colon cancer should be able to accept a num-ber of inputs for selected prediction features and, for each of the 5 years following treatment, produce an output stating whether the patient in question will sur-vive that year or not, along with a confidence value for the prediction. The development of a prediction model capable of this required several phases, from
4Application available athttp://www3.mdanderson.org/coloncalculator. 5
Application available at http://nomograms.mskcc.org/Colorectal/ OverallSurvivalProbability.aspx
the preprocessing of SEER data to the selection of the best model. All of them are depicted in the workflow of Figure 1 and each one is described in the ensuing sections.
The software chosen to develop the prediction model was RapidMiner6, an open source data mining software. It is important to clarify that, given that survival prediction was handled as a classification problem, five classification models for each year were developed. Theses models were posteriorly combined, in a programmatic manner, into a model capable of providing a prediction for each year with a single interaction.
Fig. 1.Workflow for the development of the prediction model.
3.1 Preprocessing, Split Dataset, and Balancing Data
In order to load the data provided by SEER to RapidMiner, the data in raw format had to be converted into csv format, through a developed script. The colorectal cancer data from SEER contained 515,791 records and consisted of 146 attributes, some of them only applicable to a limited period within the time of data collection. The data was reduced to 38,592 records after the preprocessing phase and selecting the colon cancer patients.
During the Preprocessing phase, it was defined that the period of interest would be from 2004 onwards in order to minimize the occurrence of missing data due to the applicability of the attributes. Additionally, empty attributes, attributes that are not applicable to this type of cancer (e.g., the human epider-mal growth factor receptor 2 result is an indicator used in breast cancer only[24]) and attributes that are not directly related with the vital status of the patient were removed (e.g. the number identifying the registry of the patient). Only the adult patients (age greater than or equal to 18 years old) were selected for fur-ther processing and the missing values were replaced with the unknown code. Patients who had a survival time inferior to 60 months (5 years), the maximum period for which the model under development is supposed to predict survival, and those who passed away of causes other than colon cancer were sampled out from the training set as their inclusion was considered to be unsuited to the problem at hand. The numeric attributes were converted to nominal (e.g. sex) and the binary classes (survived and not survived) were derived for the target labels 1-, 2-, 3-, 4- and 5-year survival. Finally, based on existing attributes, new
6
ones, such as the number of regional lymph negative nodes, the ratio of positive nodes over the total examined nodes and also the relapse of the patients for colon cancer, were calculated. After the Preprocessing, the attributes were reduced to 61, including the new attributes and the target labels.
In the Split Dataset phase, the data was divided into five sub-datasets, split by target label, according to the corresponding survival year. Table 1 shows the class distribution in each sub-dataset.
Table 1.Class distribution for each target label in the sub-datasets. Target Labels
1 Year 2 Year 3 Year 4 Year 5 Year Not Survived 24.51% 32.60% 36.96% 39.35% 41.07% Survived 75.49% 67.40% 63.04% 60.65% 58.93%
As observed in Table 1 the classes are not equally represented. Several studies [7, 14] show how important the problem of using imbalanced datasets is, from both the algorithmic and performance perspectives. An overview of classification algorithms for the resolution of this kind of problem [11] concluded that hybrid sampling techniques, i.e., combining over-sampling of the minority class with under-sampling of the majority class, can perform better than just oversampling or undersampling. As such, in the Balancing Data phase, hybrid sampling, as described in [11], was applied in order to generate balanced sub-datasets with 38,592 records each.
3.2 Feature Selection
The Feature Selection phase was crucial to determine the most influential fea-tures on the survival of colon cancer patients. In order to accomplish this the Optimize Selection operator [19] of RapidMiner was used. It implements a deter-ministic and optimized selection process with decision trees and forward selec-tion. The process was applied to each sub-dataset for the target label. Only the features in common to all the sub-datasets were selected and used to construct the prediction models. Table 2 shows the selected features and their meaning.
The 6 selected features were compared with a set of 18 features (shown in Table 3) indicated by a specialist physician on colorectal cancer. These two sets of features were mapped to attributes in the sub-datasets and later used to generate and evaluate the prediction models.
3.3 Modeling and Evaluation
The classification strategies used in the Modeling phase consisted mostly of ensemble methods. The classification schemes applied were meta-classifiers. This type of classifier is used to boost basic classifiers and improve their performance.
Table 2.Attributes selected in the Feature Selection process. Attribute Description
Age recode with<1 year olds
Age groupings based on age at diagnosis (single-year ages) of patients (<1 year, 1-4 years, 5-9 years, ..., 85+ years)
CS Site-Specific Factor 1 The interpretation of the highest Carcinoembryonic Antigen (CEA)7 test results
CS Site-Specific Factor 2 The clinical assessment of regional lymph nodes Derived AJCC Stage Group The grouping of the TNM information combined Primary Site Identification of the site in which the primary tumor
originated
Regional Nodes Examined The total number of regional lymph nodes that were removed and examined by the pathologist
Table 3.Attributes selected by a specialist physician on colorectal cancer.
Attribute Description
Age at Diagnosis The age of the patient at diagnosis CS Extension Extension of the tumor
CS Site-Specific Factor 8 The perineural Invasion CS Tumor Size The size of the tumor
Derived AJCC T, N and M The AJCC T, N and M stage (6th ed.) Grade Grading and differentiation codes
Histologic Type The microscopic composition of cells and/or tissue for a specific primary
Laterality The side of a paired organ or side of the body on which the reportable tumor originated
Primary Site *
Race Recode (White, Black, Other) Race recode based on the race variables Regional Nodes Examined *
Regional Nodes Positive
The exact number of regional lymph nodes examined by the pathologist that were found to contain metastases
Regional Nodes Negative (Regional nodes examined - Regional nodes positive)
Regional Nodes Ratio (Regional nodes negative over Regional nodes examined)
Relapse The relapse of the patients for colon cancer Sex The sex of the patient at diagnosis
All the possible combinations of the classifiers were explored, according to the algorithms and type of attributes allowed. The tested meta-classifiers were:
– Bagging[4]: Also called bootstrap aggregating. It splits the data intom
dif-ferent training sets on whichm classifiers are trained. The final prediction results from the equal voting of each generated model on the correct re-sult. Bagging is used to improve stability and classification accuracy, reduce variance and avoid overfitting.
– AdaBoost [10]: This meta-classifier calls a new weak classifier at each
iter-ation. A weight distribution which indicates the weight of examples in the classification is updated. It focuses on the examples that have been mis-classified so far in order to adjust subsequent classifiers and reduce relative error.
– Bayesian Boosting [17]: A new classification model is produced at each
iteration and the training set is reweighed so that previously discovered pat-terns are sampled out. The inner classifier is sequentially applied and the resulting models are later combined into a single model. The boosting op-eration is conducted based on probability estimates. It is particularly useful for discovering hidden groups in the data.
– Stacking [8]: This meta-classifier is used to combine base classifiers of
dif-ferent types. Each base classifier generates a model using the training set, then a meta-learner integrates the independently learned base classifier mod-els into a high level classifier by re-learning a meta-level training set. This meta-level training set is obtained by using the predictions of base classifiers in the validation dataset as attribute values and the true class as the target.
– Voting [12]: Each inner classifier of the meta-classifier receives the
train-ing set and generates a classification model. The prediction of an unknown example results from the majority voting of the derived classification models.
Since survival prediction is being handled as a classification problem, a group of basic classifiers were selected to be used in ensembles with the above-described meta-classifiers. The group includes some of the most widely used learners [18] available in RapidMiner, namely the k-NN (Lazy Modeling), the Naive Bayes (Bayesian Modeling), the Decision Tree (Tree Induction), and the Random Forest (Tree Induction).
A total of fourteen classification schemes were explored for each set of at-tributes (6 and 18 atat-tributes) for 1, 2, 3, 4, and 5 survival years. The learning combinations of meta-classifiers with basic classifiers are as follows. The Stacking model used k-NN, Decision Tree, and Random Forest classifiers as base learn-ers, and a Naive Bayes classifier as a Stacking model learner. The Voting model used k-NN, Decision Tree and Random Forest as base learners. The other mod-els were used in combination with each basic classifier. For evaluation purposes, 10-fold cross-validation [20] was used to assess the prediction performance of the generated prediction models and avoid overfitting.
4
Experimental Results and Discussion
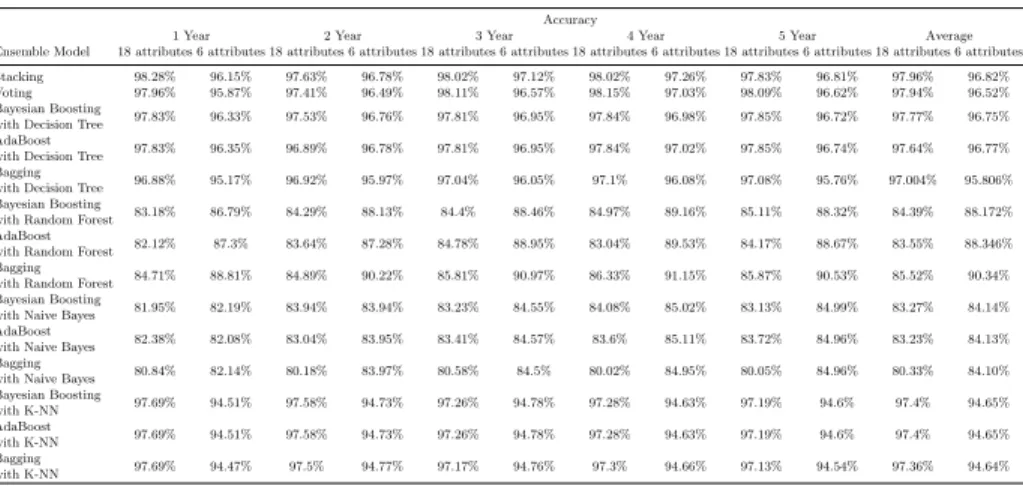
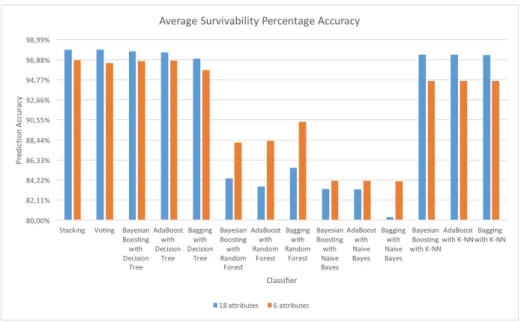
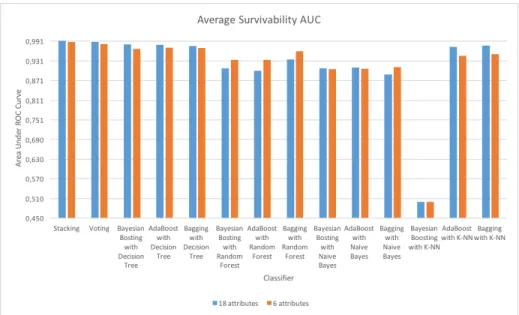
Each classification scheme was evaluated using the prediction accuracy and the area under the ROC curve (AUC) for 1, 2, 3, 4, and 5 years. The accuracy is the percentage of correct responses among the examined cases [3]. The AUC can be interpreted as the percentage of randomly drawn data pairs of individuals that have been accurately classified in the two populations [13], and it is commonly used as a measure of quality for classification models [3]. Tables 4 and 5 present all the results obtained for prediction accuracy and AUC respectively. The av-erage performances in terms of accuracy and AUC of the learning schemes for the 5 years are shown in Figures 2 and Figure 3 respectively.
Table 4.Survivability Percentage Accuracy. Accuracy
1 Year 2 Year 3 Year 4 Year 5 Year Average Ensemble Model 18 attributes 6 attributes 18 attributes 6 attributes 18 attributes 6 attributes 18 attributes 6 attributes 18 attributes 6 attributes 18 attributes 6 attributes Stacking 98.28% 96.15% 97.63% 96.78% 98.02% 97.12% 98.02% 97.26% 97.83% 96.81% 97.96% 96.82% Voting 97.96% 95.87% 97.41% 96.49% 98.11% 96.57% 98.15% 97.03% 98.09% 96.62% 97.94% 96.52% Bayesian Boosting
with Decision Tree 97.83% 96.33% 97.53% 96.76% 97.81% 96.95% 97.84% 96.98% 97.85% 96.72% 97.77% 96.75% AdaBoost
with Decision Tree 97.83% 96.35% 96.89% 96.78% 97.81% 96.95% 97.84% 97.02% 97.85% 96.74% 97.64% 96.77% Bagging
with Decision Tree 96.88% 95.17% 96.92% 95.97% 97.04% 96.05% 97.1% 96.08% 97.08% 95.76% 97.004% 95.806% Bayesian Boosting
with Random Forest 83.18% 86.79% 84.29% 88.13% 84.4% 88.46% 84.97% 89.16% 85.11% 88.32% 84.39% 88.172% AdaBoost
with Random Forest 82.12% 87.3% 83.64% 87.28% 84.78% 88.95% 83.04% 89.53% 84.17% 88.67% 83.55% 88.346% Bagging
with Random Forest 84.71% 88.81% 84.89% 90.22% 85.81% 90.97% 86.33% 91.15% 85.87% 90.53% 85.52% 90.34% Bayesian Boosting
with Naive Bayes 81.95% 82.19% 83.94% 83.94% 83.23% 84.55% 84.08% 85.02% 83.13% 84.99% 83.27% 84.14% AdaBoost
with Naive Bayes 82.38% 82.08% 83.04% 83.95% 83.41% 84.57% 83.6% 85.11% 83.72% 84.96% 83.23% 84.13% Bagging
with Naive Bayes 80.84% 82.14% 80.18% 83.97% 80.58% 84.5% 80.02% 84.95% 80.05% 84.96% 80.33% 84.10% Bayesian Boosting with K-NN 97.69% 94.51% 97.58% 94.73% 97.26% 94.78% 97.28% 94.63% 97.19% 94.6% 97.4% 94.65% AdaBoost with K-NN 97.69% 94.51% 97.58% 94.73% 97.26% 94.78% 97.28% 94.63% 97.19% 94.6% 97.4% 94.65% Bagging with K-NN 97.69% 94.47% 97.5% 94.77% 97.17% 94.76% 97.3% 94.66% 97.13% 94.54% 97.36% 94.64%
From the observation of the figures and the tables, it is obvious that almost all the classification methods demonstrated high performances, particularly the ones using decision trees. Out of those, the Stacking models showed a slightly better average performance both in terms of accuracy (Figure 2) and AUC (Figure 3). Comparing the results of the 6-attribute stacking models with those of the 18-attribute models, it is possible to say that the differences are not significant. With an average of 96.82% for accuracy and 0.989 for AUC, the 6-attribute stacking models had prediction accuracies for years 1 to 5 of 96.15%, 96.78%, 97.12%, 97.26% and 96.81% (as seen in Table 4), and AUCs of 0.984, 0.987, 0.990, 0.991 and 0.991 (as seen in Table 5). The 18-attribute models had an average accuracy of 97.96%, with values for years 1 to 5 of 98.28%, 97.63%, 98.02%, 98.02% and 97.83%. The average AUC was 0.993, and the remaining values were 0.991, 0.993, 0.994, 0.994 and 0.994, for years 1 to 5. It should be noted that, in addition to the close performances, the difference between the number of attributes used is important. The results show that it is possible to build a model with less than half of the features indicated by the expert physician. Regarding
Table 5.Survivability AUC. AUC
1 Year 2 Year 3 Year 4 Year 5 Year Average Ensemble Model 18 attributes 6 attributes 18 attributes 6 attributes 18 attributes 6 attributes 18 attributes 6 attributes 18 attributes 6 attributes 18 attributes 6 attributes Stacking 0.991 0.984 0.993 0.987 0.994 0.99 0.994 0.991 0.994 0.991 0.993 0.989 Voting 0.988 0.979 0.988 0.982 0.989 0.983 0.99 0.985 0.988 0.984 0.989 0.983 Bayesian Boosting
with Decision Tree 0.977 0.963 0.984 0.97 0.979 0.969 0.984 0.973 0.986 0.967 0.982 0.9684 AdaBoost
with Decision Tree 0.978 0.967 0.972 0.972 0.981 0.973 0.982 0.974 0.987 0.971 0.98 0.971 Bagging
with Decision Tree 0.981 0.977 0.971 0.97 0.974 0.969 0.976 0.972 0.978 0.965 0.976 0.971 Bayesian Boosting
with Random Forest 0.894 0.927 0.911 0.932 0.91 0.938 0.91 0.941 0.914 0.934 0.908 0.934 AdaBoost
with Random Forest 0.888 0.924 0.908 0.932 0.909 0.936 0.896 0.94 0.9 0.937 0.9 0.934 Bagging
with Random Forest 0.925 0.952 0.933 0.959 0.939 0.963 0.94 0.966 0.938 0.963 0.935 0.961 Bayesian Boosting
with Naive Bayes 0.896 0.888 0.9 0.9 0.916 0.912 0.916 0.917 0.912 0.913 0.908 0.906 AdaBoost
with Naive Bayes 0.901 0.89 0.907 0.902 0.917 0.912 0.914 0.918 0.915 0.914 0.911 0.907 Bagging
with Naive Bayes 0.872 0.887 0.885 0.906 0.896 0.92 0.9 0.926 0.898 0.923 0.89 0.912 Bayesian Boosting with K-NN 0.5 0.5 0.5 0.5 0.5 0.5 0.5 0.5 0.5 0.5 0.5 0.5 AdaBoost with K-NN 0.977 0.945 0.976 0.947 0.973 0.948 0.973 0.946 0.972 0.946 0.974 0.946 Bagging with K-NN 0.98 0.948 0.979 0.954 0.977 0.953 0.977 0.954 0.977 0.952 0.978 0.952
Fig. 2.Average survivability percentage accuracy: comparison of the 18-attribute mod-els with the 6-attribute modmod-els.
Fig. 3. Average survivability AUC: comparison of the 18-attribute models with the 6-attribute models.
the attributes obtained in the feature selection process, with the exception of the site-specific factors, they were all connected with the features indicated by the specialist physician.
Comparing this approach with others mentioned in Section 2, fewer features were necessary to develop the prediction model. Moreover, in the approach fol-lowed in [1], the closest to the one folfol-lowed herein, the best model of colon cancer survival prediction was based on a Voting classification scheme, with prediction accuracies of 90.38%, 88.01%, and 85.13% and AUCs of 0.96, 0.95, and 0.92 for years 1, 2 and 5. As such, the present work represents an improvement and was able to achieve considerably better results.
5
Conclusions and Future Work
This work involved the use of different meta-classification schemes to construct survival prediction models for colon cancer patients. The best model found uses a Stacking classification scheme, combining k-NN, Decision Tree, and Random Forest classifiers as base learners and a Naive Bayes classifier as a stacking model learner.
The ideal number of features for colon cancer survival prediction was found to be 6. The selected set includes: age, CS site-specific factor 1, CS site-specific factor 2, derived AJCC stage group, primary site, and regional nodes examined. Overall the developed model was able to present a good performance with fewer features than most of the existing approaches.
As future work one intends to conduct a similar analysis for rectal cancer, a pathology with similar characteristics to colon cancer. Additionally, a mobile application to make the model available to the health care community is un-der development. One intends to have this clinical decision support application available in different platforms, ready to assist health care professionals in car-rying out their duties at any time. In order to ensure that the model is able to adapt and adjust, an on-line learning scheme is also being prepared. In this way, it will be possible for users to dynamically feed new cases to the prediction system and make it change in order to provide better survival predictions. This type of model could also prove to be very useful when integrated in computer-interpretable guideline systems, such as the one described in [16], as a way to provide dynamic knowledge to rule-based decision support.
Acknowledgements
This work has been supported by FCT Funda¸c˜ao para a Ciˆencia e Tecnologia within the Project Scope UID/CEC/00319/2013. The work of Tiago Oliveira is supported by a FCT grant with the reference SFRH/BD/85291/ 2012.
References
1. Al-Bahrani, R., Agrawal, A., Choudhary, A.: Colon cancer survival prediction using ensemble data mining on seer data. In: 2013 IEEE International Conference on Big Data. pp. 9–16 (2013)
2. American Cancer Society: Colorectal cancer facts & figures 2011-2013. Tech. rep. (2011)
3. Bradley, A.P.: The use of the area under the ROC curve in the evaluation of machine learning algorithms. Pattern Recognition 30(7), 1145–1159 (1997) 4. Breiman, L.: Bagging predictors. Machine Learning 24(2), 123–140 (1996) 5. Bush, D.M., Michaelson, J.S.: Derivation : Nodes + PrognosticFactors Equation
for Colon Cancer accuracy of the Nodes + PrognosticFactors equation . Tech. rep. (2009)
6. Chang, G.J., Hu, C.Y., Eng, C., Skibber, J.M., Rodriguez-Bigas, M.a.: Practi-cal application of a Practi-calculator for conditional survival in colon cancer. Journal of Clinical Oncology 27(35), 5938–5943 (2009)
7. Chawla, N.V.: Data Mining for Imbalanced Datasets: An Overview. In: Data Min-ing and Knowledge Discovery Handbook, pp. 853–867 (2005)
8. Dˇzeroski, S., ˇZenko, B.: Is combining classifiers with stacking better than selecting the best one? Machine Learning 54(3), 255–273 (2004)
9. Ferlay, J., Soerjomataram, I., Ervik, M., Dikshit, R., Eser, S., Mathers, C., Re-belo, M., Parkin, D.M., Forman, D., Bray, F.: Globocan 2012: Estimated cancer incidence, mortality and prevalence worldwide in 2012 (2012),http://globocan. iarc.fr, last visited on 27/12/2015
10. Freund, Y., Schapire, R.E.: A decision-theoretic generalization of on-line learning and an application to boosting. J. Comput. Syst. Sci. 55(1), 119–139 (1997) 11. Ganganwar, V.: An overview of classification algorithms for imbalanced datasets.
12. Kittler, J.: Combining classifiers: A theoretical framework. Pattern Analysis and Applications 1(1), 18–27 (1998)
13. Klepac, G., Klepac, G., Kopal, R., Mri, L.: Developing Churn Models Using Data Mining Techniques and Social Network Analysis. IGI Global, Hershey, PA, USA, 1st edn. (2014)
14. Leon, M.R.C.D., Jalao, E.R.L.: Prediction Model Framework for Imbalanced Datasets (c), 33–41 (2014)
15. National Cancer Institute: Surveillance, epidemiology and end results program (2015),http://seer.cancer.gov/data/, last visited on 10/01/2015
16. Oliveira, T., Le˜ao, P., Novais, P., Neves, J.: Webifying the Computerized Execution of Clinical Practice Guidelines. In: Bajo Perez, J., Corchado Rodr´ıguez, J.M., et al. (eds.) Trends in Practical Applications of Heterogeneous Multi-Agent Systems. The PAAMS Collection SE - 18, Advances in Intelligent Systems and Computing, vol. 293, pp. 149–156. Springer International Publishing (2014)
17. RapidMiner: Rapidminer documentation: Bayesian boosting (2016),
http://docs.rapidminer.com/studio/operators/modeling/classification_ and_regression/meta/bayesian_boosting.html, last visited on 03/01/2016 18. RapidMiner: Rapidminer documentation: Operator reference guide (2016), http:
//docs.rapidminer.com/studio/operators/, last visited on 03/01/2016
19. RapidMiner: Rapidminer documentation: Optimize selection (2016), http: //docs.rapidminer.com/studio/operators/data_transformation/attribute_ space_transformation/selection/optimization/optimize_selection.html, last visited on 03/01/2016
20. Refaeilzadeh, P., Tang, L., Liu, H.: Cross-validation. In: LIU, L., ¨OZSU, M. (eds.) Encyclopedia of Database Systems, pp. 532–538. Springer US (2009)
21. Snow, P.B., Kerr, D.J., Brandt, J.M., Rodvold, D.M.: Neural network and regres-sion predictions of 5-year survival after colon carcinoma treatment. Cancer 91(8 Suppl), 1673–1678 (2001)
22. Vachani, C., Prechtel-Dunphy, E.: All about rectal cancer (2015), http:// www.oncolink.org/types/article.cfm?aid=108\&id=9457\&c=703, last visited on 27/12/2015
23. Weiser, M.R., G¨onen, M., Chou, J.F., Kattan, M.W., Schrag, D.: Predicting sur-vival after curative colectomy for cancer: Individualizing colon cancer staging. Jour-nal of Clinical Oncology 29(36), 4796–4802 (2011)
24. Wolff, A.C., Hammond, M.E.H., Schwartz, J.N., et al.: American Society of Clinical Oncology/College of American Pathologists guideline recommendations for human epidermal growth factor receptor 2 testing in breast cancer. Journal of clinical oncology 25(1), 18–43 (2007)
25. Yamauchi, M., Lochhead, P., Morikawa, et al.: Colorectal cancer: a tale of two sides or a continuum? Gut 61(6), 794–797 (2012)