© Global Society of Scientific Research and Researchers http://asrjetsjournal.org/
Detection of Epileptic Seizure Based on Phase Space
Reconstruction and Support Vector Machine
Ayad G. Baziyad*
Department of Electrical Engineering, King Saud University, Riyadh 11421, Saudi Arabia Email: [email protected]
Abstract
Electroencephalogram (EEG) is an important brain signal for disease diagnosis. Automated detection of epilepsy is still an open field for research. In this study, a simulation of epilepsy detection approach is achieved by a combination of feature extraction and classification algorithms. The features were extracted using phase space reconstruction, and classified by support vector machine. The performance evaluation was tested using dataset available by University of Bonn. The results of our experiments showed excellent classification accuracy (100%), sensitivity (100%) and specificity (99%).
Keywords: Electrocardiogram signals; Support Vector Machine; Epilepsy Seizure; Phase Space Reconstructions.
1. Introduction
Epilepsy is a disease that causes convulsive seizures of human beings. Accordingly, a disturbed electrical activity occurs in the brain. Such activity can be measured as electroencephalogram signals (EEG). For studying the epileptic seizure, EEG signals are recorded during three stages; interictal stage occurring during seizure, preictal stage occurring before seizure and can last 30 minutes, and postictal stage coming after ending the seizure. Both first and second stages lie in determined frequencies (0-30 Hz). These frequencies contain four well-known bands: delta (0-4) Hz, theta (4-8) Hz, alpha (8-14) Hz , and beta (14-30)Hz frequency bands. Hence, it is recommended to extract features from all these bands [1]. The EEG signals may be contaminated by noise
Such noise makes the epileptic EEG to be difficulty detected. Hence, some artifact removal methods have been proposed, such as Regression method [2], adaptive filters Recursive Least Square or Least Mean Square [3, 4], and Blind source separation such as a heuristic learning algorithm [5]. For Multiclass problems, PCA and ICA have been applied with good results [6, 7]. As well, Discrete Wavelet Transform method have presented perfect results with calculating thresholding limits [8, 9]. For feature extraction, several techniques have been applied for epilepsy seizure detection. The authors, in [10], attempted to classify statistical features in time domain. The results showed satisfactory average accuracy, sensitivity and specificity: 93%, 88% and 88%, respectively. In relation to time-frequency domain, DWT has been applied for segments of EEG signals with Artificial Neural Network classifier (ANN) [11]. The results were 97.2-100% of classification accuracy. The authors, in [12], showed that differentiation and spectral analysis with AR-MLPNN outperformed FFT with QDA classifier. Hjorth's parameter, mobility, which depends on first order derivative, was used for feature extraction part. The AR method performed well results with MLPNN classifier (99.9% of accuracy). This results proved that AutoRegressive technique might be successful in the application of epilepsy seizure detection. Entropy technique is even widely used in the detection of epileptic EEG signals. This technique describes the disorder happening in the signal as nonlinear features of EEG signals. The authors, in [13], have used the sample entropy method (SampEn) for epileptic seizure detection. The results showed high accuracy (95.5%) with Extreme Learning Machine (ELM). Another type of entropy have been applied, as in [14], called Optimized Sample Entropy (O-SampEn). The O-SampEn outperformed over Sample Entropy (SampEn) in term of the accuracy and computation speed. Phase space features using Poincaré section have been applied for epileptic seizure detection [15]. The research has presented an accuracy as high as 93% through a combination of phase space and PCA features. As well, a proposed method of the phase space reconstruction have been applied for three-class motor imagery three-classification. This method achieved perfect results; 86.06% and 93% of three-classification accuracy for two data sets [16]. The authors proved that phase space reconstruction is a suitable method for analyzing the nonstationary EEG. This technique is considered in this study, where phase space reconstruction are combined with Autoregressive model. The features were classified using SVM for it is a successful classifier in most EEG applications. The remaining parts are organized as follows. Section 2 explains the EEG data set, and the proposed method used in our work. Section 3 presents results and discussion of our experiments. Finally, section 4 presents the conclusion of the paper.
2. Methods
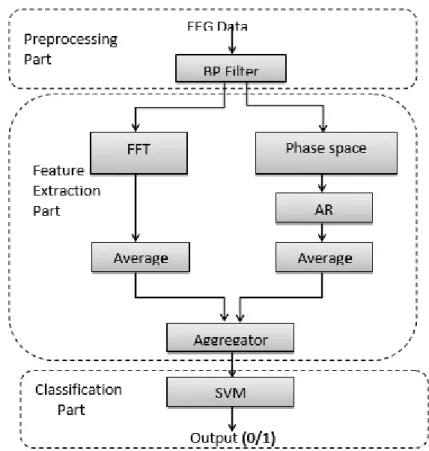
In this section, the main objective is to obtain optimal features of the amplitude and phase of EEG signals using phase space reconstruction technique, AR model and FFT. The classification part are achieved using SVM classifier. Figure 1 demonstrates the block diagram proposed to increase the accuracy of the epilepsy seizure detection. The proposed approach contains three parts: preprocessing, feature extraction, and classification part. The input data are transmitted to the preprocessing part as segmented EEG signals. The output results are positive or negative values, but they are normalized into 0 or 1 so that indicate normal or epileptic, respectively.
Figure 1: Block diagram of the proposed approach for epilepsy seizure detection
2.1.Dataset
In this work, the dataset of Bonn University were used in all our experiments. The dataset were recorded using 128-channel acquisition device at 173.61 Hz of sampling frequency in five sets (A–E). Each set contains 100 segments, each lasts around 23.5989 second. In this work, we only use two sets: a normal set (A) taken from normal subjects, and an epileptic set (E) taken from epileptic subjects [17].
2.2.EEG Preprocessing
Every segment of EEG signals is individually processed over all stages except in case of training. Since EEG signals are contaminated by noise resulting from powerline, baseline, or muscle movements, we can reduce effect of this noise using band-pass filter. We chose the epileptic filter (0.5-30Hz) because it does not affect phase of signals and reduces processing time in comparison with other filters. This procedure detects epileptic samples locating exactly along theta, delta, alpha and beta rhythms and warrants expected results for detection. Then, a feature extraction method is applied to extract the dominant features from EEG signals using phase space reconstruction. This method is discussed in more detail in Subsection C.
Fourier transform was employed by FFT that produces complex coefficients of EEG samples. In order to overcome the leakage happening over frequency range side lobes, the implementation of FFT was carried out with a finite size of time of the signal [18]. In our research work, Hamming function (HW) was used with a short time window (64 samples). We added this step to also improve SNR of the signal and to collect the energy around one frequency. In order to obtain features of the FFT, the absolute and angle of complex coefficients are calculated whereas the obtaining values are averaged, and then aggregated in a single vector. Applying FFT without any other proposed part is an insufficient procedure to obtain accurate results [19]. Hence, in this paper, another technique was used with FFT in parallel. Phase space reconstruction detects optimal parameters of dimension in another attractor having the same properties of original attractor. This technique is useful for extracting the features of disordered series with simple computations [20, 21]. This makes our approach less complexity than conventional approaches. All dimensions were reconstructed using Time-Delay Phase Space Reconstruction method that is proper for one-dimension time series. In this method, if {xk:k = 1,2, …, N} is time series, the modelling of phase space reconstruction for of m-dimensions can be defined as:
[ ] [ ] (1)
where each element in vector X is represented by
(2)
where M = N-(m-1) , is the time delay, and m is the dimension. The parameter m should be properly selected in order to provide an exact description of the dynamics of the system.
If we consider the time delay as an exponential function:
(3)
we can also represent the phase-space reconstruction as the following:
(4)
where represents FFT, and is time window function of . Hence, it can be said that the process of phase space reconstruction is a filter for the samples. Since skull thickness of subjects are different from one to another, EEG signals would be certainly different in some properties. Consequently, this difference may be appeared in each dimension resulting from phase space reconstruction. Accordingly, we combined the phase space reconstruction with Autoregressive method so that produce coefficients unaffected by such changes. AR model of time series provides as an efficient linear combination based on past samples [22]. AR for signal y(t) can be mathematically defined by the following equation:
Where (k= 1, 2, ..., n) are the output coefficients, and n is the number of previous samples, , and denotes the zero mean process. The AR coefficients were averaged, and then collected with FFT features in a single vector. Hence, the total features were transmitted to the classifier. In classification case, we chose Support Vector Machine (SVM) which is able to accurately classify features in most applications.
3. Experiment Results and Discussion
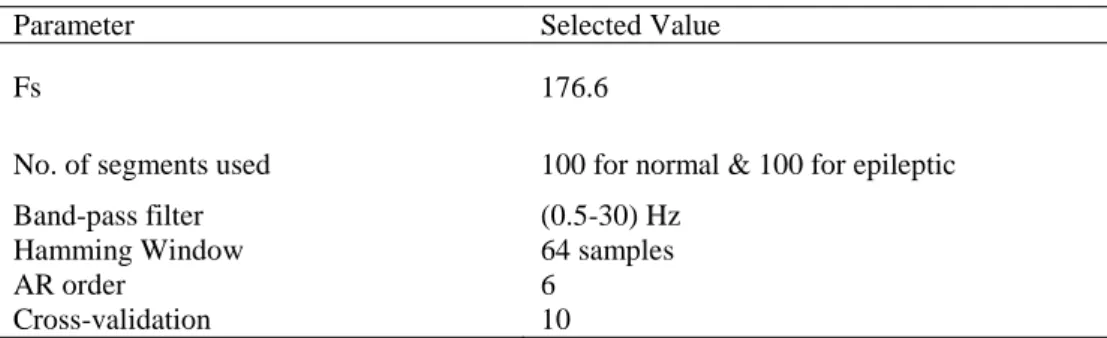
In our experiments, we used Matlab-R2013a to implement the algorithm. The approach was executed with specific parameters as mentioned above. A summary of these parameters is illustrated in Table 1. The SVM was given 200 observations of features; 100 for normal set and 100 for epileptic set.
Table 1: Parameters of proposed approach
Parameter Selected Value
Fs 176.6
No. of segments used 100 for normal & 100 for epileptic
Band-pass filter (0.5-30) Hz
Hamming Window 64 samples
AR order 6
Cross-validation 10
Four measures were used for performance evaluation; the receiver operating characteristic plot (ROC), classification accuracy, sensitivity and specificity. ROC is mapped by relationship between the sensitivity and specificity, and the remaining measures are calculated by the following formulas:
( ) (6) ( ) (7) ( ) (8)
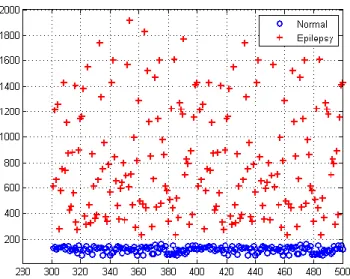
where TP denotes number of epileptic segments classified correctly. FP is number of epileptic segments classified incorrectly. TN denotes number of normal segments classified correctly. FN is number of normal segments that are incorrectly classified. For perfect classification accuracy, we used 10-fold cross- validation measure in our experiments, which is recommended in machine learning [23]. All data were divided into 10 subsets; 9 sets for training and one set for testing. This step was repeated 10 times so that testing subset is selected from other subsets. The classification accuracy of SVM was calculated by the average of the results of 10 iterations. Figure 2 shows the distribution of features for normal and epileptic data before using SVM. It can
sensitivity and specificity reached 100% and 99%, respectively. In other words, 100% of sensitivity means that our algorithm classified all normal segments (TN) fully, and 99% of specificity means that few errors resulting when classifying the epileptic segments (TP).
Figure 2: Distribution of all features of normal and epileptic without classification
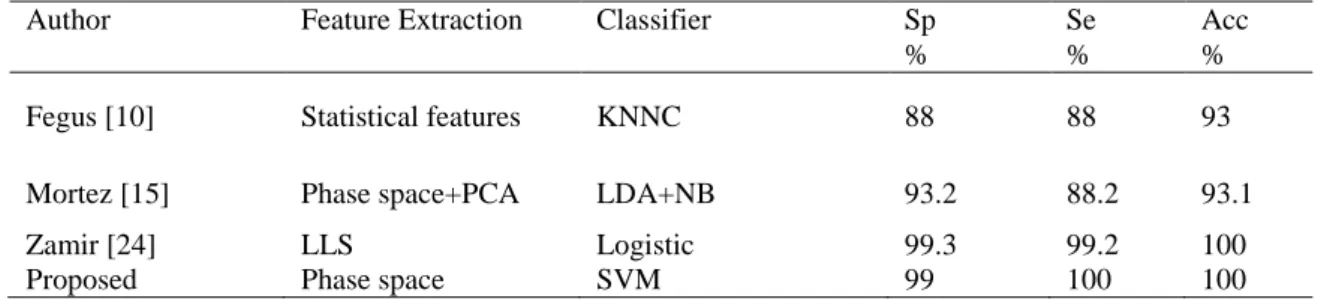
We also take into consideration of processing time which is very important in practical application. The overall time of our algorithm was 0.629s for training and 0.0078s for testing, respectively, as demonstrated in Table 2. The algorithm was executed by Intel processor with a 2.20-GHz speed. Table 3 shows a summary of the relevant studies for EEG-based epilepsy. Fergus and his colleagues in [10] presented reasonably good results (Se=88% Sp=88%, and Acc=93%) using the linear discriminant analysis backward search technique with KNNC classifier. Their proposed technique is useful for reducing cost of applications, but the accuracy results are lower than our results.
Table 2: Processing time in training and testing
Part Train (s) Test (s)
Preprocessing & Feature Extraction 0.511 0.0051
Classification 0.118 0.0027
Total 0.629 0.0078
Table 3: Comparison between results of relevant studies and our results
Author Feature Extraction Classifier Sp
%
Se %
Acc %
Fegus [10] Statistical features KNNC 88 88 93
Mortez [15] Phase space+PCA LDA+NB 93.2 88.2 93.1
Zamir [24] LLS Logistic 99.3 99.2 100
Proposed Phase space SVM 99 100 100
Mortez and his colleagues in [15] attempted to extract the features from crossing points of Poincaré section and a high-dimensional phase space without preprocessing. Phase space method was combined with PCA, and the classifier was LDA. This approach achieved perfect results; fast computations, minimum false alarm, and high accuracy (Se=88.2%, Sp=93.2%, and Acc=93.1%). Our approach achieved better results than these results. Zamir [24] proposed an approach using LLS preprocessing. In such approach, the epileptic features are approximated as sine waves and its amplitudes constructed from a polynomial function. The author developed two models Linear Least Squares P1 and Linear Least Squares P2. Different classifiers were used while classification accuracy was improved with most classifiers, especially the Logistic classifier (Se=99.2%,Sp=99.3%, and Acc=100%). All satisfactory results of these research are either very closed or less than our results. This gives our work more reliability and applicable for epilepsy seizure applications in medical diagnosis. Since our research is not funded, we couldn’t record a new data in our lab. A new data would be more useful and support our results. As well, real time processing needs complex algorithms to be applied in real life. Solution of this point is also related with the fund.
4. Conclusion
In this work, we have presented a new approach for epilepsy detection using phase space reconstruction technique, autoregressive technique and support vector machine (SVM). Our experiments results outperformed those obtained in literature review. The advantage of our algorithm is its simplicity and its high computational speed as well as the high accuracy (100%). All these advantages support our algorithm to be efficiently used in the practical life. In future work, a new data from would be recorded from several subjects, and the next research work would be focused on the three-class problem, including the prediction of epileptic EEG.
should be focused on the three-class problem. The prediction of epilepsy seizure should be studied as well as the detection case. Real-time prediction can be useful to develop the applications of epilepsy seizure in real life.
References
[1] B. Fisch and R. Spehlmann, Fisch and Spehlmann's EEG primer: basic principles of digital and analog EEG, 3rd ed. msterdam olanda : lsevier, 1991.
[2] T. Gasser and J. Möcks, "Correction of EOG Artifacts in Event‐ Related Potentials of the EEG: Aspects of Reliability and Validity," Psychophysiology, vol. 19, pp. 472-480, 1982, 2011.
[3] A. G. Correa, E. Laciar, H. Patiño, and M. Valentinuzzi, "Artifact removal from EEG signals using adaptive filters in cascade," in Journal of Physics: Conference Series, 2007, p. 012081.
[4] P. S. Kumar, R. Arumuganathan, K. Sivakumar, and C. Vimal, "An adaptive method to remove ocular artifacts from EEG signals using wavelet transform," J. Appl. Sci. Res, vol. 5, pp. 711-745, 2009.
[5] C. Jutten and J. Herault, "Blind separation of sources, part I: An adaptive algorithm based on neuromimetic architecture," Signal processing, vol. 24, pp. 1-10, 1991.
[6] P. LeVan, E. Urrestarazu, and J. Gotman, "A system for automatic artifact removal in ictal scalp EEG based on independent component analysis and Bayesian classification," Clinical neurophysiology, vol. 117, pp. 912-927, 2006.
[7] S. Casarotto, A. M. Bianchi, S. Cerutti, and G. A. Chiarenza, "Principal component analysis for reduction of ocular artefacts in event-related potentials of normal and dyslexic children," Clinical neurophysiology, vol. 115, pp. 609-619, 2004.
[8] P. S. Kumar, R. Arumuganathan, K. Sivakumar, and C. Vimal, "A wavelet based statistical method for de-noising of ocular artifacts in EEG signals," IJCSNS International Journal of Computer Science and Network Security, vol. 8, pp. 87-92, 2008.
[9] M. Salwani and Y. Jasmy, "Comparison of few wavelets to filter ocular artifacts in EEG using lifting wavelet transform," in TENCON 2005-2005 IEEE Region 10 Conference, 2005, pp. 1-6.
[10] P. Fergus, A. Hussain, D. Hignett, D. Al-Jumeily, K. Abdel-Aziz, and H. Hamdan, "A machine learning system for automated whole-brain seizure detection," Applied Computing and Informatics, vol. 12, pp. 70-89, 2016.
[11] A. Tzallas, M. Tsipouras, and D. Fotiadis, "Automatic seizure detection based on time-frequency analysis and artificial neural networks," Computational Intelligence and Neuroscience, vol. 2007, 2007.
and spectral analysis of electroencephalograms," Computers in biology and medicine, vol. 66, pp. 352-356, 2015.
[13] Y. Song and J. Zhang, "Discriminating preictal and interictal brain states in intracranial EEG by sample entropy and extreme learning machine," Journal of Neuroscience Methods, vol. 257, pp. 45-54, 2016.
[14] Y. Song, J. Crowcroft, and J. Zhang, "Automatic epileptic seizure detection in EEGs based on optimized sample entropy and extreme learning machine," Journal of Neuroscience Methods, vol. 210, pp. 132-146, 2012.
[15] M. Zabihi, S. Kiranyaz, A. B. Rad, A. K. Katsaggelos, M. Gabbouj, and T. Ince, "Analysis of high-dimensional phase space via Poincaré section for patient-specific seizure detection," IEEE Transactions on Neural Systems and Rehabilitation Engineering, vol. 24, pp. 386-398, 2016.
[16] R. Djemal, A. G. Bazyed, K. Belwafi, S. Gannouni, and W. Kaaniche, "Three-Class EEG-Based Motor Imagery Classification Using Phase-Space Reconstruction Technique," Brain Sciences, vol. 6, p. 36, 2016.
[17] R. G. Andrzejak, K. Lehnertz, F. Mormann, C. Rieke, P. David, and C. E. Elger, "Indications of nonlinear deterministic and finite-dimensional structures in time series of brain electrical activity: Dependence on recording region and brain state," Physical Review E, vol. 64, p. 061907, 2001.
[18] F. J. Harris, "On the use of windows for harmonic analysis with the discrete Fourier transform," Proceedings of the IEEE, vol. 66, pp. 51-83, 1978.
[19] K. Polat and S. Güneş, "Classification of epileptiform G using a hybrid system based on decision tree classifier and fast Fourier transform," Applied Mathematics and Computation, vol. 187, pp. 1017-1026, 2007.
[20] F. Takens, "Detecting strange attractors in turbulence," in Dynamical systems and turbulence, Warwick 1980, ed: Springer, 1981, pp. 366-381.
[21] H.-g. Ma and C.-z. Han, "Selection of embedding dimension and delay time in phase space reconstruction," Frontiers of Electrical and Electronic Engineering in China, vol. 1, pp. 111-114, 2006.
[22] V. Lawhern, W. D. Hairston, K. McDowell, M. Westerfield, and K. Robbins, "Detection and classification of subject-generated artifacts in EEG signals using autoregressive models," Journal of Neuroscience Methods, vol. 208, pp. 181-189, 2012.