Automated Model-Based Spreadsheet Debugging
Dissertation
zur Erlangung des Grades eines
D o k t o r s d e r N a t u r w i s s e n s c h a f t e n der Technischen Universität Dortmund
an der Fakultät für Informatik von
Thomas Schmitz
Dortmund 2017
Tag der mündlichen Prüfung: 24.08.2017
Dekan: Prof. Dr.-Ing. Gernot A. Fink
Gutachter:
Prof. Dr. Dietmar Jannach Prof. Dr. Franz Wotawa
Abstract
Spreadsheets are interactive data organization and calculation programs that are developed in spreadsheet environments like Microsoft Excel or LibreOffice Calc. They are probably the most successful example of end-user developed software and are utilized in almost all branches and at all levels of companies. Although spreadsheets often support important decision making processes, they are, like all software, prone to error. In several cases, faults in spreadsheets have caused severe losses of money.
Spreadsheet developers are usually not educated in the practices of software devel-opment. As they are thus not familiar with quality control methods like systematic testing or debugging, they have to be supported by the spreadsheet environment itself to search for faults in their calculations in order to ensure the correctness and a better overall quality of the developed spreadsheets.
This thesis by publication introduces several approaches to locate faults in spread-sheets. The presented approaches are based on the principles of Model-Based Diagnosis (MBD), which is a technique to find the possible reasons why a system does not behave as expected. Several new algorithmic enhancements of the general MBD approach are combined in this thesis to allow spreadsheet users to debug their spreadsheets and to efficiently find the reason of the observed unexpected output values. In order to assure a seamless integration into the environment that is well-known to the spreadsheet developers, the presented approaches are implemented as an extension for Microsoft Excel.
The first part of the thesis outlines the different algorithmic approaches that are introduced in this thesis and summarizes the improvements that were achieved over the general MBD approach. In the second part, the appendix, a selection of the author’s publications are presented. These publications comprise (a) a survey of the research in the area of spreadsheet quality assurance, (b) a work describing
how to adapt the general MBD approach to spreadsheets, (c) two new algorithmic improvements of the general technique to speed up the calculation of the possible reasons of an observed fault, (d) a new concept and algorithm to efficiently determine questions that a user can be asked during debugging in order to reduce the number of possible reasons for the observed unexpected output values, and (e) a new method to find faults in a set of spreadsheets and a new corpus of real-world spreadsheets containing faults that can be used to evaluate the proposed debugging approaches.
Contents
1 Introduction 1
1.1 Faults in Spreadsheets . . . 1
1.2 Spreadsheet Quality Assurance . . . 3
1.3 Overview of this Thesis . . . 5
1.4 Publications . . . 7
1.4.1 Avoiding, Finding and Fixing Spreadsheet Errors – A Survey of Automated Approaches for Spreadsheet QA . . . 7
1.4.2 Model-Based Diagnosis of Spreadsheet Programs . . . 7
1.4.3 MERGEXPLAIN: Fast Computation of Multiple Conflicts for Diagnosis . . . 8
1.4.4 Parallel Model-Based Diagnosis on Multi-Core Computers . . 8
1.4.5 Efficient Sequential Model-Based Fault-Localization with Par-tial Diagnoses . . . 8
1.4.6 Finding Errors in the Enron Spreadsheet Corpus . . . 9
2 Model-Based Diagnosis for Spreadsheets 11 2.1 Introductory Example . . . 12
2.2 Computation of the Diagnoses . . . 13
2.3 An Interactive Tool for Model-Based Spreadsheet Debugging . . . 14
3 New Algorithmic Approaches for Faster Calculation of Diagnoses 17 3.1 Faster Conflict Detection . . . 17
3.2 Parallelizing the Calculation of Diagnoses . . . 20
4 Sequential Diagnosis 23 4.1 The General Sequential Diagnosis Approach . . . 23
4.2 Speeding Up the Query Calculation . . . 24
5 Creating a Corpus of Faulty Spreadsheets 27 5.1 Types of Spreadsheets Used in Research . . . 27
5.2 Publicly Available Spreadsheet Corpora . . . 28
5.3 Building a Real-World Spreadsheet Corpus with Fault Information . . 30
5.3.1 Fault Detection Methods . . . 30
5.3.2 The Enron Error Corpus . . . 32
6 Conclusion 33
Bibliography 35
List of Figures 39
List of Tables 41
Publications 43
Avoiding, Finding and Fixing Spreadsheet Errors - A Survey of Automated Approaches for Spreadsheet QA . . . 47 Model-Based Diagnosis of Spreadsheet Programs . . . 117 MERGEXPLAIN: Fast Computation of Multiple Conflicts for Diagnosis . . . 119 Parallel Model-Based Diagnosis on Multi-Core Computers . . . 121 Efficient Sequential Model-Based Fault-Localization with Partial Diagnoses 175 Finding Errors in the Enron Spreadsheet Corpus . . . 177
1
Introduction
Spreadsheets are interactive data organization and calculation programs that are developed in spreadsheet environments like Microsoft Excel or LibreOffice Calc. They are widely used in business as well as for private calculation tasks and are therefore the most wide-spread type of end-user developed software [Sca+05]. The success of spreadsheets has several reasons. First, as spreadsheets are designed in a visual environment, they are easy to develop also for users without a background in soft-ware development and they are more flexible than traditional softsoft-ware [Hun+05]. Yet, they are powerful enough for many daily calculation tasks like budget planning or tax computations. In addition, spreadsheets can be useful even at the beginning of their development as they can start as a simple data storage and then evolve to a complex calculation tool. For example, a list of expenses can evolve to a complete budget calculation. Therefore, spreadsheets can cover a wider range of tasks over time as their development progresses.
Especially in the industry, spreadsheets are a common tool for calculations in daily business as well as in preparation for business decisions [Pan+12]. In most com-panies a wide range of spreadsheets is created and maintained. For example, in the Enron Corporation, formerly one of the biggest energy companies in the US, 16,189 unique spreadsheets were sent by email during a time frame of two years [Her+15].
1.1 Faults in Spreadsheets
Although the creation of spreadsheets is often not perceived as software development, a spreadsheet that contains formulas in fact is a software that calculates the values of the output cells given the input values. These spreadsheets, as all other software, are prone to error [Pan98].
When speaking about errors, several definitions for the words “fault”, “error”, and “failure” exist in the research literature [Jan+14a]. According to the IEEE Standard Classification for Software Anomalies [IEE10] an “error” is a misapprehension on
side of the one developing a software caused by a mistake or misconception occurring in the human thought process. A “fault” is the manifestation of an “error” within a software which may be causing a “failure”. A “failure” is the deviation of the observed behavior of the software from the expectations. However, in the research literature the terms “fault” and “error” are often used interchangeably. In order to comply with the IEEE standard, in this thesis the terms “fault” and “error” are used according to the given definitions.
Faults in spreadsheets have already caused severe financial losses in the past. The consulting company F1F9 lists twelve famous cases of faulty spreadsheets, many of which had severe impacts [F1F]. One well-known example is the economic study of Reinhart and Rogoff, which states a strong negative relation between the debt of a country and its economic growth [Rei+10]. Politicians used this study to argue against new debts and changed their strategies accordingly. Later, Herndon et al. showed that faults in a spreadsheet led to miscalculations in the study and that the discovered relation was much weaker than originally stated [Her+13]. As another example, in 2014 the Wall Street Journal informed about a fault in a spreadsheet that caused an overestimation of the equity value of the software company Tibco by $100 million [Tan14].
When analyzing a spreadsheet for such important faults, different approaches are required to locate the various types of faults that can be made when designing a spreadsheet. In the literature, several taxonomies were proposed to classify spreadsheet errors [Pan98; Pur+06; Pow+08; Pan+10]. In this thesis, a combined taxonomy is used to structure the possible errors in a systematic way. The error taxonomy is shown in Figure 1.1 and can be summarized as follows.
Errors
Application-Identified Errors User-Identified Errors
Qualitative Errors Quantitative Errors
Structural Errors Temporal Errors Mechanical Errors Logic Errors Omission Errors Syntax Errors Formula Errors
Figure 1.1: Taxonomy of spreadsheet errors, adapted from [Abe15].
Errors in a spreadsheet can be classified into two main categories. Application-Identified Errors can be automatically detected with certainty by the spreadsheet environment. Microsoft Excel, for example, automatically detectsSyntax Errorsand a user is not able to put a syntactically faulty formula in a cell as the spreadsheet
environment will inform the user that the written formula is faulty.Formula Errors are detected by Excel and similar environments when they evaluate the value of a formula, for example, when dividing by zero.
In contrast toApplication-Identified Errors,User-Identified Errorscannot be detected by the spreadsheet environment but have to be detected by the user or otherwise remain unknown. These errors can be split into two more sub-categories.Qualitative Errorsdo not result in a wrong calculation outcome in the current version of the spreadsheet but could result in a faulty value when the spreadsheet is changed later. They comprise Structural Errors and Temporal Errors. Structural Errors describe errors in the design of a spreadsheet, for example, hard-coded values in a formula that should be inputs. Temporal Errorssummarize those values or formulas that are only correct for a specific time period and can be wrong at a later date, for example, a value that is only correct for a specific day of the year but is not labeled as such.
The group of errors which immediately result in faulty values in the current version of the spreadsheet is called Quantitative Errors. These errors can be split into Mechanical Errors, which describe errors by a user in the process of typing a formula, Logic Errors, that occur when a wrong function or algorithm is used, andOmission Errors, that occur if the user does not incorporate some aspect of the task he or she tries to solve. The main focus of this thesis lies on theseQuantitative Errors, as these errors have a direct impact on the result of the spreadsheet and are therefore probably the most important ones to fix.
1.2 Spreadsheet Quality Assurance
To find possible faults when developing spreadsheets and to use the spreadsheets for important tasks without any risks, the quality of the spreadsheets has to be assured. This is potentially even more important for spreadsheets than for traditional software, as spreadsheet users who do not have a software development background might not be aware of the high risks. However, approaches for spreadsheet quality assurance (QA) have to be well integrated into the spreadsheet environment and easy to use even for users without any knowledge in software development. Since one important factor of the success of spreadsheets is their high flexibility compared to other software, this advantage should not be removed by the QA approaches.
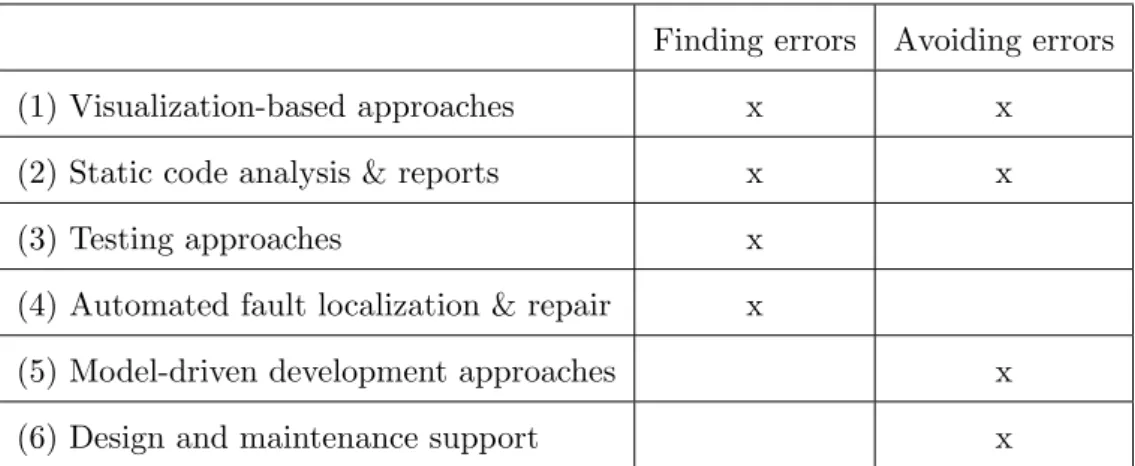
Over the years, several techniques for spreadsheet quality assurance have been proposed in the research literature. In [Jan+14a], which is included in this thesis, a survey is presented that classifies the existing approaches for spreadsheet QA in two dimensions. The first dimension is used to distinguish between approaches that are
made for locating faults in a spreadsheet and approaches that should help to avoid making errors in the first place. The second dimension was made to differentiate between the approaches based on how they fulfill their tasks. Table 1.1 shows for which tasks the different types of techniques can be used.
Table 1.1: Overview of main categories of automated spreadsheet QA [Jan+14a].
Finding faults Avoiding errors
Visualization-based approaches X X
Static code analysis & reports X X
Testing-based techniques X
Automated fault localization & repair X
Model-driven development approaches X
Design and maintenance support X
The different groups of techniques can be summarized as follows [Jan+14a].
Visualization-based approaches: Approaches of this group help the user by pro-viding visualizations of the spreadsheet. Most of the proposed representations are utilized to explain the dependencies between the cells, groups of cells, or even the different worksheets of a spreadsheet. Such visualizations can help the user in the tasks of both categories finding faults as well as avoiding errors, because the user can detect anomalies in the existing dependencies or use them to improve the design of the spreadsheet to avoid making errors in the future.
Static code analysis & reports: Methods of this category perform static analyses of the formulas and data of a spreadsheet. They can be used to find irregularities and to point out problematic areas that are prone to be faulty or that can often lead to faults in subsequent versions of the spreadsheet. Therefore, these approaches can also be used to find faults or to avoid errors. They include techniques like “code smells”, detecting duplicates of data, or other approaches typically found in commercial tools that detect suspicious cells.
Testing-based techniques: Techniques in this category are based on the general approach of systematic testing. The approaches support the user in creating and organizing test cases that specify the input values of the spreadsheet and the expected output values of some formulas given the input values. As these techniques do not change the way a spreadsheet itself is built, they only support the user to find faults but not to avoid making errors. However, they can also be used to find faults during the construction of the spreadsheet and thus help to improve the quality of the built spreadsheet. The methods of this category include techniques like test case management, automated test case generation, or the analysis of the test coverage.
Automated fault localization & repair: The approaches presented in this thesis mostly fall into the category of automated fault localization & repair, which contains the techniques that computationally determine the possible reasons of a fault or an unexpected calculation outcome. To perform these calculations they typically require additional information provided by the user about unexpected output values. In addition to calculating the possibly faulty formulas, some approaches in this category provide suggestions of how these formulas could be “repaired”.
Model-driven development approaches: In contrast to the previous categories, model-driven development approaches do not aim to find faults in an existing spreadsheet but propose a method to systematically develop a spreadsheet. This way these approaches try to support the user in developing spreadsheets that do not contain any faults. The main idea of these approaches is to use (object-oriented) con-ceptual models or model-driven software development techniques. These concepts have the advantage of adding an additional layer of abstraction and thus eliminate some types of possible faults like copy-and-paste errors or mechanical errors.
Design and maintenance support: Methods of this category help the spreadsheet developer when designing or maintaining a spreadsheet by automating common tasks or providing new methods to design spreadsheets in order to avoid com-mon faults like range or reference errors. These techniques include, for example, refactoring tools, methods to avoid wrong cell references, and exception handling.
1.3 Overview of this Thesis
Thisthesis by publicationcombines several approaches to automatically locate faults in a spreadsheet. Most of these approaches are based upon and extend the approach of using Model-Based Diagnosis (MBD) for spreadsheets.
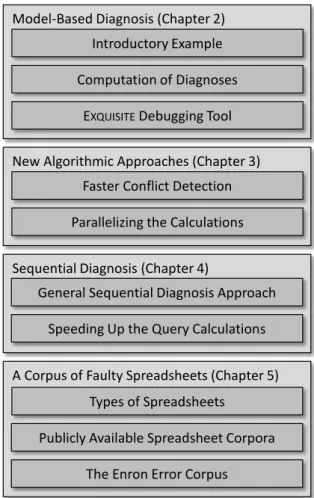
MBD is a systematic approach to find the possible reasons why a system under observation does not behave as expected. As it is shown in the structural overview of this thesis in Figure 1.2, Chapter 2 introduces the general idea of MBD in more detail and describes how it can be adapted to efficiently search for possibly faulty formulas in spreadsheets based on test cases that specify input values and corresponding expected output values for a spreadsheet [Jan+16a]. The general MBD approach, however, has two limitations depending on the structure and size of the analyzed spreadsheet. In the other chapters of this thesis by publication these limitations of the general MBD approach are addressed and improvements are introduced to mitigate them.
Model-Based Diagnosis (Chapter 2) Introductory Example Computation of Diagnoses
EXQUISITEDebugging Tool New Algorithmic Approaches (Chapter 3)
Faster Conflict Detection Parallelizing the Calculations Sequential Diagnosis (Chapter 4)
General Sequential Diagnosis Approach Speeding Up the Query Calculations A Corpus of Faulty Spreadsheets (Chapter 5)
Types of Spreadsheets Publicly Available Spreadsheet Corpora
The Enron Error Corpus
Figure 1.2: Structural overview of this thesis.
One limitation of the general approach is that for large or complex spreadsheets, the time required to calculate the possible reasons of a fault can exceed the time that is acceptable in an interactive setting. Therefore, two new algorithmic enhancements are proposed to speed up the computation (Chapter 3). First, in Section 3.1 a new approach is presented to efficiently search for so-calledconflicts, which are sets of formulas in a spreadsheet that cannot all be correct at the same time [Shc+15b]. Second, the general MBD algorithm is parallelized to utilize the full computational capabilities of modern computer hardware (Section 3.2) [Jan+16b].
The other limitation of the general MBD approach is addressed in Chapter 4. De-pending on the provided test cases too many possible reasons for a fault can be returned by the diagnosis algorithm so that a user cannot inspect all of them in reasonable time. Therefore, in [Shc+16b] a new algorithm is presented to efficiently determine questions that can be asked to the user interactively in order to reduce the number of possible reasons and to finally find the true reason of the observed unexpected output.
One open challenge that all research about spreadsheet QA faces is how to evaluate new approaches in a way that allows to draw conclusions about the effectiveness of the approach in real-world settings. Currently most approaches for spreadsheet debugging are evaluated on real-world spreadsheets which are altered by the re-searchers so that they contain faults. However, whether or not these artificially injected faults are representative for faults encountered in the real world remains unknown. Therefore, in Chapter 5 a work is presented in which the publicly available spreadsheets and emails of the Enron company are used to search for real faults and to build a corpus of these real-life faulty spreadsheets [Sch+16a].
1.4 Publications
This thesis by publication includes six of the author’s publications. In this section, the individual contributions of the author are stated for each publication. The complete list of the author’s publications can be found in the appendix.
1.4.1 Avoiding, Finding and Fixing Spreadsheet Errors – A Survey
of Automated Approaches for Spreadsheet QA
Dietmar Jannach, Thomas Schmitz, Birgit Hofer, and Franz Wotawa. “Avoiding, Finding and Fixing Spreadsheet Errors - A Survey of Automated Approaches for Spreadsheet QA”. in:Journal of Systems and Software94 (2014), pp. 129–150
This survey was a joint effort with Dietmar Jannach, Birgit Hofer, and Franz Wotawa. The author of this thesis searched for most of the relevant works, categorized all of them, and wrote parts of the text.
1.4.2 Model-Based Diagnosis of Spreadsheet Programs
Dietmar Jannach and Thomas Schmitz. “Model-Based Diagnosis of Spreadsheet Programs: A Constraint-based Debugging Approach”. In: Automated Software Engineering23.1 (2016), pp. 105–144
This work was written together with Dietmar Jannach. The approach presented in this paper is based on a preliminary work by Dietmar Jannach, Arash Baharloo, and David Williamson [Jan+13]. The author of this thesis designed the parallelization techniques in collaboration with Dietmar Jannach, did the implementations that were required in addition to the previous work, designed and performed the evaluations as well as the user study, and wrote the corresponding parts of the text.
1.4.3 MergeXplain: Fast Computation of Multiple Conflicts for
Diagnosis
Kostyantyn Shchekotykhin, Dietmar Jannach, and Thomas Schmitz. “MergeXplain: Fast Computation of Multiple Conflicts for Diagnosis”. In: Proceedings of the International Joint Conference on Artificial Intelligence (IJCAI 2015). 2015, pp. 3221– 3228
The research of this work was a joint effort with Kostyantyn Shchekotykhin and Dietmar Jannach. The proposed MERGEXPLAINalgorithm was designed in a collabo-ration between Kostyantyn Shchekotykhin and the author of this thesis, who also implemented and evaluated it.
1.4.4 Parallel Model-Based Diagnosis on Multi-Core Computers
Dietmar Jannach, Thomas Schmitz, and Kostyantyn Shchekotykhin. “Parallel Model-Based Diagnosis On Multi-Core Computers”. In: Journal of Artificial Intelli-gence Research55 (2016), pp. 835–887
The paper is the result of a joint work with Dietmar Jannach and Kostyantyn Shchekotykhin. The author of this thesis designed the parallelization approaches together with Dietmar Jannach, implemented and evaluated them, and wrote parts of the text.
1.4.5 Efficient Sequential Model-Based Fault-Localization with
Partial Diagnoses
Kostyantyn Shchekotykhin, Thomas Schmitz, and Dietmar Jannach. “Efficient Sequential Model-Based Fault-Localization with Partial Diagnoses”. In: Proceedings of the International Joint Conference on Artificial Intelligence (IJCAI 2016). 2016, pp. 1251–1257
The work was a joint effort with Kostyantyn Shchekotykhin and Dietmar Jannach. Most parts of the text were written by the author of this thesis who also contributed to the design of the new approach, implemented, and evaluated it.
1.4.6 Finding Errors in the Enron Spreadsheet Corpus
Thomas Schmitz and Dietmar Jannach. “Finding Errors in the Enron Spreadsheet Corpus”. In: Proceedings of the IEEE Symposium on Visual Languages and Human-Centric Computing (VL/HCC 2016). 2016, pp. 157–161
This paper was written together with Dietmar Jannach. The author of this the-sis designed the different approaches to search for faults in the spreadsheets in collaboration with Dietmar Jannach and wrote the text of the paper.
2
Model-Based Diagnosis for
Spreadsheets
One of the possible ways presented in Section 1.2 to assure the quality of a spread-sheet is to do systematic testing. In order to systematically test a spreadspread-sheet a user has to write so-calledtest casesby specifying the input values of the spreadsheet and expected values for some of its formula cells. If these expected values differ from what the spreadsheet environment actually computes given the input values, there has to be a fault somewhere in the formulas of the spreadsheet. In this case the task of spreadsheet debugging is to locate the fault, for example, by utilizing a debugging approach like Model-Based Diagnosis (MBD), which can be used to find the possible reasons of the unexpected calculation outcomes. How MBD can be applied to spreadsheets is described formally in [Jan+16a] and summarized in this chapter.
The principles of the general MBD technique were proposed in the 1980s [Kle+87; Rei87]. In these early works, MBD was used to search for faults in digital circuits. It can, however, be used to debug any kind of observable system for which the func-tionality can be simulated in a deterministic way. The system requires information about the expected behavior of the individual components of the system and how these components are connected. If there is a discrepancy between the simulated expected behavior of the system and an observation of its real behavior, the task of the MBD approach is to determine the sets of components that could possibly be the reason of this discrepancy. These candidates that, if assumed to behave in a faulty way, explain the faulty behavior of the system are calleddiagnoses. Formal definitions of diagnoses and other terms relevant in the MBD setting are given in [Jan+16a], which is included in this thesis by publication.
In the context of spreadsheets, the system is described as a set of formulas that represent the diagnosable components of the system. The observations are given as a test case that specifies the input values of the spreadsheet and some expected output values of the formulas. If there is a discrepancy between the specified test case and the calculated outcomes of the formulas given the same inputs, MBD can be used to find the sets of formulas that can be the reason for the observed discrepancy.
2.1 Introductory Example
In this thesis, a small example spreadsheet is used to explain how the MBD technique can help to determine the possibly faulty formulas in that spreadsheet. The formulas of the example spreadsheet are shown in Figure 2.1. Assume that the spreadsheet developer forgot to add the value of A1 in the formula of cell C1.
2 1 Should be =B1*B2+A1 A B C ? ? =A1*3 =A2*5 =B1*B2
Figure 2.1: A faulty spreadsheet.
If the user enters some values for the input cells in column A, as shown in Figure 2.2, he or she could realize that the result in cell C1 is wrong, because it should be305for the given input values. The values for the two input cells together with the expected output value therefore form a test case that describes a discrepancy between the expected and the observed behavior of the spreadsheet.
2 1 Should be 305 A B C 5 4 15 20 300
Figure 2.2: A test case for the faulty spreadsheet.
Once the user has detected the discrepancy, he or she can use the MBD approach to locate the possible reasons that can explain it. With the test case shown in Figure 2.2, the MBD approach would return two diagnoses as the possible reasons for the observed discrepancy: {C1}and{B1,B2}. This means that either the formula in cell C1 is faulty or that the two formulas in the cells B1 and B2 both have to be faulty. In this example,{C1}is the true diagnosis as the formula of cell C1 is in fact faulty. The diagnosis {B1,B2} is therefore not true. In general, it is more unlikely that diagnoses containing multiple cells are true, because it would require the developer to have made multiple errors instead of just one.
The rationale behind the diagnoses is the following. The formula in C1 can be changed in a way that the result of the calculation would be305, for example, by changing the formula to “=B1*B2+A1”, “=B1*B2+5”, or “=305”. Therefore{C1} is a diagnosis. {B1}, however, cannot be a diagnosis because changing the formula in B1 alone cannot result in the expected value in C1, assuming that only integer values are used as in the given test case. The same is true for cell B2. Both cells B1 and B2 have to be changed in order to achieve the expected result of305in C1 and therefore{B1,B2}is another diagnosis.
2.2 Computation of the Diagnoses
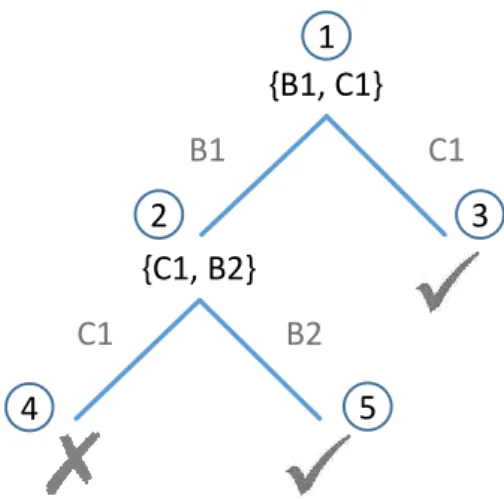
In [Rei87] Reiter proposes an algorithm to build aHitting Set Tree(HS-Tree) in order to determine the diagnoses of a faulty system under observation. The algorithm uses the concept ofconflicts, which are sets of components of the system that cannot all be correct at the same time given the observations. In the example spreadsheet of Section 2.1 there are two of these conflicts, namely{{B1,C1},{C1,B2}}. This means that the formulas of B1 and C1 cannot be both correct as well as the formulas of C1 and B2. The reason is that if, for example, both B1 and C1 would be assumed to be correct, the calculation could not result in the expected value. The same is true for the two formulas C1 and B2.
The idea of the HS-Tree algorithm is to systematically test different hypotheses about the health state of the components. As the algorithm progresses, it tests hypotheses involving more and more components that are assumed to be faulty. In the beginning it therefore assumes that everything is working correctly. If this assumption does not hold because the expected behavior conflicts with the observed behavior, the algorithm systematically tries to resolve all conflicts by assuming that at least one component of each conflict is faulty. To achieve this, the algorithm builds a tree in breadth-first manner to search for the hitting sets of the conflicts, i.e., sets that “hit” every conflict of the system. In his work Reiter showed that these hitting sets correspond to the diagnoses. To find the hitting sets efficiently, the algorithm utilizes a set of tree pruning rules to cut subtrees that cannot lead to further diagnoses. The resulting HS-Tree for the example spreadsheet is shown in Figure 2.3 and explained in the following. {B1, C1} B1 C1 {C1, B2} C1 B2 1 2 3 4 5
Figure 2.3: The resulting HS-Tree for the example spreadsheet.
At node 1 , the algorithm searches for a conflict when all components (formulas) are assumed to be correct. To determine the conflicts, some kind of conflict detection technique is required that can calculate a conflict for the given system. For the
example spreadsheet, assume that such a conflict detection technique would return one of the existing conflicts, for example,{B1,C1}. Node 1 is then labeled with the found conflict and the algorithm will expand the search tree for each component inside this conflict.
For node 2 , the algorithm assumes the formula of B1 to be faulty and therefore checks if the spreadsheet still has a conflict when the formula of B1 is ignored. Since the spreadsheet has another conflict{B2,C1}, this conflict will be found this time and node 2 will be labeled with the newly found conflict. At node 3 , C1 is assumed to be faulty, as shown in Figure 2.3. Because no other conflict remains when the formula of C1 is ignored, the algorithm has found the diagnosis{C1}and the node is labeled with a check mark.
On the next level, the HS-Tree algorithm expands node 2 by creating two new nodes for the components of the conflict found for this node. Node 4 , however, does not have to be further inspected and is closed, since for this node the resulting diagnosis {B1,C1}would be a superset of the already found diagnosis{C1}and is thus not relevant. Last, at node 5 the formulas of both cells B1 and B2 are considered to be faulty and the diagnosis{B1,B2} is found, as no other conflict remains. Since all leaf nodes now either result in a diagnosis or are closed, the algorithm is finished and has found the two diagnoses{C1}and{B1,B2}.
To compute the conflicts, different conflict detection techniques can be used. How-ever, in order for the original HS-Tree algorithm of Reiter to work correctly, the mini-mality of the returned conflicts has to be ensured, because the algorithm was faulty regarding the use of non-minimal conflicts. In [Gre+89] Greiner et al.proposed an extension to the original algorithm to correct it in cases in which non-minimal conflicts are returned by the used conflict detection technique. In the implementa-tions discussed in this thesis, however, QUICKXPLAIN [Jun04] and MERGEXPLAIN [Shc+15b] are used to compute the conflicts. Since both of these techniques are guaranteed to only return minimal conflicts, the correction by Greineret al.is not required.
2.3 An Interactive Tool for Model-Based Spreadsheet
Debugging
In order to test and evaluate the proposed approaches with users on real-world spreadsheets, the Model-Based Diagnosis approach for spreadsheets was imple-mented as an extension to Microsoft Excel, called EXQUISITE. An overview of the tool is shown in Figure 2.4.
Test case management
Debugging & diagnosis functions
Cell & formula information
Open issues & results
Annotating values Visual indicators
Figure 2.4: EXQUISITE, a Model-Based spreadsheet debugging tool [Jan+16a].
Exquisite: In the following an exemplary usage of EXQUISITEis described. When the debugging mode is started the tool automatically colors the cells according to their role in the spreadsheet. Input cells are colored in green, intermediate calculations in yellow, and output cells in orange. This colorization alone can help the user to spot some kinds of faults, for example, range errors or unused inputs, which are not highlighted. The user can then enter values for the input cells without overriding the values of the original spreadsheet and state expected values for the interim and output cells. The annotated values are shown as a list next to the spreadsheet and are also highlighted in the spreadsheet with a check mark for correct values and a cross for faulty values. The specified test cases can be saved and loaded at later times to support the test case specification over multiple sessions. Once a user detects a discrepancy between the expected and the observed behavior of the spreadsheet, he or she can start the debugging functionality. The system will then determine the diagnoses and present them as a list in the results section, which the user can inspect. By clicking on an item of the list, the cells containing the possibly faulty formulas are highlighted in the spreadsheet and arrows point to their precedents as well as dependents.
A preliminary version of the tool was already presented in [Jan+13]. In [Jan+16a] improvements to the tool as well as the algorithms behind it are presented and the performance of these new algorithmic approaches is evaluated (see Chapter 3).
User study: To evaluate if the MBD approach is advantageous for the users to debug a faulty spreadsheet, also a user study was performed. In this study, 24 participants had to locate a fault in a profit calculation spreadsheet. The participants were randomly split into two groups and were given a description about how the spreadsheet should work and an example with values that the spreadsheet should calculate. The first group had to locate the fault without using EXQUISITE, while the second group was introduced to the functionality of the add-in and used it to calculate a set of formulas that could be the reason of the fault. In both cases the users had to inspect the formulas which they thought to be faulty in order to find out what the real fault was.
The results of the study show that EXQUISITEcan indeed help to locate faults in a spreadsheet. The participants using the tool found the injected fault faster on average than the participants not using it (less than 3 minutes compared to more than 9 minutes). In addition, of the participants not using the tool, 33% were not able to locate the fault at all in the given time frame of 30 minutes.
3
New Algorithmic Approaches for
Faster Calculation of Diagnoses
The general MBD approach proved to be promising for spreadsheet debugging. However, for complex or large spreadsheets the time required to calculate the diagnoses can exceed the time that is acceptable in an interactive setting, in which a user expects a result almost instantly or at most after a few seconds. Therefore, in the next two sections two new algorithmic approaches to speed up the calculation of diagnoses are summarized. The full papers can be found in the appendix of this thesis by publication.
3.1 Faster Conflict Detection
As discussed in Section 2.2, the HS-Tree algorithm relies on some conflict detection technique that calculates the conflicts. The HS-Tree algorithm then uses these conflicts to determine the diagnoses. QUICKXPLAIN[Jun04] is an efficient divide-and-conquer technique proposed by Junker to determine such conflicts. For large or complex spreadsheets, however, many conflicts can exist. In these cases the HS-Tree algorithm will call QUICKXPLAINeach time a new conflict is required, i.e., when all known conflicts are already solved at the current node of the tree. Since QUICKXPLAINonly returns a single conflict for each call, the search for conflicts has to be “restarted” each time.
MergeXplain: To speed up the overall calculation of diagnoses and to solve the problem of the slow “restart” of the conflict search, in [Shc+15b] a new approach, called MERGEXPLAIN, is proposed that can calculate multiple conflicts in a single call. The rationale of this technique is that more time is spent to efficiently search for conflicts at the beginning of the calculation of diagnoses and in return the search for conflicts does not have to be restarted so often when the HS-Tree is built, because in most cases one of the previously found conflicts can be reused.
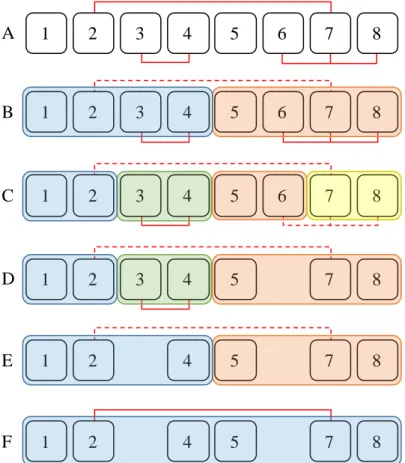
An example of how MERGEXPLAINsearches for conflicts is shown in Figure 3.1 and explained in the following. In the example the faulty system has 8 components or
1 2 3 4 5 6 7 8 1 2 3 4 5 6 7 8 1 2 3 4 5 7 8 1 2 4 5 7 8 1 2 4 5 7 8 A B D E F 1 2 3 4 5 6 7 8 C
Figure 3.1: Example of MERGEXPLAIN searching for three conflicts shown as red lines between the components1to8.
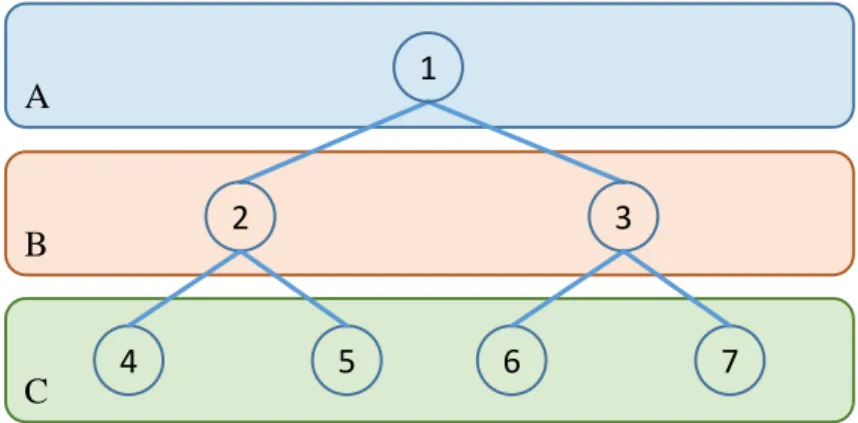
formulas. The system has 3 conflicts and the goal of MERGEXPLAIN is to find at least one of them or more, if possible. The conflicts, shown as red lines in Figure 3.1, are{2,7},{3,4}, and{6,7,8}. First, MERGEXPLAINrecursively splits the sets of components into two separate sets, as long as the components of the set still contain at least one conflict. Because of this step, subsets of the components that do not contain any conflicts can be quickly excluded from further examinations.
Since the 8 components of the system contain a conflict (step A), they are split into two sets (step B). In step C, both sets are split again, because they both still contain a conflict. This time, however, on the right-hand side the last conflict, shown as a dotted line in Figure 3.1, was split and thus the two sets{5,6}and {6,7}both do not contain a conflict anymore. Therefore, the algorithm re-combines them and uses Junker’s QUICKXPLAINto locate a conflict in this set of components. As this set of components would not have been split if it did not contain any conflict, it is known to contain one conflict at least. In addition, because this set of components resulted from repetitive splitting of the original components and thus it is comparatively small, QUICKXPLAINwill find the conflict{6,7,8}rather quickly. After this conflict has been found, one of the conflict’s components, for example, component 6, is removed from further investigations to resolve the current conflict and QUICKXPLAIN
is iteratively called again in order to find another conflict, if one exists (step D). In step E, the same was done for the left-hand side of the components and here the conflict{3,4}was found. Since no more conflicts remain in both halves of the components, the algorithm continues to merge the two sets of components again and searches for the last remaining conflict (step F).
A detailed description of the MERGEXPLAINalgorithm can be found in [Shc+15b], which is included in this thesis by publication. In this paper, it is proven that MERGE -XPLAIN will only return minimal conflicts because it internally uses QUICKXPLAIN, which also only returns minimal conflicts. MERGEXPLAINis also proven to always return at least one conflict or more. However, because it is not guaranteed to return all existing conflicts of a diagnosable system, MERGEXPLAIN still has to be called multiple times when used to determine the conflicts that are required to calculate the diagnoses.
Evaluation: To evaluate the proposed approach it was compared to QUICKXPLAIN when used by the HS-Tree algorithm to calculate a small subset of the diagnoses [Shc+15b]. The different tested systems contained digital circuits, Constraint Satisfaction Problems (CSPs), spreadsheets, as well as artificial systems to simulate different problem characteristics. The average reductions of the calculation times are summarized in Table 3.1.
Table 3.1: Average reductions of computation times when using MERGEXPLAINcompared to QUICKXPLAINto search for five diagnoses with the HS-Tree algorithm [Shc+15b].
System type Avg. reduction
Digital circuits 27%
Constraint Satisfactions Problems 22%
Spreadsheets 15%
Simulation experiments 42%
The efficiency of the approach very much depends on the structure of the problem and thus the improvements vary for the individual problems. Although for some problem instances no speedups could be achieved, for others the time required to calculate the diagnoses could be reduced by up to 54%. Therefore, additional simulation experiments were performed, in which artificial problems with different characteristics were tested. The goal of this evaluation was to find out which problem characteristics lead to the highest performance improvements. Among others, one result is that depending on the characteristics of the conflicts MERGEXPLAIN can achieve improvements of up to 76% over QUICKXPLAINwhile for other characteristics it results in the same performance. Details of the evaluation can be found in [Shc+15b].
3.2 Parallelizing the Calculation of Diagnoses
In addition to improving the calculation of conflicts, the overall search for diagnoses can be enhanced as well. The HS-Tree algorithm only expands one node of the search tree at a time and only a single thread is used for the calculation. As modern computers, laptops, and even smartphones have multiple computation cores, the tree construction process can be parallelized by expanding multiple nodes of the search tree at the same time. Thereby, the full potential available in today’s hardware architectures is utilized. In [Jan+16a; Jan+16b] different approaches to parallelize the HS-Tree algorithm were proposed. In this section two of these approaches are presented: Level-Wise ParallelizationandFull Parallelization.
Level-Wise Parallelization: The original HS-Tree algorithm proposed in [Rei87] uses several tree pruning rules to reduce the search space (see Section 2.2 for an example). As these pruning rules require that the nodes of the search tree are expanded in the correct order, the parallelization of the HS-Tree algorithm is not trivial.
Therefore, the main idea of the first parallelization approach presented in this thesis, called Level-Wise Parallelization (LWP), is to mostly keep the order in which the nodes are expanded intact. To achieve this goal, all nodes on the same level are expanded in parallel and the algorithm continues with the next level once all nodes of the previous level are finished. An example of how LWP works is shown in Figure 3.2 and explained in the following.
C B 1 2 4 5 3 6 7 A
Figure 3.2: Exemplary schedule of the Level-Wise Parallelization technique with three scheduling steps A to C.
In the first step (A), only node 1 can be processed, as no other nodes exist yet. When the first node is created, nodes 2 and 3 are expanded in parallel (B) and the algorithm waits until the expansions of both nodes are finished. After both nodes are created, the algorithm continues with the third level (C) and processes all nodes of this level in parallel. As all nodes of the previous level were finished
before the expansion of the new level began, all pruning rules of Reiter’s HS-Tree algorithm [Rei87] can be applied. In addition, synchronization between threads is only required to ensure that no thread explores a path that is already being explored by another thread. The soundness and completeness of LWP is proven in [Jan+16b], which can be found in the appendix of this thesis.
The main advantage of the LWP approach is that it provides a way to parallelize the construction of nodes in the search tree while requiring only little synchronization to ensure the correctness of the tree pruning rules. However, if some node of a level needs more time to expand than the other nodes of the same level, it can happen that the algorithm has to wait for this single node before the expansion of the next level can start.
Full Parallelization: The main idea of the Full Parallelization (FP) approach is not to wait at the end of a level but to continue with the expansion of the nodes of the next level, even though the previous level has not been finished. An example of the parallel expansion progress is shown in Figure 3.3.
C B 1 2 4 5 3 6 7 A D
Figure 3.3: Exemplary schedule of the Full Parallelization technique with four scheduling steps A to D.
The FP algorithm always schedules all available nodes for parallel expansion and thus does not use discrete scheduling steps anymore that correspond to the levels of the search tree. In the example the algorithm expands nodes 2 and 3 in parallel (B), after node 1 is finished, as LWP does. After one of these nodes is finished, for example node 2 , the algorithm immediately continues to expand the child nodes 4 and 5 of the finished parent (C) and does not wait at the end of the level like LWP. After node 3 is finished the algorithm can queue nodes 6 and 7 for expansion in addition to the nodes that are still being expanded (D).
It can happen that nodes of a previous level are still expanding when nodes on the next level are already finished. In some of these cases an already expanded node should be pruned according to the tree pruning rules. Therefore, after the expansion
of every node the algorithm has to check if some of the other already created nodes should be removed again because of the newly obtained information. In [Jan+16b] the details of FP as well as a proof of its correctness are given.
In comparison to LWP, FP has the advantage that it does not have to wait for single nodes at the end of a level. However, FP has to perform some additional checks and an additional synchronization between the threads to ensure the correctness of the approach. In cases in which the last nodes of each level finish at the same time, LWP could therefore be faster than FP, because it has less overhead.
Evaluation: In [Jan+16b] LWP and FP were evaluated on different system types in comparison to the sequential HS-Tree algorithm. Table 3.2 summarizes the average reductions of the computation times that could be achieved when 4 threads were used for the parallelized algorithms.
Table 3.2: Average reductions of the computation times of LWP and FP using 4 threads compared to the sequential HS-Tree algorithm [Jan+16b].
System type LWP FP
Digital circuits 45% 65%
Constraint Satisfactions Problems 39% 40%
Spreadsheets 48% 50%
Ontologies 38% 36%
Simulation experiments 69% 70%
For the tested spreadsheets the required calculation times could be reduced by about 48% for LWP and 50% for FP on average. This means that the required calculation time was halved using the proposed parallelization techniques. Although these reductions are below the theoretical optimum of 75% when using 4 threads on a computer with 4 computation cores, the results are still encouraging as good speedups could be achieved by the proposed approaches, which utilize the full potential of the available hardware.
4
Sequential Diagnosis
Model-Based Diagnosis approaches determine all possible reasons of a discrepancy between the expected and the observed calculation outcomes of a spreadsheet. For large or complex spreadsheets and depending on the provided test cases, however, it can happen that too many diagnoses are returned by these techniques so that a user cannot inspect all of them manually.
To find the true reason of the discrepancy, calledpreferred diagnosis, one possible approach is to reduce the number of diagnoses by iteratively asking the user for new information. This technique is called sequential diagnosisand is depicted in Figure 4.1. The new information obtained through the queries can include new observations about correct or faulty values or state the correctness of some formulas. The statements are then added to the knowledge about the spreadsheet and with their information new diagnoses can be determined that are more precise than the previous ones. Diagnosis problem Preferred diagnosis else |diags|=1 Calculate diagnoses Ask query to the user Calculate query Update knowledge
Figure 4.1: The sequential diagnosis approach [Shc+16c].
4.1 The General Sequential Diagnosis Approach
The general idea of using additional measurements to reduce the number of diag-noses was already proposed in the early works of MBD [Rei87; Kle+87]. De Kleeret al.additionally presented a method to determine the next best query to ask to the user [Kle+87]. In several later works including [Fel+10; Shc+12; Shc+16b] this
method was used and improved. In this thesis, the sequential diagnosis approach is summarized based on the description in [Shc+16b], which can be found in the appendix. Although in this paper sequential diagnosis is not used for the spreadsheet setting, it can be easily applied to spreadsheets as shown in this section.
The goal of most sequential diagnosis approaches is to find the true reason of an observed fault with as few queries as possible. Since the system cannot predict how the user will answer a query, it tries to choose a query that will eliminate as many diagnoses as possible regardless of the user’s answer. To do so, first, the system calculates a set of diagnoses with the currently available knowledge. Next, it splits the set of diagnoses into two sets that have the same value based on some criteria. The value of a set of diagnoses can, for example, be determined by using the number of formulas contained in these diagnoses or by using the probabilities of the individual formulas being faulty, if this information is available. Once such a partition is found, the system tries to find a query to discriminate between these two sets, i.e., a query for which one set of the diagnoses remains if the user answers “yes” and the other set remains if the user answers “no”. If no such query can be found, the system tries the next best possible partition and continues until a partition is found for which a query exists.
The calculated query is then presented to the user who has to evaluate and answer it. The information gained from the user’s answer is added to the knowledge about the spreadsheet and the process is repeated until only a single diagnosis remains that is then known to be the true reason of the observed fault.
4.2 Speeding Up the Query Calculation
For large systems determining the next query can take too long in the interactive sequential diagnosis process. The reason is that a set of diagnoses is required to determine the next query. Although it was shown that a set of 9 diagnoses is sufficient to determine a good query [Shc+12], for larger systems calculating these 9 diagnoses can already exceed acceptable times.
Algorithmic approach: In [Shc+16b] a new algorithmic approach was presented to speed up the calculation of the diagnoses required to determine the next query. The approach builds upon the new concept of so-called partial diagnoses. These partial diagnoses are, as the name suggests, subsets of real diagnoses. The idea of using partial diagnoses is to search for conflicts only once during the HS-Tree construction, for example using MERGEXPLAIN (see Section 3.1), and to use the found conflicts to determine partial diagnoses without checking if they fully explain
the observed fault. Since the found conflicts are a subset of all conflicts of the system, the partial diagnoses determined because of these conflicts will also be subsets of the (complete) diagnoses of the system. Therefore, queries that help to discriminate between the calculated partial diagnoses will also help to reduce the number of (complete) diagnoses.
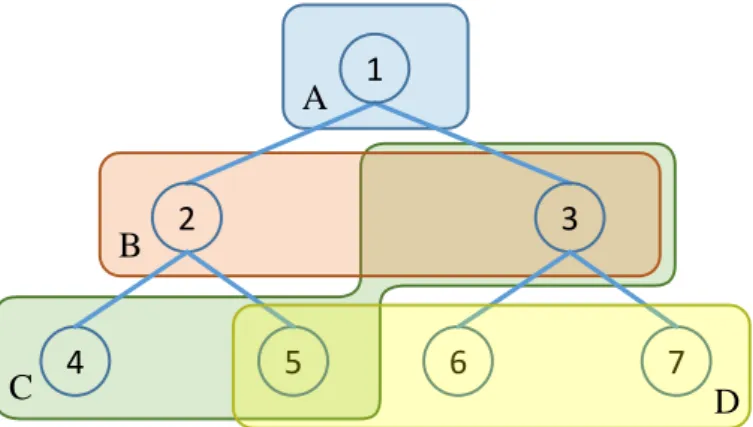
If we would have, for example, a system with components 1 to 8 and conflicts {{2,7},{3,4},{6,7,8}}, as used in the example of Section 3.1, the (complete) di-agnoses for this system would be{{3,7},{4,7},{2,3,6},{2,3,8},{2,4,6},{2,4,8}}. If we now assume that we only computed 2 of these 3 conflicts, for example,{{2,7},
{3,4}}, we could determine the partial diagnoses {{2,3}, {2,4}, {3,7}, {4,7}}. These partial diagnoses are all subsets of complete diagnoses. In fact, 2 of these partial diagnoses are even complete although only 2 of the 3 conflicts of the system were used to calculate them.
2 7 3 4
Determine some conflicts:
Calculate partial diagnoses: 2 3 2 4 3 7 4 7
Find preferred partial diagnosis: 2 4
Determine more conflicts: 6 7 8
Calculate partial diagnoses: 2 4 6 2 4 8
Find preferred partial diagnosis: 2 4 6
Figure 4.2: Example of the sequential diagnosis process using partial diagnoses.
The concept of partial diagnoses can be utilized in the sequential diagnosis process using the following technique [Shc+16b]. An example of the process is shown in Figure 4.2. First, the algorithm searches for a set of conflicts in the given faulty system using MERGEXPLAINor some other conflict detection technique that is in the best case able to efficiently determine multiple conflicts and will find, for example, the conflicts{2,7} and {3,4}. The found conflicts are then used to determine a limited number, for example, 9, of partial diagnoses. In the example of Figure 4.2, however, only 4 partial diagnoses can be calculated because of the found conflicts. The system uses these partial diagnoses to determine queries to ask to the user in
the same way as the general sequential diagnosis approach does (see Section 4.1). The process of calculating the partial diagnoses, determining a query, and asking it to the user is repeated until only a single partial diagnosis can be found, for example, {2,4}. This partial diagnosis is then called the preferred partial diagnosis and is known to be a subset of the true reason of the observed fault. The algorithm then continues to search for an additional set of conflicts with MERGEXPLAINand repeats the process for these new conflicts. In the example, the new conflict{6,7,8}is found. The component7, however, was already excluded because of the previously asked questions and is thus ignored. Therefore, only 2 partial diagnoses can be calculated with the new conflict and the system asks another query to find the preferred partial diagnosis among them. Since no more conflicts can be found in the next step, the preferred partial diagnosis determined this way is known to be a complete diagnosis and the true reason of the fault. In [Shc+16b], which is included in this thesis, the details of this technique are described and its correctness is proven.
Evaluation: To evaluate the new approach it was compared to another technique that calculates diagnoses directly without using the concept of conflicts and was shown to be efficient in [Shc+12]. The average reductions in computation time, number of queries, and number of queried statements, which were asked in the queries, are shown in Table 4.1 for the two tested types of systems.
Table 4.1: Average reductions of the computation time, number of queries, and number of queried statements of the new approach presented in [Shc+16b] compared to the technique presented in [Shc+12]. Values in parentheses show the reductions for systems that require more than a second to compute.
System type Time #Queries #Statements
Digital circuits 61% (81%) 30% 1%
Ontologies 83% (88%) 4% 5%
The results show that using partial diagnoses significantly reduces the time required to calculate the queries. This reduction in time is even bigger for those systems that require more than a second to compute (shown in parentheses in Table 4.1). For the most complex digital circuit, the technique proposed in [Shc+12] was not able to find the true reason of the fault after 24 hours while the new approach needed about 40 minutes. Regarding the number of required queries and queried statements in order to find the true reason of the fault, using partial diagnoses resulted in about the same numbers as the compared approach except for the number of queries for the digital circuits. For these systems the new approach was able to reduce the number of required queries by 30%. This means that using partial diagnoses does not lead to an increased amount of effort required by the user.
5
Creating a Corpus of Faulty
Spreadsheets
Most of the approaches for fault detection in spreadsheets are evaluated on real-world spreadsheets in which the researchers inserted faults manually or based on randomly mutating the formulas [Jan+14a]. Although these evaluations are a good indicator to show that the tested approaches could theoretically help to locate faults in the spreadsheets, whether these approaches would work for spreadsheets with real faults cannot be evaluated with certainty based on these artificial faults.
To assess the quality of new approaches for fault detection in practice, spreadsheets are required that contain formula faults made by real users. An additional challenge is that although many real-world spreadsheets probably contain faults, it has to be known where these faults are in order to evaluate if the techniques for spreadsheet debugging are able to detect them. Therefore, we need to know which formulas are faulty and how they should be corrected.
5.1 Types of Spreadsheets Used in Research
In the research literature about fault detection in spreadsheets, three different types of spreadsheets with fault information are used to evaluate the efficiency or effectiveness of the approaches. Examples of these evaluations are given in [Jan+14a]. The different types of spreadsheets used in existing evaluations can be summarized as follows:
• Artificial spreadsheets with artificial faults: These spreadsheets were de-signed by the researchers in order to evaluate their new approach. Often, such spreadsheets are inspired by real-world spreadsheets, but are much simpler and did not evolve over time. In addition, as the faults were artificially inserted by the researchers, evaluations solely based on these spreadsheets can only serve as a first indicator for the quality of the approach.
• Artificial spreadsheets with real faults: Spreadsheets of this category are created in spreadsheet development experiments, see [Pan00] for examples.
In these experiments the participants have to develop a spreadsheet to fulfill a given task. After the experiment, the experimenters can then check the created spreadsheets for faults as the expected behavior of the spreadsheets is well defined. Although the faults found this way are real, the spreadsheets themselves are artificial because they were only created for the experiment and it is not known how well the specified task fits to the tasks encountered in practice.
• Real-world spreadsheets with artificial faults: Most of the approaches for fault detection in spreadsheets are evaluated on spreadsheets of this category. These spreadsheets were used in the industry to solve real tasks and are thus a good example of what kind of spreadsheets can be found in the real world. Although many of these spreadsheets probably contain faults, no information about the contained faults is available, as the semantics of a spreadsheet cannot be reconstructed with certainty. Therefore, researchers insert artificial faults in these spreadsheets in order to use them for their evaluations.
As all of these spreadsheet types are not sufficient to fully evaluate the functionality of new approaches in the real world, spreadsheets of the fourth possible type are desirable.
• Real-world spreadsheets with real faults: The ideal spreadsheets to be used in an evaluation of a new fault detection approach are real-world spreadsheets for which the information about the contained real faults is available, i.e., the spreadsheets have faults made by real users and it is known which formulas are faulty and what the correct formulas should be. Since the spreadsheets of this category have been used to solve real tasks and their faults were made by real users, they represent good examples of faults that should be detected by all testing and fault localization techniques.
5.2 Publicly Available Spreadsheet Corpora
Because companies usually do not publish their internal spreadsheets as they possibly contain confidential information, researchers have to use corpora of spreadsheets that are publicly available in order to evaluate new approaches. In this section, a list of publicly available spreadsheet corpora is given.
EUSES corpus: The most widely used corpus in fault detection research for spread-sheets is the EUSES corpus [Fis+05]. It was created to assist researchers in evaluat-ing new spreadsheet QA approaches and contains 4,498 spreadsheets obtained by a
Google web search with different search terms related to business and education. The spreadsheets can be considered to be authentic although some of them might have been created for showcase purposes. The drawback of this corpus is that no information about the contained faults is available so that in order to use it for evaluations of fault detection techniques artificial faults have to be inserted.
Fuse corpus: Similar to the EUSES corpus, the Fuse corpus contains spreadsheets found through a web search. In their work [Bar+15], Barik et al. give an ex-act description of how the corpus can be obtained to ensure reproducibility and extensibility. The extensive web search led to a corpus of 249,376 spreadsheets.
Info1 corpus: The Info1 corpus was created during a spreadsheet development exercise and contains 119 faulty versions of 2 different spreadsheets. Since the in-tended semantics of the spreadsheets are known, the faults made by the participants could be identified and the information about the contained faults is included in the corpus. However, the spreadsheets of this corpus cannot be considered to reflect spreadsheets from the industry, because they were developed in an exercise. The corpus is described in [Get15] and can be obtained from [Inf].
Payroll/Gradebook corpus: This corpus originally consisted of spreadsheets devel-oped in the academic Forms/3 spreadsheet environment. These artificial spread-sheets with injected faults were used in a user study in which 20 participants had to debug and test two different spreadsheets [Rut+06]. In addition to the information about the faults, the (possibly faulty) test cases created by the users are available. An MS Excel version of this corpus can be obtained from [Pgc].
Enron corpus: The Enron Corporation was one of the biggest companies in the US and one of the world’s major electricity and gas companies. When it went bankrupt in 2001, a big accounting fraud was revealed, which is known as the Enron scandal. In the process of the investigations, all emails sent from or to Enron between 2000 and 2002 were published in 2003. In [Her+15] Hermans and Murphy-Hill extracted 15,770 spreadsheets contained in these emails and published them as the Enron corpus. Since all of these spreadsheets were sent in emails related to the business of Enron, they can be considered real-world spreadsheets. Again, no information about the contained faults is available.
Of all publicly available spreadsheet corpora, none contains both real-world spread-sheets and information about real faults.
5.3 Building a Real-World Spreadsheet Corpus with
Fault Information
Although multiple spreadsheet corpora are available to evaluate new approaches in spreadsheet QA, there is still a need for a corpus that consists of real-world spreadsheets combined with information about the real faults that are contained in these spreadsheets.
In this thesis, a new method is presented to build such a corpus based on the available spreadsheets and emails of Enron. The spreadsheets of the Enron corpus were used in practice and as spreadsheets are error-prone, at least some of them will contain faults made by the users. Because the spreadsheets were sent as email attachments, the information of the spreadsheets can be combined with the information given in the emails. The following aspects can be used to detect real faults in the spreadsheets of the Enron corpus:
• In the emails to which the spreadsheets are attached, the text message can include some descriptions about the spreadsheets. In these descriptions faults in the spreadsheets can be mentioned that, for example, were detected or fixed.
• In many cases, multiple versions of the same spreadsheet were sent over time that only differ in a few cells. If from one version to another only a single or a few formulas have been changed and the rest of the spreadsheet was kept unchanged, these changes could be the result of a fault correction by the user.
5.3.1 Fault Detection Methods
In [Sch+16a], two techniques are presented to help a researcher detect faults in the spreadsheets of the Enron corpus. The techniques were designed to combine the information given in the emails and in the spreadsheets themselves. However, the approach is not limited to the emails of the Enron corpus and can be applied to any corpus of emails containing spreadsheets, because no domain-specific knowledge is required.
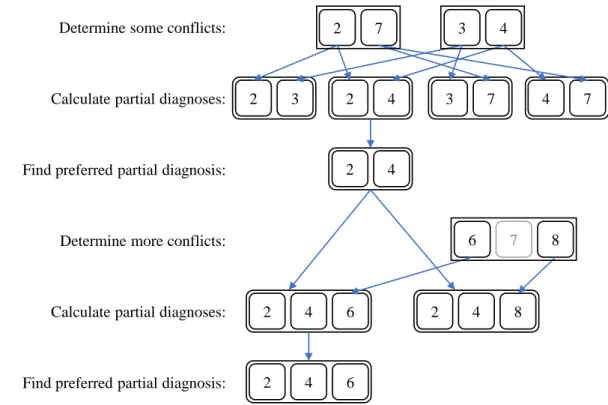
Reconstruction of email conversations: A description of a fault that is found in a spreadsheet could possibly be included in the answer to the email that the spread-sheet was attached to. To utilize this information, a tool was developed that auto-matically reconstructs the email conversations, as shown in Figure 5.1.
Figure 5.1: Example of reconstructed email conversations [Sch+16a]. The spreadsheet icons denote that spreadsheets are attached to the emails.
The conversations can be searched for keywords related to errors. The researcher can then read these conversations in the order in which they were sent. If the message text in an email mentions a corrected or a found fault in some spreadsheet, the researcher can explicitly search for this fault in the attached spreadsheet. To inspect a suspicious spreadsheet attached to an email he or she can click on the spreadsheet icon to open it. The visualization of the conversations helps the researcher to quickly get an overview of the different conversations and to understand the relationships between the emails.
To reconstruct the email conversations, for each email of the corpus the previous and following messages of the same conversation have to be found. However, the Enron corpus does not contain any explicit information for the emails that allows a precise reconstruction of these conversations. Therefore, the system uses a set of heuristics based on the subject, sender, recipients, time stamp, and the message text of the emails to do an approximate reconstruction. A detailed description of the used heuristics can be found in [Sch+16a], which is included in this thesis by publication.
Analyzing the differences in spreadsheets: If only a single or a few formula cells in a spreadsheet were changed, these changes could possibly represent a correction of a fault. Whether such a difference really represents a correction of a fault or a change of the modeled business logic can only be decided by a spreadsheet expert who manually inspects the changes. A tool can, however, support the expert in his or her task by listing a set of candidate spreadsheets of which only a few formulas were changed and by visualizing these changes.
In [Sch+16a], a systematic approach is presented to detect the changes made from one spreadsheet version to another. Searching for the differences between two
spreadsheets in a meaningful way is not trivial. The system has to detect inserted or deleted rows and columns because otherwise every single cell after such a row or column would be perceived as a difference. It also has to report the same change to multiple equivalent formulas as only a single difference because otherwise such a change would result in multiple differences. This has to be avoided since spreadsheet versions that contain too many differences are not considered to contain a correction of a fault. Details of this approach are given in [Sch+16a].
5.3.2 The Enron Error Corpus
With the help of the presented approaches a first initial inspection of the email conversations and the fault correction candidates was done, which led to a corpus of 30 spreadsheets containing 36 real faults. For most of the faults the corpus contains a faulty and a corrected version of the spreadsheet. This can be useful to evaluate approaches that propose to make suggestions how faulty formulas should be repaired. The Enron Error Corpus can be found at [Sch+16c].
Table 5.1: Overview of the Enron Error Corpus [Sch+16c].
Error type Nb of errors
Qualitative 8 Quantitative 28 Mechanical 14 Logic 9 Omission 5 Total 36
An overview of the detected faults is given in Table 5.1. The corpus contains 8 qualitative faults, which did not result in a faulty value of the current spreadsheet but could do so in a later version of the spreadsheet. Since the main goal was to search for faults that result in wrong output values the majority of the found faults are quantitative.
The corpus was published in order to support researchers in evaluating their ap-proaches on real-world spreadsheets with real faults and we plan to use it for our future evaluations as well. In addition, the tool was published to allow other researchers to search for faults in the Enron spreadsheets.
![Figure 1.1: Taxonomy of spreadsheet errors, adapted from [Abe15].](https://thumb-us.123doks.com/thumbv2/123dok_us/9956147.2488175/8.892.123.699.749.967/figure-taxonomy-spreadsheet-errors-adapted-abe.webp)
![Figure 2.4: E XQUISITE , a Model-Based spreadsheet debugging tool [Jan+16a].](https://thumb-us.123doks.com/thumbv2/123dok_us/9956147.2488175/21.892.184.771.91.614/figure-xquisite-model-based-spreadsheet-debugging-tool-jan.webp)
![Figure 5.1: Example of reconstructed email conversations [Sch+16a]. The spreadsheet icons denote that spreadsheets are attached to the emails.](https://thumb-us.123doks.com/thumbv2/123dok_us/9956147.2488175/37.892.181.769.93.329/figure-example-reconstructed-conversations-spreadsheet-denote-spreadsheets-attached.webp)