Aligning order picking methods, incentive systems, and
regulatory focus to increase performance
Jelle de Vries*, René De Koster, Daan Stam Abstract
A unique controlled field experiment investigates order picking performance (in terms of productivity and quality). We examined three manual picker-to-parts order picking methods (parallel, zone, and dynamic zone picking) under two different incentive systems (competition-based versus cooperation-(competition-based) for pickers with different regulatory foci (prevention-focus versus promotion-focus). The study was carried out in a warehouse erected especially for the purposes of order picking research. Our results show that when using a parallel picking method a competition-based incentive system increases productivity and quality compared to a cooperation-competition-based incen-tive system, and that when using a zone picking method it is more producincen-tive to use a cooperation-based incentive system. This pattern of results was especially pronounced for pickers with a dom-inant promotion focus. Domdom-inantly prevention focused pickers, however, were more productive with a cooperation-based incentive system, irrespective of the picking method. Additionally, a cooperation-based incentive system delivered a low quality performance in zone picking, but a high quality performance in dynamic zone picking. The analyses demonstrate that by aligning order picking methods, incentive systems and regulatory focus, warehouses can improve produc-tivity and quality, and reduce wage costs by up to 20%.
Keywords: behavioral operations, warehousing, order picking, incentives.
1. Introduction
Against the backdrop of global economic challenge, warehouses are continuously investigating how operating costs can be reduced to remain competitive. At the same time, some warehouse operations face negative publicity concerning their human resource practices, while finding suita-ble employees is becoming more difficult. All of this is taking place while the market share of e-commerce is growing, which often implies that warehouses have to meet increasing customer de-mands by offering speedier delivery and tighter and more flexible delivery windows (Frazelle, 2002). This puts pressure on virtually all warehouse processes. One of these processes, order pick-ing, the retrieval of a number of products from their storage locations in the warehouse to satisfy orders of specific customers, is an essential activity in the supply chain and accounts for up to 50% of the operating costs of a typical warehouse (Tompkins 2010). Due to this relatively large share of costs, order picking is an attractive area to take into consideration when searching for produc-tivity improvements and potential cost-savings. Selecting an appropriate order picking method is instrumental in achieving this.
Most of the academic literature on order picking focuses on optimizing a specific aspect of a particular order picking method. Examples include routing (De Koster et al., 2007; Hwang et al., 2004; Petersen, 2004), storage assignment (Jarvis and McDowell, 1991), warehouse layout (Hsieh and Tsai, 2006), and zoning (Jane and Laih, 2005; Le-Duc and De Koster, 2005). This body of research is a major contribution to the field and has led to greater efficiency in those warehouses that have been able to successfully implement the findings in practice. However, surprisingly enough, one very important factor in order picking has been largely ignored: the people involved in order picking. De Koster et al. (2007) reported that less than 30 percent of the papers included in their literature review on warehouse order picking concerned picker-to-part order picking sys-tems. This is probably because parts-to-picker systems are largely automated, which makes it eas-ier and more attractive for researchers to accurately model the behavior of these systems. Still, most warehouses employ people for order picking (De Koster, 2007). Unfortunately even the lit-erature that does focus on picker-to-part order picking systems primarily studies system design, planning, and control related issues, rather than how humans act within these systems. This shows that the importance of the human factor in order picking is not acknowledged.
In sharp contrast, based on a large number of studies we expect that human factors strongly affect performance in tasks such as order picking. Indeed, various behavioral factors have shown
to influence performance. Examples are performance loss in group tasks (Erez and Somech, 1996) and the effect of goal setting in organizations (Locke, 1968). Compensation and incentive systems are among the most effective strategies to influence employee behavior, motivation, and perfor-mance (Guzzo et al., 1985). Examples of such systems are piece-rate pay systems (Lazear, 2000) in which individuals get (extra) pay-based on their individual performance and group compensa-tion schemes in which the members of a team get (extra) pay-based on the performance of the team as a whole (DeMatteo et al., 1998). Interestingly, not all incentive systems lead to optimal perfor-mance under all conditions, and people respond differently to specific incentive systems (Wageman and Baker, 1997). Specifically, it appears that incentives oriented on the individual are especially effective under circumstances in which individuals work independently (Dobbins et al., 1991). In contrast, incentives directed at the group level are especially effective under circum-stances that emphasize task interdependency (Wageman, 1995; Zingheim and Schuster, 2000). Individual characteristics also play a role. For instance, a major theory of individual differences, regulatory focus theory (Higgins, 1998), distinguishes between individuals that are oriented on achieving their personal ideals and ambitions using eager strategies (promotion focus) and indi-viduals that are oriented on fulfilling their duties and obligations using vigilant strategies (preven-tion focus). Recent research shows that promo(preven-tion-focused individuals are more motivated by in-dividual incentive schemes, while prevention-focused inin-dividuals are more motivated by group incentive schemes (Beersma et al., 2013).
These research findings lead us to believe that incentive schemes may be an important facilitator of performance in order picking depending on the order picking method used and the characteristics of the individual picker. Three of the most common order picking methods are par-allel picking, in which pickers work independently, zone picking, in which multiple pickers handle an order, and dynamic zone picking, which includes elements of both other picking methods. In terms of incentive schemes, individual incentive schemes should be especially motivating for pro-motion-focused individuals working in a parallel order picking system (since under this system pickers work highly independently) while group incentive schemes should be especially motivat-ing for prevention-focused individuals workmotivat-ing in a zone order pickmotivat-ing system (since under this system pickers work highly interdependently). Moreover, for individuals working in a dynamic zone system both individual as well as group incentive schemes can be effective based on the individual characteristics of the picker; An individual incentive scheme is expected to be especially
effective for promotion-focused pickers, while a group incentive scheme is expected to be espe-cially effective for prevention-focused pickers. Thus, taking the incentive system and the regula-tory focus of order pickers into consideration will enable us to assess more precisely which com-binations of behavioral context and traditional order picking methods are especially fruitful.
Through an experimental approach that was inspired by the recently emerged field of be-havioral operations, this study aims to bridge the gap between traditional models focusing on op-timizing the order picking process and the order picking performance that can actually be observed in practice. By taking behavioral aspects (i.e. incentive schemes and picker characteristics) into consideration, we aim to obtain results that directly translate into practice. The experimental ap-proach of this current study, featuring a specially erected full-size warehouse, is highly novel and should ensure that our findings are, to a large extent, directly generalizable to the practical setting of warehouses worldwide.
Our study makes both theoretical and practical contributions. Although theoretical research has established that an alignment between incentive systems, task, and person is important for optimal performance, the exact nature of this alignment is unclear. We offer a new model of the alignment of incentive systems and order picking tasks by focusing on cooperative and competitive incentive systems and their effectiveness under parallel, zone, and dynamic zone picking methods. This extends the more global models of incentives systems by adapting them to the domain of order picking. We also integrate individual differences in this equation. Specifically, we identify regulatory focus as a crucial individual difference and test its moderating effects on the influence of incentive systems. Together, this leads to a much-extended model of incentive systems that is specific to the domain of order picking.
Our contributions also extend theory. For instance, much of the research on incentive sys-tems in Operations Management (OM) is theoretical in nature and our research extends this by detailing empirical evidence of the effects of incentive systems in actual order picking and how incentive systems depend on picking method and individual differences. From a managerial point of view, identifying under which circumstances different types of people reach their optimal per-formance levels could be particularly beneficial not only because companies could be aided in training and selecting the right employees for the job, or in determining which incentive system should be used in combination with which order picking method and type of employee, but also to explore the potential tradeoff between productivity and quality in the context of order picking.
Quality has been scarcely researched in this context, and is therefore investigated from a more exploratory perspective. However, these aspects are also essential as companies have to operate with a simultaneous focus on profit, quality, and the wellbeing of their employees.
In the remainder of this paper, we first review the literature on order picking, incentive systems, and regulatory focus. Next, we introduce our hypotheses, describe our methodology and our performance measures. We then present our analyses and results. We conclude by discussing the practical impact of correctly aligning the picking method, the incentive system, and the regu-latory focus of the individual pickers, and how our findings can be implemented in practice. 2. Theory
2.1 Order picking
As a pivotal step in a product’s route to a customer, order picking can be regarded as a crucial warehouse operation. The full order picking process involves all steps from clustering and sched-uling customer orders to disposing the picked articles. In many of these steps, a certain degree of automation is possible, but most warehouses employ humans as order pickers (De Koster, 2007). In this paper, we focus on the most common picking system, low-level picker-to-parts picking with multiple picks per route, in which the order picker has to walk along the aisles to fulfill the order by picking all specified items. This picking system contrasts with parts-to-picker systems that make use of automated storage and retrieval systems (AS/RS) or carousels (De Koster et al., 2007).
Various technological picking tools can be used in low-level picker-to-parts systems. For example, pickers can be aided by hand-held scanners, voice-terminals, or pick-to-light systems. Here, we only focus on the traditional order picking using a paper picking list. There are also various picking methods. In this study we include three of the most common methods: parallel picking, sequential zone (pick and pass) picking, and dynamic zone (bucket brigade) picking. In parallel picking, pickers work on their own order from the beginning to the end. This means that the pickers work almost independently of each other. In sequential zone picking, the warehouse or aisle is divided into separate zones. Each picker is responsible for one zone, and an order is passed on to the picker in the next zone when the order is completed in the zone. If an order does not contain any lines to be picked in a particular zone, the order is passed on to the next zone imme-diately. If the picker in the next zone is still busy with a previous order, the current order can be
placed in a buffer. In dynamic zone picking the volume determines the end of the zone, so there is no fixed zone limit. Rather than waiting at the zone limit until the upstream picker is finished with his/her zone, a picker will travel towards the upstream picker and the order will be transferred at the meeting point. Theoretically, this eliminates waiting time or large buffers between zones (Tompkins, 2010).
Research in order picking has helped practice in low-level picker-to-parts substantially in optimizing performance. Indeed, while most literature on order picking focuses on automated sys-tems, much research is also available that is relevant for low-level picker-to-parts systems. These studies focus on various aspects of the order picking process to increase efficiency. Examples include the layout of the picking area (Caron et al., 2000), the product storage strategy (Jarvis and McDowell, 1991), sequencing and routing (Caron et al., 1998; Goetschalckx and Donald Ratliff, 1988; Ratliff and Rosenthal, 1983), and batching (Elsayed, 1981; Rosenwein, 1996). This research has also looked at picking policies (parallel, zone, and dynamic zone) and concluded that the ef-fectiveness of order picking policy depends heavily on the properties of the particular warehouse (e.g., warehouse shape, type of storage rack, product type and size, and required throughput) (Hsieh and Tsai, 2006; Hwang and Cho, 2006; Petersen, 2004; Yu, 2008). Based on the results of these studies, warehouse managers have been able to make better decisions about which order picking system to implement to improve performance and decrease operating costs. However, there is still room for improvement. For instance, although humans make the picks in these sys-tems, the influence of the picker has generally been ignored. Work elements of an order picker in a low-level picker-to-parts system include tasks such as traveling to pick locations (about 50% of a picker’s time), searching for pick locations (about 20% of a picker’s time), and picking the items (about 15% of a picker’s time) (Tompkins, 2010). Setting up the order that has to be picked or starting to pick again after short interruptions is also time consuming (Schultz et al., 2003). The effort, motivation and actions of individual pickers are important factors that influence the perfor-mance of manual order picking systems. Consequently, these behavioral aspects need to be in-cluded in research on order picking performance. Furthermore, optimizing order picking perfor-mance is typically operationalized as minimizing the time it takes to complete orders with a mini-mum number of picking errors.
In the current study, we focus on this influence of the order picker by keeping factors such as the picking area, product layout, and sequencing constant, and by investigating behavioral fac-tors that influence a picker’s performance in terms of productivity and quality. More specifically we emphasize two elements that may facilitate optimizing performance given a certain picking policy: Incentive systems and picker regulatory focus. Next, we discuss the literature on incentive systems and hypothesize which incentive system is most effective under which picking policy. Then we move to picker characteristics in terms of regulatory focus and discuss how this affects the influence of the incentive system.
2.2 Incentive systems
Awarding financial incentives to reward performance is a common method to align the efforts of employees with the objectives of the company and to improve productivity and quality (Gomez-Meja and Balkin, 1989). Previous studies have emphasized that financial incentives are among the most important drivers of employee performance (Jenkins and Gupta, 1981; Jenkins Jr et al., 1998; Locke et al., 1981, 1980). Although some studies argue that offering external rewards such as money undermines intrinsic motivation (Eisenberger and Cameron, 1996; Kohn, 1993a, 1993b), a meta-analysis of 39 studies by Jenkins Jr et al. (1998) showed a substantial corrected correlation of .34 between financial incentives and performance quantity.
One of the most important considerations in implementing incentive systems is whether the organization should implement an incentive system that is completely based on individual per-formance, or rather adopt a cooperation-based reward scheme in which the group performance determines at least part of the individual pay. Working in teams is increasingly prevalent in modern organizations, and individual incentive systems do not always fit well in that context (Zingheim and Schuster, 2000). Employees often have to execute interdependent tasks, and it can be difficult for a manager to evaluate the performance of an employee without considering the influence of direct colleagues (Dobbins et al., 1991). The choice for either individual or team focused incentive systems is implicitly also the choice between highlighting the importance of either competition or cooperation among employees (Tjosvold, 1986). Whereas individual incentives can be expected to reinforce individual performance, team incentives may stimulate more cooperative behavior at group level (DeMatteo et al., 1998).
Several pitfalls exist for both competitive and cooperative reward systems for teamwork. If a group works with a very strongly emphasized competitive reward scheme, the stability and
cohesion of the group might be put at risk, even with independent tasks. This could lead to a po-larization of effort levels with some people working slightly harder, but many demotivated people working substantially slower, resulting in a negative overall effect (Dickinson and Isaac, 1998). If a group works with a very cooperation-oriented incentive scheme, social loafing and free riding are common problems. These phenomena can occur if individuals do not perceive that the outcome of the group process is influenced by their efforts, resulting in low motivation to contribute to the group. This problem is not likely to exist if the efforts of the individual group members are indis-pensable (Shepperd, 1993).
The exact circumstances under which cooperative incentives are more effective than com-petitive incentives are unclear, but task interdependence has been identified as one of the most critical factors influencing the effectiveness of team rewards (Wageman and Baker, 1997). Task interdependence refers to the degree of interaction and cooperation between team members that is required to complete a specific task (Sundstrom et al., 1990). The literature on the topic has con-sistently demonstrated that matching tasks and rewards lead to higher performance. This implies that it is more effective to use competitive incentives for independent tasks, and cooperative in-centives for interdependent tasks.
If these findings are translated to the context of order picking, we can hypothesize which incentive system leads to better performance when used in combination with a particular order picking method. For example, a parallel picking system entails a relatively low degree of interde-pendence. Pickers work individually on a task, and are not required to communicate and coordinate work with other pickers. They know that they are responsible for their own performance, and are likely most motivated if the incentive system fits these circumstances, i.e. under a competitive incentive system. An increase in motivation at work has commonly been linked to a variety of positive outcomes. Not only are motivated employees more productive, they most likely also work more precisely, and are more satisfied about their job (Kanfer et al., 2008). Therefore, a competi-tive incencompeti-tive system is expected to perform especially well in the context of parallel picking, which is stated in the first hypotheses.
Hypothesis 1a: In parallel picking, a competition-based incentive system will result in higher productivity than a cooperation-based incentive system.
Hypothesis 1b: In parallel picking, a competition-based incentive system will result in higher quality than a cooperation-based incentive system.
In a zone picking system, pickers work in a team. Each picker only finishes part of an order and as a consequence the throughput time of an order is dependent on the performance of each indi-vidual picker. Moreover, in a situation with limited buffers, the maximum work speed of a worker in a later zone is serially dependent on the on the speed of the workers in the earlier zones (Schultz et al., 1999). Thus, zone picking is associated with a high degree of task interdependency. Since high levels of task interdependency are a facilitator of the motivating effects of a group incentive system, pickers will probably be more motivated at work if the incentive system is group oriented to a certain extent as well. Since motivation should influence productivity and quality, it follows that the productivity performance and quality performance of pickers working with a zone picking method are higher under an incentive system that focuses more on cooperation.
Hypothesis 2a: In zone picking, a cooperation-based incentive system will result in higher productivity than a competition-based incentive system.
Hypothesis 2b: In zone picking, a cooperation-based incentive system will result in higher qual-ity than a competition-based incentive system.
Dynamic zone picking is -to some degree- a combination of parallel picking (since the individual performance of pickers determines where they hand over products to other pickers) and zone pick-ing (with flexible zone boundaries). In other words dynamic zone pickpick-ing includes both task ele-ments that are independent in nature as well as task eleele-ments that are interdependent in nature. As a consequence we expect multiple effects in dynamic zone picking. On the one hand, the inde-pendent aspect of dynamic zone picking calls for a competition-based reward system. On the other hand, the cooperative aspect would better be served by a cooperation-based incentive system. The net effect of the two counteracting mechanisms is unknown, and we have no theoretical grounds to make sensible predictions about this.
2.3 Regulatory focus
In addition to incentive systems we also focus on individual characteristics of pickers. To gain more insight into this issue we employ regulatory focus theory. This theory, first coined by Higgins
(1997, 1998), is based in psychology and is well-suited to be employed in investigating any type of motivation that drives people to achieve certain goals (Higgins, 1998). It can be described as a mindset that influences how people think and act. Regulatory focus theory distinguishes between two self-regulatory strategies that influence behavior. A promotion focus emphasizes accomplish-ing desired, attractive, and positive goals and aims at achievement, growth, and advancement. A prevention focus emphasizes fulfilling duties, responsibilities, and obligations, and includes an element of fear of failing (Higgins, 1998). Also, prevention-focused people are often more risk-averse than promotion-focused people (Halvorson and Higgins, 2013). In contrast with personality theories and measures such as the Big Five (Digman, 1990), regulatory focus theory has been more directly linked to behavior. Some studies even suggest that the relationship between personality traits and individual behavior is actually mediated by the regulatory focus of individuals (Lanaj et al., 2012). Since incentive systems are aimed at influencing the motivation and behavior of work-ers, regulatory focus is a relevant construct to investigate in the context of this study. Although promotion and prevention focus are two theoretically distinct constructs, several studies suggest that an emphasis of one type of regulatory focus mitigates the effects of the other type (Shah and Higgins, 2001; Zhou and Pham, 2004). For example, a person with a dominant promotion focus is unlikely to be partly guided by a prevention focus at the same time. Because of this, we follow Lockwood et al. (2002) in expecting that the dominant regulatory focus of order pickers influences performance, rather than the individual effects of both regulatory foci.
In the context of order picking performance, we expect that the influence of each of the two regulatory foci partly depends on the type of performance. Prevention-focused people tend to follow rules and regulations conscientiously and to avoid errors (Higgins, 1997; Wallace et al., 2009), which suggests that they could make fewer picking errors. A promotion focus, on the other hand, has been linked to production performance (Wallace et al., 2009, 2008) and to sensitivity to the presence or absence of rewards (Kark and Van Dijk, 2007). However, these results are not generally applicable, and are subject to a very influential factor: the fit between people’s regulatory focus and the goal that they have to pursue (Higgins, 2000). For example, Shah et al. (1998) showed that more promotion-focused people performed substantially better in an anagram task if the briefing and task itself emphasized obtaining gains rather than avoiding losses. The results were reversed for prevention-focused people. This finding supports the expectation that regulatory fit leads to a higher motivation and performance, and that people are more sensitive to information
congruent with their dominant regulatory focus. Regulatory fit has also been linked to a higher task enjoyment (Freitas and Higgins, 2002), an outcome that is only a small step away from job satisfaction. Similarly, whether a task is executed individually or in a team also has a different effect on people with a different regulatory focus. Lee et al. (2000) showed that promotion-focused people rated individual events as more important than prevention-focused individuals, whereas the situation is exactly the opposite for team events. The same holds for the rewards structure. In an experiment, Beersma et al. (2013) showed that more prevention-focused teams were more engaged and performed better with a cooperation-based incentive system than with an individual-based incentive system while the reverse was true for promotion-focused teams.
Based on these findings we argue that the fit of the picking method and the incentive system is especially beneficial if it also fits the regulatory focus of the picker. For example, the hypothe-sized better performance of parallel picking with a competition-based incentive system is expected to hold especially for more promotion-focused pickers, who generally place more emphasis on their own achievements and potential positive outcomes and thus are especially motivated by an individually oriented task and incentive system. In contrast, this method and this incentive scheme are expected to be a worse fit for more prevention-focused pickers. This is reflected in hypotheses 3a and 3b.
Hypothesis 3a: In parallel picking, pickers with a dominant promotion focus will perform better in terms of productivity with a competition-based incentive system than with a cooperation-based incentive system, while no such difference exists for pickers with a dominant prevention focus. Hypothesis 3b: In parallel picking, pickers with a dominant promotion focus will perform better in terms of quality with a competition-based incentive system than with a cooperation-based in-centive system, while no such difference exists for pickers with a dominant prevention focus.
Zone picking and a cooperation-based incentive system, on the other hand, is a good com-bination especially for more prevention-focused pickers, who place more emphasis on team per-formance as we expect them to be especially motivated by a group-oriented task and incentive scheme. This combination is likely not so suitable for more promotion-focused pickers, who em-phasize individual performance. Thus the difference between a cooperation-based incentive sys-tem and a competition-based incentive syssys-tem in zone picking is therefore most likely larger for
prevention-focused pickers, while the incentive system is not expected to make a substantial dif-ference for more promotion-focused pickers in zone picking. This leads to hypotheses 4a and 4b. Hypothesis 4a: In zone picking, pickers with a dominant prevention focus will perform better in terms of productivity with a cooperation-based incentive system than with a competition-based incentive system, while no such difference exists for people with a dominant promotion focus. Hypothesis 4b: In zone picking, pickers with a dominant prevention focus will perform better in terms of quality with a cooperation-based incentive system than with a competition-based incen-tive system, while no such difference exists for people with a dominant promotion focus.
Dynamic zone picking is a mix of an individual and team picking method. Theoretically it should be more productive than regular zone picking, assuming that the work rate of the pickers is stationary and not affected by the requirement to coordinate where an order should be passed on. However, Doerr et al. (2004) found that a dynamic zone policy at an experimental production line did not outperform a fixed zone policy, partly as a consequence of higher worker heterogeneity and worker variability. This result suggests that individual differences between workers influence how motivated they are on a task that is not a characterized by a mix of independent and interde-pendent work.
We argued earlier that both competition-based incentive schemes and cooperation-based incentive schemes could be motivating in dynamic zone picking. Here we extend this reasoning by posing that the dominant regulatory focus of the pickers may determine which aspect of the task (teamwork or individual work) is the most salient and hence which incentive scheme would be more motivating with a dynamic zone picking method. Lee et al. (2000) used an experimental approach to find that when a prevention focus is salient in independent tasks, individuals rate events with interdependent (team) outcomes as more important than independent (individual) out-comes. Exactly the opposite pattern emerged with a salient promotion focus. It is likely that people are more motivated to work hard to achieve an outcome that they perceive as being important. Therefore, we also expect that for pickers with a dominant prevention focus the interdependent aspects of dynamic zone picking would be highly salient and consequently that a cooperative in-centive scheme would be more motivating than a competitive inin-centive scheme. In reverse, we expect that for pickers with a dominant promotion focus the independent aspects of dynamic zone
picking would be highly salient and consequently that an individual incentive scheme would be more motivating than a group incentive scheme. This leads to hypothesis 5a and 5b.
Hypothesis 5a: In dynamic zone picking, promotion-focused pickers will perform substantially better in terms of productivity with a competition-based incentive system than with a cooperation-based incentive system, whereas prevention-focused pickers will perform substantially better with a cooperation-based incentive system than with a competition-based incentive system.
Hypothesis 5b: In dynamic zone picking, promotion-focused pickers will perform substantially better in terms of quality with a competition-based incentive system than with a cooperation-based incentive system, whereas prevention-focused pickers will perform substantially better with a co-operation-based incentive system than with a competition-based incentive system.
3. Methodology
The following section describes the participants, the procedure, and the manipulations and measures used in the experiment.
3.1 Participants
The hypotheses were tested using data obtained from an experiment with 142 participants arranged into 48 three-person teams. Additionally, for each experimental session there was also a quality inspector, whose sole task was to check the work of the three pickers. The role of quality inspector was normally performed by people who subscribed to participate to the experiment, but a confed-erate of the experimenter worked as quality inspector in 8 teams because only three people had subscribed to the particular timeslots. Whether a participant or a confederate served as quality inspector had no noticeable impact on the performance outcomes of the team. In two teams, a confederate of the experimenter worked as order picker to substitute for last minute cancellations of participants. The results of these pickers were not taken into consideration. Of the 142 partici-pants, 28 (20%) were university students studying business, 39 (27%) were professional ware-house employees, and 75 (53%) were logistics students at a vocational college, training to become future warehouse employees.
The university students were recruited through notifications on the university’s intranet, and through emails to all students in various courses. Regardless of performance and incentive
condition, each student received €20 in exchange for their participation. The professional order pickers were recruited through a recruitment agency and through contacting various companies active in the Dutch warehousing sector. Ten companies provided at least one participating team of order pickers. The professional pickers also received €20 for their participation, regardless of how they performed. Of the 142 participants 76.8% were male, 51.1% were aged between 16 and 20, 24.8% aged between 21 and 25, and 24.1% aged between 26 and 48. Of the 142 pickers, 63.4% of the participants did not have any order picking experience, whereas 16.2% had worked as order pickers for at least one year. Most participants (69.7%) were Dutch native speakers and completed the questionnaires in Dutch. Of the remaining participants, 14.1% filled out English questionnaires and 16.2% completed Polish questionnaires. The Polish respondents were all warehouse profes-sionals.
3.2 Procedure
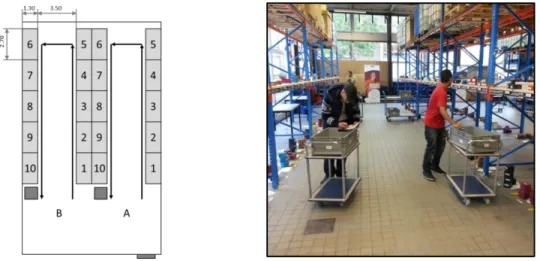
The experiment took place in an experimental warehouse setup (Figure 1). This warehouse was especially erected with the support of several material handling suppliers, supplying racks, picking carts, labels, dummy products, and a Warehouse Management System (WMS). This approach was chosen because order picking is a task that is difficult to replicate realistically (in terms of travel distances, layout, picking heights, product sizes and weights, professional full-size equipment) in a regular laboratory environment, and laboratory experiments can therefore suffer from generali-zation issues: results obtained in the lab could be unrepresentative for what happens in practice. A field experiment combines the manipulation of independent variables and random assignment to conditions in a completely controlled setting with an environment and task that are highly similar to order picking in practice. This approach should provide findings that are not only obtained through a methodologically rigorous approach, but also are highly generalizable to practice.
Figure 1: Experimental warehouse layout (measures are in meters)
The 1000 colored and labeled wooden dummy products ranging in volume from 0.2 to 2 liters and in weight from 50g to 500g were placed at two sides of two (identical) warehouse aisles. The two identical aisles allowed us to execute two simultaneous experimental sessions. The aisles were divided in 10 sections, each containing 5 locations with 2 levels. The locations were logically numbered. For example location A05.3.1 meant that the product was stored in aisle A, in section 5, at location 3 on the lower level. Participants used picking carts to transport the crates (one crate per order). After filling out a pre-questionnaire containing questions on demographic information and regulatory focus, the pickers did a practice round of an order picking task in which they had to pick as many orders with as few errors as possible in 10 minutes, while using a particular method, and subject to a particular incentive structure. On average, the orders contained 8.38 order lines (σ = 2.35, log-normally distributed) and each order line prescribed the picking of one or two units (µ = 1.5) of a particular product. The pickers had to pick the quantity of the correct product, and mark the picking list once a line was picked. Each team worked with the same set of orders. The experimenter used a stopwatch to record start and finish times of each order. When an order was completed, the quality inspector checked whether the pickers had made any mistakes (wrong quantity, wrong product, etc.). The pickers were told that their performance was being tightly monitored by an additional check by one of the experimenters. After a short break, the participants helped to replace the dummy products in their original location. Subsequently, the ‘real’ run of the same task started, also lasting 10 minutes. In zone picking, the participants were assigned to a zone-based on their speed in the practice run: the fastest picker in the first zone, the second-fastest picker in the second zone, and the slowest picker in the last zone. This ensured that all pickers
could reach their full performance potential. Furthermore, even though in zone picking pickers work in separate zones, helping each other was still possible to a certain extent, for example by neatly sorting the products in the crate, or by pointing out where a colleague had to make the next pick. Participants completed a post-questionnaire before the end of the experiment. The experi-ment ended after the dummy products had been replaced and after a short debriefing. The total duration was approximately one hour per group. The experiment was part of an experimental ses-sion lasting two hours in total, but all data used for this paper were obtained in the first hour. 3.3 Manipulations & Measures
The experiment used a 3×2 between-subjects design, with picking method and incentive condition as independent variables. Picker teams were randomly assigned to a picking method and incentive condition.
Picking methods: We used three paper picking methods: 47 participants used parallel ing, 47 used zone picking, and 48 employed dynamic zone picking. The zones used for zone pick-ing are shown in Figure 1, with section 1-3 as part of zone one, section 4-7 as part of zone two and section 8-10 as part of zone three. The zones were delimited by a table that served as a buffer. The second zone consisted of four sections, whereas the first and third zone only consisted of three sections. This setup was chosen based on several pilot sessions to balance the workload of all pickers by compensating for the potential shortcut in the U-shape that the second picker could take if no products had to be picked in section 5 or 6. We controlled for this in the analyses.
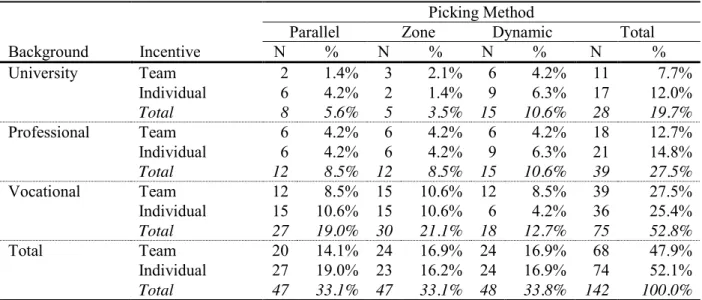
Motivational incentives: Sixty-nine participants (distributed across the three methods), had to complete as many orders as possible without making errors in a team (cooperation-based incen-tive system). They were told that if the performance of their entire team as a whole was the best among all participating teams they would each get a bonus, thus creating cooperation. The other 73 participants had to complete as many orders as possible without making mistakes individually (competition-based incentive system). They were told that if the individual performance of a team member was amongst the best four of all participating individuals, he or she would get a personal bonus, thus creating competition. In both conditions, the winners (all four members of the best performing team, and the four best performing individual pickers) received a €100 voucher for a large electronics & media retailer. The distribution of participants across backgrounds, picking methods and incentive conditions is displayed in Table 1.
Productivity was measured by counting the amount of completed order lines per individual during the real picking run of 10 minutes, ensuring that the pickers had already become familiar with the method in the practice round.
Quality was measured by the percentage of orders per individual that contained errors dur-ing the real pickdur-ing round. This measure was preferred to the percentage of individual order lines that contained errors to prevent an inflation of the error percentage (because of stacking error on error in a single order). In zone and dynamic zone picking, an error in an early zone sometimes causes unavoidable errors in later zones, and these errors are not interesting for the current study. The quality inspector of each team checked whether each order contained the right types and num-bers of products. We told the quality inspectors that their accuracy would contribute to the group performance, and that the experimenters would randomly double-check the quality for approxi-mately 25% of the orders. The checks revealed that the quality inspectors hardly made any mis-takes.
Table 1: Participants per background, picking method, and incentive condition
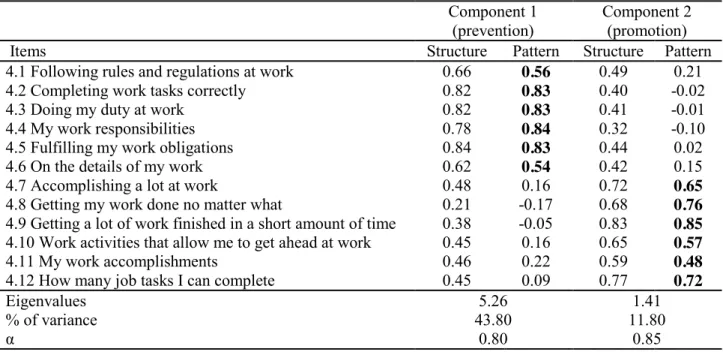
Promotion focus (α=.798) and prevention focus (α=.849) were measured using Wallace and Chen’s (2006) Regulatory Focus at Work Scale in the first questionnaire that the participants completed. This scale has proven its validity and internal consistency in various work contexts (Wallace et al., 2009). A principal component analysis (PCA) with oblique (oblimin) rotation was conducted on the 12 items of the scale. The Kaiser-Meyer-Olkin measure showed an excellent fit
Background Incentive
Picking Method
Parallel Zone Dynamic Total
N % N % N % N % University Team 2 1.4% 3 2.1% 6 4.2% 11 7.7% Individual 6 4.2% 2 1.4% 9 6.3% 17 12.0% Total 8 5.6% 5 3.5% 15 10.6% 28 19.7% Professional Team 6 4.2% 6 4.2% 6 4.2% 18 12.7% Individual 6 4.2% 6 4.2% 9 6.3% 21 14.8% Total 12 8.5% 12 8.5% 15 10.6% 39 27.5% Vocational Team 12 8.5% 15 10.6% 12 8.5% 39 27.5% Individual 15 10.6% 15 10.6% 6 4.2% 36 25.4% Total 27 19.0% 30 21.1% 18 12.7% 75 52.8% Total Team 20 14.1% 24 16.9% 24 16.9% 68 47.9% Individual 27 19.0% 23 16.2% 24 16.9% 74 52.1% Total 47 33.1% 47 33.1% 48 33.8% 142 100.0%
(KMO = .872), and the KMO values for all individual items proved to be high (>.77) as well. Bartlett’s test of sphericity (χ2 (66) = 677.4, p < .001) showed that the correlation matrix of the items is no identity matrix, which makes the items suitable for use in PCA. The scree plot con-firmed that the twelve items are well represented by two components, jointly explaining 55.6% of the variance. Table 2 shows the structure and pattern matrix of the rotated factors. The clustering of the items revealed that factor 1 represents prevention focus, and factor 2 represents promotion focus. The prevention focus score of each participant was subtracted from his/her promotion focus score and the resulting difference score was standardized to arrive at a measure of the participant’s dominant regulatory focus. This dominant regulatory focus is employed because, as explained in section 2.3, even though a single individual can theoretically to a certain extent be promotion and prevention focused at the same time, we believe that behavior is primarily guided by the focus that is most dominantly present (Lockwood et al., 2002). Subsequently a median split was performed to facilitate a direct comparison between participants with a dominant promotion focus and those with a dominant prevention focus.
In addition to participant background, age (in years), education (highest level completed), and experience with order picking (in months) of the participants were used as control variables. These controls differ significantly across background, but since we also control for participant background this does not influence the testing of our hypotheses. We also introduced a dummy variable indicating whether a participant was the second or third order picker in the zone or dy-namic zone picking method. This was done to control for the different picking situations of the second and third picker, who are, to a certain extent, dependent on the first picker in these methods. An adapted version of Hackman and Oldham’s Job Diagnostic Survey (1974) was used to measure Job satisfaction (α=.805) of the participants. To make the scale more applicable to the context of the experiment, the word ‘job’ was replaced by the word ‘task’. The items were rated using a five-point Likert scale ranging from 1 (strongly disagree) to 5 (strongly agree). The aggre-gate of the five items was standardized before being used as measure of job satisfaction. However, inspection of the participants’ rating of their satisfaction with the tasks they performed did not reveal any noteworthy results. This could be attributable to the fact that participants only worked for a relatively short time, but it could also be the case that the employed scale was not thorough and extensive enough to draw conclusions about the effect of picking methods and incentive sys-tems on job or task satisfaction. Therefore, we have only included the job satisfaction results in
our correlation and overview tables (Table 3Table 4Table 6) for informative purposes, but not in the actual analyses.
The dominant regulatory focus questionnaire was translated to Dutch and Polish to ensure that non-native English speaking participants could understand all the questions. Ninety-nine par-ticipants filled out the Dutch version of the questionnaires, 23 completed the Polish version, and 20 filled out the English version. The reliability of the various scales proved to be >.70 for all languages. We used two-way analyses of covariance (ANCOVA) to examine whether differences in the outcome variables could be identified across the three languages, after controlling for method, incentive condition, age, education, participant background, and picking experience. We found no effect of language on either job satisfaction, (F(2, 123) = .739, p = .479), promotion focus (F(2, 117) = 1.43, p = .242), or prevention focus (F(2, 118) = .427, p = .653). Therefore, the three different languages of the questionnaires will not be considered as a factor in the subsequent anal-yses.
Table 2: Regulatory focus at work scale (Wallace and Chen 2006) + pattern and structure matrix factor analysis (Oblimin rotation)
Component 1 (prevention)
Component 2 (promotion)
Items Structure Pattern Structure Pattern
4.1 Following rules and regulations at work 0.66 0.56 0.49 0.21
4.2 Completing work tasks correctly 0.82 0.83 0.40 -0.02
4.3 Doing my duty at work 0.82 0.83 0.41 -0.01
4.4 My work responsibilities 0.78 0.84 0.32 -0.10
4.5 Fulfilling my work obligations 0.84 0.83 0.44 0.02
4.6 On the details of my work 0.62 0.54 0.42 0.15
4.7 Accomplishing a lot at work 0.48 0.16 0.72 0.65
4.8 Getting my work done no matter what 0.21 -0.17 0.68 0.76
4.9 Getting a lot of work finished in a short amount of time 0.38 -0.05 0.83 0.85 4.10 Work activities that allow me to get ahead at work 0.45 0.16 0.65 0.57
4.11 My work accomplishments 0.46 0.22 0.59 0.48
4.12 How many job tasks I can complete 0.45 0.09 0.77 0.72
Eigenvalues 5.26 1.41
% of variance 43.80 11.80
α 0.80 0.85
4. Analyses, results, and effect sizes 4.1 Analyses and results
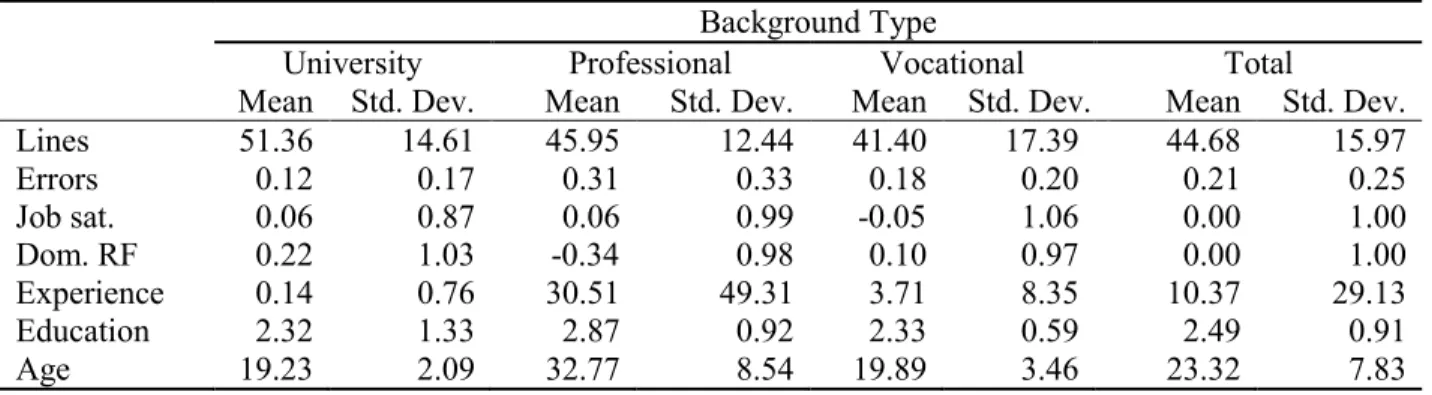
First, we used one-way analyses of variance (ANOVA) to check for differences in performance and dominant regulatory focus between the participants from different backgrounds (university, professional picker or vocational education). We found significant differences between back-grounds in order lines picked (F(2, 138) = 4.279, p = .016). We also found a significant main effect of participant background in terms of percentage of orders with errors (F(2, 138) = 5.55, p = .005). As can be seen in Table 3, the university students picked on average more order lines with a lower percentage of errors than the vocational students and professional order pickers. These results might seem surprising. However, it is important to realize that even though the professional order pickers are familiar with the concept of order picking and the structure of warehouse work, they are not necessarily familiar with the employed order picking method. Also, in some companies different paperless picking tools such as pick by voice or pick to light are used. It is very likely that many professionals mainly have experience with one particular picking method and tool, which differs from the task they had to perform in the experiment. Students on the other hand usually have no experience with order picking, but are generally relatively intelligent and able to learn quickly. General cognitive ability has been demonstrated to be an important predictor of performance in many different types of jobs (Ree et al., 1994). This could potentially explain the fact that students were on average slightly more productive and accurate than professional pickers. We found that the different backgrounds differed in dominant regulatory focus (F(2, 131) = 3.156, p = .046). To account for the differences between the groups found in these preliminary analyses, we included participant background as a fixed control factor (using dummy variables) in the rele-vant subsequent analyses.
Table 3: Means and Standard Deviations per Participant Background
Background Type
University Professional Vocational Total
Mean Std. Dev. Mean Std. Dev. Mean Std. Dev. Mean Std. Dev.
Lines 51.36 14.61 45.95 12.44 41.40 17.39 44.68 15.97 Errors 0.12 0.17 0.31 0.33 0.18 0.20 0.21 0.25 Job sat. 0.06 0.87 0.06 0.99 -0.05 1.06 0.00 1.00 Dom. RF 0.22 1.03 -0.34 0.98 0.10 0.97 0.00 1.00 Experience 0.14 0.76 30.51 49.31 3.71 8.35 10.37 29.13 Education 2.32 1.33 2.87 0.92 2.33 0.59 2.49 0.91 Age 19.23 2.09 32.77 8.54 19.89 3.46 23.32 7.83
Lines = error-free order lines picked, errors = % orders with error(s), Job sat. = Job satisfaction, Dom. RF = Dominant regulatory focus (higher = more promotion focus, lower = more prevention focus)
Subsequently, we examined the descriptive statistics of the key variables. Table 4 shows significant correlations of education with dominant regulatory focus and age, and of age with the percentage of orders with errors and with order picking experience. These correlations suggest that it is important to control for age, education and order picking experience in the analyses. However, they do not reveal information that could be used to answer our hypotheses.
Table 4: Means, standard deviations, and correlations between key variables
Variable Mean Std. dev. 1 2 3 4 5 6
1 Error-free order lines picked 44.7 16.0 -
2 % orders with errors 20.5 24.9 .15 -
3 Job sat. 0.0 1.0 -.12 -.03 .81 4 Dom. RF 0.0 1.0 .01 -.08 .01 - 5 Age (years) 23.3 7.8 .10 .20* -.01 -.12 - 6 Education (levels 1-5) 2.5 0.9 -.06 .09 -.10 -.23** .20** - 7 Experience (months) 10.4 29.1 -.02 .12 .06 -.18 .60** .06 * p < .05 ** p < .01
Job sat. = Job satisfaction, Dom. RF = Dominant regulatory focus (higher = more promotion focus, lower = more prevention focus). Cronbach's α is displayed in italics on the diagonal of the job satisfaction variable.
Note: N = 142. Pairwise deletion of missing values employed, resulting in a lower N for some correlations.
As a next step in the analysis, we investigated how much of the variance in the outcome variables could be explained by the team-level and how much is attributable to the aggregation of the data of individual team members. In our case the team-level refers to the level of the 48 three-person picking teams that participated in the study. This analysis was performed according to the steps explained by Bliese (2009), using the multilevel package within R 3.0.1 (R Core Team, 2013).
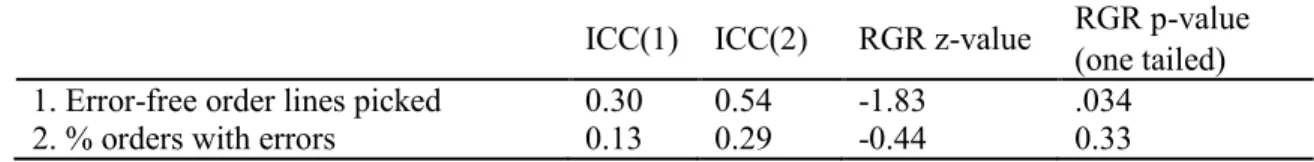
Table 5: Group-level properties
ICC(1) ICC(2) RGR z-value RGR p-value
(one tailed) 1. Error-free order lines picked 0.30 0.54 -1.83 .034
2. % orders with errors 0.13 0.29 -0.44 0.33
First, we calculated the intraclass correlation coefficients ICC(1) and ICC(2) of the order lines picked and the percentage of orders with errors. The ICC(1) values indicate to what extent the variance in the outcome variable can be explained by group membership, and the ICC(2) values indicate the extent (with 1 being completely) to which the groups can be reliably differentiated in
terms of the outcome variables (Bliese, 2009). We employed Random Group Resampling (RGR) to find out whether the within-group variance of the actual groups differed from the variance of 960 pseudo groups that are of identical size as the original groups (Table 5). RGR allowed us to determine whether the relationships at group level can really be attributed to the groups (group effects), or simply represent individual data that are aggregated to the group level (grouping ef-fects) (Bliese and Halverson, 2002). ICC is defined as a non-negative parameter, but Bliese and Halverson's (1998) ICC(1) formula can assume negative values if the differences within the groups are substantially larger than the differences between the groups (Shieh, 2012). Group membership explained at least part of the variance for the percentage of orders with errors and especially for the number of order lines picked. The RGR results showed that the within-group variances of the real groups were significantly smaller than the within-group variances of the pseudo-groups for the number of order lines picked. This implies that part of the individual picking performance is explained by the team to which a participant belongs. Based on these results, we included random intercepts to test for multilevel effects in the models explaining the number of order lines picked and the percentage of orders with errors.
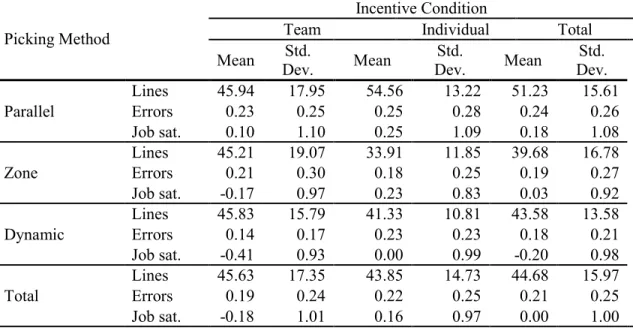
Before creating the different models to predict picking performance, the different types of performance were averaged per incentive condition and picking method to get a general insight in the data. Table 6 suggests that the number of lines picked does not differ substantially across meth-ods in the cooperation-based incentive condition, but that these differences are much larger in the individual incentive condition. This suggests that an interaction effect between picking method and incentive condition could be present.
Productivity: Before adding the control and independent variables to a model predicting productivity, we compared a model without a random intercept with one that contained a random, group dependent intercept. These models were fit using the ‘lme’ and the ‘gls’ functions in the ‘nlme’ package (Pinheiro et al., 2013) in R 3.0.1 (R Core Team, 2013). The categorical variables (participant background, picking method, incentive condition, and dominant regulatory focus) were treated as N-1 dummy codes in the model matrix to be included in the model. The -2 log likelihood value for the random intercept model (996.45) appeared significantly larger than the value for the model without the random intercept (986.59, Δ = 9.86, p < .01), indicating a signifi-cantly better fit for the random intercept model. Subsequently, we created a linear mixed-effects
model with a random intercept and participant background, age, education, and order picking ex-perience as control variables. Furthermore, we controlled for the position of the pickers in a zone or dynamic zone picking method. In the first model, displayed in Table 7, the picking method was added to the control variables as predictor. The effect of the picking method on the number of lines picked was significant, which indicates that the employed picking method significantly influences the number of lines picked.
Table 6: Means and Standard Deviations per Method and Incentive Condition Picking Method
Incentive Condition
Team Individual Total
Mean Dev. Std. Mean Dev. Std. Mean Dev. Std. Parallel Lines 45.94 17.95 54.56 13.22 51.23 15.61 Errors 0.23 0.25 0.25 0.28 0.24 0.26 Job sat. 0.10 1.10 0.25 1.09 0.18 1.08 Zone Lines 45.21 19.07 33.91 11.85 39.68 16.78 Errors 0.21 0.30 0.18 0.25 0.19 0.27 Job sat. -0.17 0.97 0.23 0.83 0.03 0.92 Dynamic Lines 45.83 15.79 41.33 10.81 43.58 13.58 Errors 0.14 0.17 0.23 0.23 0.18 0.21 Job sat. -0.41 0.93 0.00 0.99 -0.20 0.98 Total Lines 45.63 17.35 43.85 14.73 44.68 15.97 Errors 0.19 0.24 0.22 0.25 0.21 0.25 Job sat. -0.18 1.01 0.16 0.97 0.00 1.00
Lines = picked order lines, Errors = % orders with error(s), Job sat. = Job satisfaction
We employed the marginal and conditional R2 as described by Nakagawa and Schielzeth (2013) to estimate the model fit. For this model, the fixed factors (allowed to vary per individual) explain 42% of the variance in productivity (marginal R2), and the entire model (individual + group
effects) explains 68% of the variance (conditional R2). Table 6 shows that the average number of
lines picked in the parallel picking method (mean = 51.23) is substantially higher than in the zone (mean = 39.68) and dynamic zone (mean = 43.58) methods. Pairwise comparisons to test these one-tailed directional hypotheses reveal that the productivity in parallel picking is indeed signifi-cantly higher than zone (p = .01) and dynamic zone picking (p = .032).
Table 7: Linear mixed-effects model. Dependent variable: order lines picked
Model 1 Model 2 Model 3
Effects Wald χ2 Df Wald χ2 Df Wald χ2 Df
Random (group) intercept 66.3** 1 44.68** 1 50.44 1
Participant background 9.63** 1 9.40** 1 7.55 1 Picking experience 1.97 1 0.98 1 0.08 1 Education 1.12 1 1.08 1 0.40 1 Picking position 2 12.32** 1 10.64** 1 12.08 1 Picking position 3 24.60** 1 25.76** 1 24.15 1 Picking method 7.68* 2 0.57 2 3.37 2 Incentive condition 1.70 1 0.28 1 Method × condition 6.65* 1 0.215 2 Dom. RF 7.09** 1 Method x Dom. RF 8.13* 2 Condition × RF dominance 6.78** 1
Meth. × cond. × RF dom. 5.09† 2
Marginal R2 Conditional R2 0.42 0.68 0.48 0.69 0.50 0.71 # of groups # of individual observations 45 119 45 119 45 119
Dom. RF = Dominant regulatory focus (higher = more promotion focus, lower = more prevention focus) ** p < .01, * p < .05,†p < .10
To find out whether a competition or a cooperation-based incentive system leads to optimal picking performance, we added the incentive condition and its interaction with the picking method as predictors, resulting in Model 2 (Table 7). The interaction effect proved significant. Visualiza-tion of the interacVisualiza-tion effect (Figure 2) and pairwise comparisons of the least-squares means (Lenth, 2013) showed that an individual-based incentive system yielded substantially more productivity in the parallel picking method (M = 53.9, SD = 3.38) than a cooperation-based incen-tive system (M = 46.84, SD = 4.52). In contrast, a cooperation-based incenincen-tive system performed better in a zone picking method (M = 47.58, SD = 3.90) compared to a competition-based incentive system (M = 35.37, SD = 3.41). Hardly any differences between a competition-based (M = 41.03, SD = 3.41) and cooperation-based (M = 43.91, SD = 3.50) incentive system emerged for dynamic zone picking. These results support hypothesis 1a and 2a.
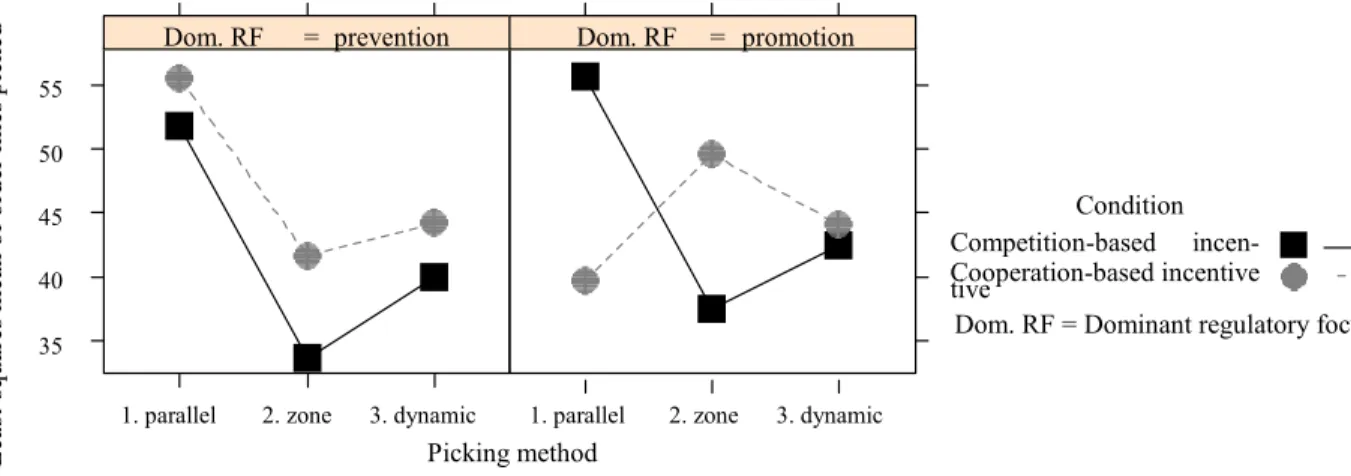
The dominant regulatory focus, which indicates whether a participant is mainly prevention-focused or promotion-prevention-focused was added (Model 3, Table 7), predicting productivity in a three-way interaction to find out how regulatory focus interacts with the picking method and incentive condition. This interaction proved marginally significant (Wald χ2= 5.09, p = .078). Inspection of the three-way interaction plots (Figure 3) reveals that participants with a dominant prevention fo-cus consistently scored slightly higher with a cooperation-based incentive system, regardless of
the picking method. In contrast, participants with a dominant promotion focus performed better in parallel picking with a competition-based incentive system and better in zone picking with a co-operation-based incentive system. No differences could be observed for a dynamic zone picking method. These results are not completely in line with hypotheses 3a, 4a, and 5a. Instead, the results suggest that pickers with a dominant promotion focus are more sensitive to the fit between the picking method and incentive system than pickers with a dominant prevention focus; a parallel picking method fits particularly well with an individual incentive system, whereas a zone picking method fits well with a team incentive system. A dynamic zone setup can be considered a combi-nation of the other two methods, which is reflected by the similar performance in competition-based and cooperation-competition-based incentive conditions.
Figure 2: Interaction between picking method and incentive condition on productivity
Figure 3: Three-way interaction between picking method, incentive condition and dominant regulatory focus on productivity
Picking method Le as t-sq ua re s m ea n of o rd er l in es p ic ke d 35 40 45 50 55
1. parallel 2. zone 3. dynamic
Condition Competition-based incen-tive Cooperation-based incentive Picking method L ea st -sq ua re s m ea n of o rd er li ne s pick ed 35 40 45 50 55
1. parallel 2. zone 3. dynamic =
Dom. RF prevention
1. parallel 2. zone 3. dynamic = Dom. RF promotion Condition Competition-based incen-tive Cooperation-based incentive
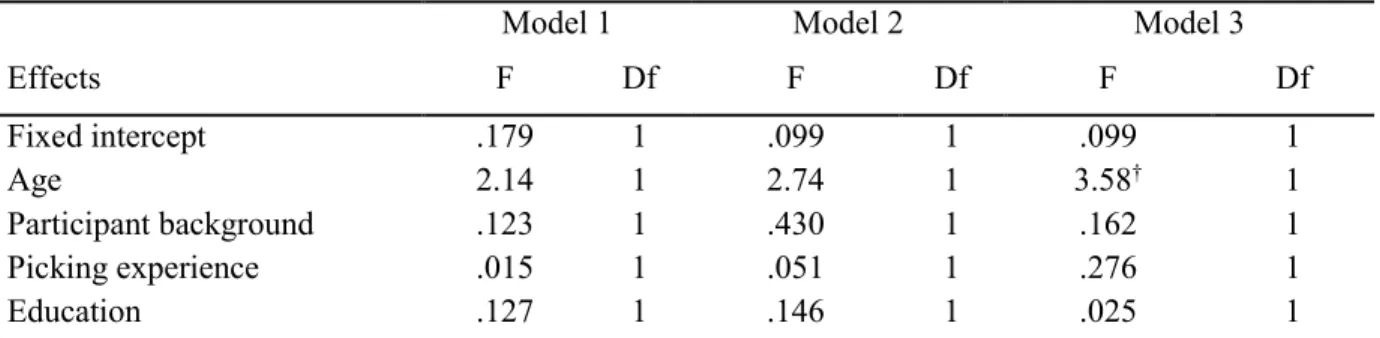
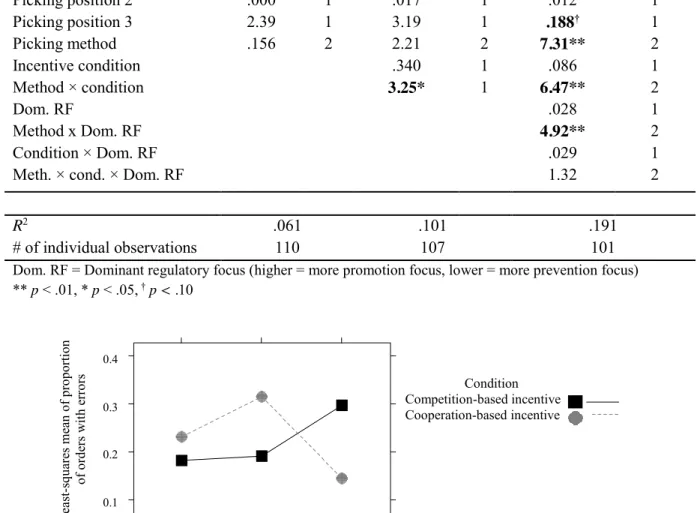
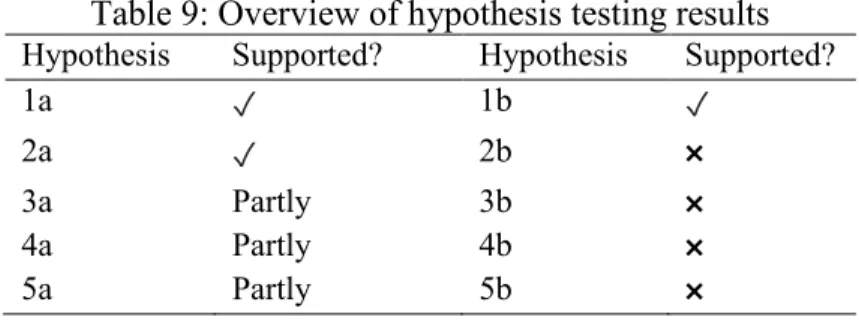
Quality: With the number of orders with errors as dependent variable, the difference in -2 log likelihood value between the random intercept model (10.14) and the model without random intercept (9.68) was not significant (Δ = 0.47, p = .49), which indicates that adding random inter-cepts did not significantly improve the model. Therefore, we performed a one-way ANCOVA on the number of orders containing errors, using method as factor and the same set of control variables as in the model that predicted productivity (Table 8). No significant main effect of method could be identified, and the model explained only 6.1% of the variance in errors (Model 1, Table 8).The interaction between picking method and incentive condition also proved to be significant for qual-ity (Model 2, Table 8). The plot of the interaction effect (Figure 4) and the least-squares means show that the percentage of orders with errors is lower for a competition-based incentive system than for a cooperation-based incentive system in a parallel (M = 18.3%, SD = 5.7% vs. M = 23.2%, SD = 7.3%) and zone picking method (M = 19.1%, SD = 5.3% vs. M = 31.6%, SD = 6.5%), but higher in a dynamic zone picking method (M = 29.6%, SD = 5.9% vs. M = 14.4%, SD = 5.6%). The finding that pickers make less errors with competition-based incentives in parallel picking is in line with hypothesis 1b. However, even though we hypothesized that a zone picking system in combination with a cooperation-based incentive system would result in fewer errors (hypothesis 2b), the opposite appears to be the case. The results suggest that people generally work more ac-curately when motivated by a competition-based incentive system, but that such a system leads to a higher number of errors if workers have to coordinate the distribution of tasks, which essentially happens in a dynamic zone picking method. There was no significant three-way interaction be-tween the dominant regulatory focus of participants and the picking method or incentive condition (Model 3, Table 8), which implies hypotheses 3b, 4b, and 5b are not supported. Table 9 provides an overview of the results of the hypothesis testing performed based on the results of the experi-ment.
Table 8: One-way ANCOVA. Dependent variable: percentage of orders with errors
Model 1 Model 2 Model 3
Effects F Df F Df F Df Fixed intercept .179 1 .099 1 .099 1 Age 2.14 1 2.74 1 3.58† 1 Participant background .123 1 .430 1 .162 1 Picking experience .015 1 .051 1 .276 1 Education .127 1 .146 1 .025 1
Picking position 2 .000 1 .017 1 .012 1 Picking position 3 2.39 1 3.19 1 .188† 1 Picking method .156 2 2.21 2 7.31** 2 Incentive condition .340 1 .086 1 Method × condition 3.25* 1 6.47** 2 Dom. RF .028 1 Method x Dom. RF 4.92** 2 Condition × Dom. RF .029 1
Meth. × cond. × Dom. RF 1.32 2
R2 .061 .101 .191
# of individual observations 110 107 101
Dom. RF = Dominant regulatory focus (higher = more promotion focus, lower = more prevention focus) ** p < .01, * p < .05,†p < .10
Figure 4: Interaction between picking method and incentive condition on quality Picking method L ea st -sq ua re s m ea n of p ro po rti on o f ord ers w it h erro rs Condition Competition-based incentive Cooperation-based incentive 0.1 0.2 0.3 0.4
Table 9: Overview of hypothesis testing results Hypothesis Supported? Hypothesis Supported?
1a ✓ 1b ✓ 2a ✓ 2b × 3a Partly 3b × 4a Partly 4b × 5a Partly 5b × 4.2 Effect sizes
Not only the statistical analyses and absolute numbers, but especially the effect sizes of the behavioral factors illustrate the impact that a change of incentive system or type of employee can have on productivity and quality in practice. Table 10 and Table 11 show performance improve-ments in a given picking method if the incentive system is changed or if pickers with a different dominant regulatory focus are deployed. Both above and below the dotted lines, the combination of method, incentive system, and possibly regulatory focus with the lowest performance in the particular performance measure is used as a baseline and is assigned a score of 100. Regarding quality, the highest number of errors is considered the lowest performance. The scores of the other combinations reveal their performance compared to the baseline. In the conclusion and discussion section, we provide more calculations to demonstrate the potential impact of employing the right incentive system and employees in particular situations.
Table 10: Comparison of effect sizes for parallel picking (Baseline = 100)
Parallel picking Picked lines Errors
Cooperation-based incentive 100 100
Competition-based incentive 115.2 79
Cooperation-based incentive, prom. dominance 100 100 Cooperation-based incentive, prev. dominance 140.0 90.8 Competition-based incentive, prom. dominance 140.0 72.1 Competition-based incentive, prev. dominance 130.4 74.6
Table 10 shows that in parallel picking the switch from a cooperation-based incentive sys-tem to a competition-based incentive syssys-tem corresponds to 15.2% gains in productivity on aver-age, whereas the number of errors simultaneously reduces by 21%. If regulatory focus is also taken into consideration, the productivity benefits and reduction in errors could add up to 40% and 27.9% respectively.
Table 11: Comparison of effect sizes for zone picking (Baseline = 100)
Zone picking Picked lines Errors
Cooperation-based incentive 134.3 100
Competition-based incentive 100 60.7
Cooperation-based incentive, prom. dominance 147.5 33.8 Cooperation-based incentive, prev. dominance 123.9 100 Competition-based incentive, prom. dominance 111.5 12.2 Competition-based incentive, prev. dominance 100 40
In zone picking, the switch from a competition-based incentive system to a cooperation-based incentive system leads to 34.3% productivity gains on average. However, also the number of errors increases by 39.3 percentage points (Table 11). If regulatory focus is taken into account as well, productivity could increase by up to 47.5% whereas errors could simultaneously be re-duced by up to 66.2 percentage points.
5. Conclusion and discussion
The importance of the order picking process in the supply chain emphasizes the need for research that optimizes this process. Whereas most of the literature on this topic focuses on aspects such as optimizing product-to-location assignment, picker zoning, order batching, and picker routing, this study contributes to the literature by demonstrating the influence of behavioral factors on order picking performance in a controlled field-experiment.
5.1 Implications for practice
In this study, we found that by optimally combining a given order picking method with either a cooperation-based or a competition-based incentive system can yield great benefits in terms of productivity and quality. Additional benefits can be reaped by assigning employees with a partic-ular regulatory focus to a picking method and incentive system that best fits their regulatory focus. We provide an example of the potential impact of implementing these findings in practice, based on the data obtained in the experiment. Take a relatively small warehouse with 20 order pickers, 10 with a dominant prevention focus and 10 with a dominant promotion focus. According to a study among HR departments in the United States, the median expected salary for a typical order picker in the United States is $29,049 (Salary.com, 2013). This implies that the total annual salary costs for the order pickers in this situation are approximately $581,000. The following example shows the possible consequences of implementing the findings of the experiment.
Example
Assume the warehouse uses a zone picking system combined with an individual incentive system. In this case, switching to a cooperation-based incentive system would increase productivity by 34% (Table 11). This means that the same amount of work could be done by 15 pickers instead of 20 (20 / 1.34 = 14.9). Although this might also lead to a 64.7% increase in errors, employing one person as quality inspector should mitigate this problem. Taking regulatory focus also into account by changing the dominant regulatory focus of five employees from a prevention focus to a promo-tion focus leads to an addipromo-tional productivity increase. In the original situapromo-tion (10 employees dominantly promotion-focused, 10 dominantly prevention-focused), we would expect a relative productivity score of 135.7 ((147.5 + 123.9) / 2). However, now (15 promotion focused, 5 preven-tion focused) we expect a score of 141.6 ((15 × 147.5 + 5 × 123.9) / 20), an additional productivity increase of 4.3%.Also the expected number of errors is expected to reduce by 24.9%. We conser-vatively assume that in this situation the company would be able to employ four fewer people, corresponding to more than $116,000 savings in yearly wage costs (4 × 29,049), or 20% of the total annual salary costs of the order pickers.
Implementation
For most companies, the potential positive effects of implementing an incentive system in general are probably no surprise. However, the best type of incentive and the magnitude of the effects of the choice between incentive systems might be not so well known. It should be emphasized that this study only compares a team-oriented and a competition-based incentive system. Most likely, the benefits for companies that currently do not have an incentive system are even larger. Accord-ing to a meta-analysis by Condly et al. (2003), incentive systems deliver overall average perfor-mance gains of 22% compared to a situation without incentive systems. Implementing the findings of this study in practice requires incentives that can be realistically made part of the company’s reward structure. For individual incentives, an example of this is employing piece-rate pay in ad-dition to a base wage. In our situation, this could be paying employees an adad-ditional amount per completed pick or order (a statistic registered by many warehouses already). Something similar could be implemented at the team level, in which case the additional amount is based on the team performance. It should be noted that also non-monetary incentives, such as small prizes or privi-leges, can be effective (Jeffrey and Shaffer, 2007).