S
ONDER
F
ORSCHUNGS
B
EREICH
504
Rationalit ¨atskonzepte,
Entscheidungsverhalten und
¨okonomische Modellierung
Universit ¨at Mannheim L 13,15
No. 05-26
Stock Options and Employee Behavior
Zacharias Sautner∗
and Martin Weber∗∗
May 2005
Financial support from the Deutsche Forschungsgemeinschaft, SFB 504, at the University of Mannheim, is gratefully acknowledged.
∗Lehrstuhl f ¨ur ABWL, Finanzwirtschaft, insb. Bankbetriebslehre, email: [email protected]
∗∗Lehrstuhl f ¨ur ABWL, Finanzwirtschaft, insb. Bankbetriebslehre, email: [email protected]
Stock Options and Employee Behavior
Zacharias Sautner and Martin Weber∗
July 27, 2005
Abstract
Employee stock options (ESOs) are a widespread and economically highly significant phenomenon, both at the company and at the employee level. Stock options are not only relevant for CEOs, but also and increasingly for managers at lower grades in a corporation. Despite its economic importance, there exists very little empirical research that examines the behavior of employees in stock option programs. Our study attempts to fill this gap by empirically studying the behavior of option holders in a distinct ESO plan. We try to answer the following questions: How do employees exercise their stock options? How do employees dispose of company stock acquired in stock option programs? What rational and behavioral factors explain differences in observed exercise behavior? We study these questions by combining two data sets. The first data set consists of detailed individual-level ESO exercise transactions of senior managers from a large German corporation (transaction data). The second data set is based on an extensive questionnaire in which we asked these employees to answer a wide range of questions on employee-specific characteristics, beliefs and attitudes (questionnaire data). We find that employees exercise their options very early and in a few large transactions. A large majority of option recipients sell the shares acquired on exercise. Furthermore, our results suggest that, inconsistent with traditional ESO theories, exercise behavior is not driven by factors like risk aversion or individuals’ holdings of company stock that are included in rational models of exercise. Our findings suggest that individuals’ exercise decisions depend on the psychological factors miscalibration and mental accounting.
Keywords: Employee Stock Options, Exercise Behavior, Stock Selling Behavior, Correlation of Economic and Psychological Variables, Survey Methodology
JEL Classification Code: M41, M52, M55
∗Zacharias Sautner is from the Center for Doctoral Studies in Economics and Management (CDSEM) and
from the Lehrstuhl f¨ur Bankbetriebslehre, Universit¨at Mannheim, L 13, 15, 68131 Mannheim, Germany. E-Mail: [email protected]. Martin Weber is from the Lehrstuhl f¨ur Bankbetriebslehre, Universit¨at Mannheim, L 5, 2, 68131 Mannheim, Germany and CEPR, London. E-Mail: [email protected]. We would like to thank Paul Oyer, Ulrike Malmendier, Ernst Maug, Matti Keloharju, Markus Glaser, and seminar participants at the Uni-versity of Mannheim, the Helsinki School of Economics, the UniUni-versity of Copenhagen, the Humboldt-UniUni-versity Berlin, the Ringberg Workshop of the Max-Planck-Institute for Research into Economic Systems, and at the 12th ENTER-Jamboree at the Free University Brussels for valuable comments. Financial support from the Deutsche Forschungsgemeinschaft (DFG) is gratefully acknowledged.
1
Introduction
Employee stock options (ESOs) are a widespread and economically highly significant phenomenon. Stock options are not only relevant at the CEO level, but also increasingly for managers at lower levels in a firm.1 For the U.S., Hall and Murphy (2003) document
that individuals below the five top executives have received an increasing proportion of total stock option grants. By 2002, this group of employees received more than 90% of all options granted. According to the U.S. National Center for Employee Ownership (NCEO), the number of employees receiving stock options has increased from roughly 1 million in 1990 up to 10 million in 2001.2 Even in Europe, most companies listed in the German
blue chips index DAX 30 or in the Euro-Zone index Euro Stoxx 50 provide broad-based stock option programs as a common compensation vehicle to their employees (see Sautner and Weber, 2005a).
Employee stock options constitute an important economic domain both at the company and at the individual level. In many cases, the value of options granted to an individual adds up to a significant proportion of the total compensation (see Hall and Murphy, 2003). What makes ESOs so special is the fact that, in comparison to tradeable options, these financial products are non-transferable as well as non-tradable. Moreover, employees are usually prohibited from hedging the underlying risk by short-selling company stock. Despite its economic importance, very little empirical research exists that examines the behavior of employees in ESO programs. This lack of research is primarily due to data limitations on individual-level behavior. Understanding the behavior of employees in ESO programs is, however, important for various reasons.
A major argument for the widespread use of stock options are the incentive effects associ-ated with it. The duration of these effects depends heavily on the actual exercise behavior of employees. If options are exercised for cash very early, these incentive effects disappear
1Stock option programs that include more than just the top five executives are usually called employee or broad-based
stock option programs (see Bergman and Jenter, 2004 or Core and Guay, 2001). The National Center for Employee Ownership (NCEO) defines stock option programs asbroad-basedif 50% or more of a company’s employees receive or hold options. In the remainder of this paper, we use the terms broad-based stock options and employee stock options interchangeably and hereby subsume programs that include more than just the top five executives.
very quickly. Moreover, they might not last long enough to justify the associated high economic costs of ESO programs to shareholders.3 A better understanding of the
deter-minants of exercise decisions can therefore be very helpful for the design of new stock option programs with powerful and long-lasting incentive effects.
Theoretical models predict that the exercise behavior of an employee depends on his risk-aversion, wealth, and stockholdings (see Lambert et al., 1991 or Hall and Murphy, 2000, 2002). Whether these predictions hold in real life is still relatively unexplored. An empirical study linking employees’ observed option exercises with individual characteristics on risk aversion or diversification would provide a way to test the predictions of these theoretical models. Moreover, insights into the determinants of employees’ actual behavior could help modifying existing theories and guide future modelling.
After employees have exercised their options, they pay the strike price and receive another risky asset: company stock. Having acquired these shares, individuals can decide whether or not (and at what point in time) to sell them. Several studies document that individuals are prone to various behavioral biases when dealing with stocks (see Barberis and Thaler, 2003 for a survey). It is, however, by no means clear whether and how psychological factors influence behavior in stock option programs (e.g. the decision to exercise). This is particularly astonishing given that an increasing body of literaturewithout individual-level data assumes that employee behavior in ESO plans and psychological biases are related (see, e.g., Oyer and Schaefer, 2005 and Bergman and Jenter, 2004)?. Studying individual behavior in the context of option plans is therefore a way to test if and how psychological biases affect economic activity in an important domain. It is well-known that behavioral biases are of particular importance in situations where subjects have a high degree of individual autonomy in their decisions and where large amounts of money are concerned (as it is the case in ESO programs). Linking judgement biases and individual transactions such as option exercises hence provides a way to test which biases actually influence behavior.
From a practitioner standpoint, understanding exercise patterns is important for the es-timation of the accounting costs of stock option programs. According to the Financial
3See Marquardt (2002), Bettis et al. (2005) or Meulbroek (2001) for empirical evidence on how substantial the costs of
Accounting Standard (FAS) 123, companies expensing the costs of stock option plans need to estimate the expected life of issued options as an ingredient of classical option pricing models (see Hull and White, 2004). The expected life of ESOs depends on when option holders actually exercise their options. A precise estimation of the individual be-havior can thereby significantly reduce the accounting costs of ESO plans to the granting firms. In a recent paper, Bettis et al. (2005) show that the failure to adjust for observed exercise patterns can overstate the costs of stock options significantly.
Hitherto, the discussion has raised the following questions that our study aims to empir-ically examine:
1. How do employees exercise their stock options?
2. How do employees dispose of company stock acquired in stock option programs? 3. What rational and behavioral factors explain differences in observed exercise
behav-ior?
We study these questions by combining two data sets. The first data set consists of detailed individual-level stock option exercises of senior managers from a large German corporation (transaction data). The second data set is based on an extensive questionnaire in which we asked these individuals to answer a wide range of questions on employee-specific char-acteristics, beliefs, and attitudes (questionnaire data). It further includes questions about what they did with the shares acquired on exercise, and whether or not they sold a stock investment that was required prior to the participation in the ESO program (the so-called required stock investment, abbreviated RSI).4 For a subgroup of individuals that returned
our questionnaire, we are able to match actual behavior (exercise and stock selling be-havior) with comprehensive questionnaire data. To our knowledge, there exist no other empirical studies in the academic literature on ESO programs that also link individual behavior with employee-level data on economic and psychological variables like risk aver-sion, stockholdings, overconfidence or optimism which are included in our sample.5 We
believe that conducting a survey is the only way to address our individual-level research questions.
4For every ten options they received, employees had to buy one share of company stock. 5With the exception being Sautner and Weber (2005b).
For each individual, we have data on three core transaction variables.Immediate exercise is a binary variable that reflects the exercise behavior of an employees and documents how early he actually exercised his stock options.Acquired stock measures whether or not an employee sold the shares he acquired on exercise. Finally, required stock investment is a binary variable indicating whether or not an option recipient sold the required stock investment (RSI) that was mentioned above.
Based on these three transaction variables, we examine the behavior of individuals in a distinct option program. To investigate differences in exercise behavior, for example, we form two groups of individuals: one group consisting of employees that immediately exer-cised their options and sold the shares acquired on exercise, and one complementary group that did not exercise immediately. Having partitioned the sample, we investigate why the two groups reveal differences in the observed behavior. We hereby test the predictions of various rational and behavioral models.
Our main findings can be summarized as follows. Consistent with the ESO literature, individuals exercise their stock options very early and in a few large transactions. A large majority of option recipients sell the shares acquired on exercise. Most individuals exercise for cash and hereby reduce the exposure to company stock. However, we have evidence that employees suffer from mental accounting and violate the fungibility principle: they dispose differently over equity acquired on exercise and over equity bought for the RSI. Shares from the first source are much more likely to be converted into cash than those of the second one. Furthermore, our results suggest that, inconsistent with standard ESO models like those of Lambert et al. (1991) and Hall and Murphy (2000, 2002), exercise activity is not driven by factors like risk aversion or company stockholdings that are included in these rational models of exercise. Instead, we show that exercise decisions depend on the psychological factors miscalibration and mental accounting. Our findings supplement other studies like those of Heath et al. (1999) and Core and Guay (2001), that show how psychological variables affect exercise decisions of individuals (in their studies reference points and beliefs in trend extrapolation and mean reversion). Based on the work by Henderson (2002), we provide an explanation for our finding that miscalibrated individuals put a too small value on stock options and therefore exercise too early. The remainder of this paper is organized as follows: Section 2 derives rational and
psy-chological factors that are supposed to affect the behavior in the ESO program. It further surveys the empirical literature that studies the behavior of individuals in option plans. The data sets and the design of our study are described in Section 3. Section 4 presents our methodology and describes the variables we use in the empirical analysis. The re-sults of our empirical study are presented in Section 5. We hereby provide descriptive statistics and explain between-group differences in employee behavior. Finally, Section 6 summarizes our results and concludes.
2
Hypotheses and Related Literature
2.1 Rationality, Psychology and Employee Behavior: Theory and Predictions
2.1.1 Rationality and Employee Behavior: Theory and Predictions
In the following subsection, we derive rational and psychological variables that are sup-posed to explain the exercise behavior in the studied ESO program. Furthermore, we develop predictions on how these variables affect the timing of individuals to exercise their options.
Employees can neither freely trade or sell their stock options nor hedge away the im-plied risks by short-selling company stock.6 Moreover, employees are usually inherently
undiversified with their entire human capital invested in the company. The inability to hedge the risk of a stock option and their serious non-diversification will cause employees to value stock options in a way that systematically differs from that of well-diversified outside investors. This implies that the concept of risk-neutral valuation can not be ap-plied to the pricing of ESOs. Therefore, an employee’s value of a stock option will usually not equal the Back and Scholes (1973) value of a fully diversified investor, and exercise decisions prior to maturity can be rational under certain circumstances.7
6Stock option programs usually forbid employees to bilaterally sell their options and to go short in the underlying
company stock. Moreover, Section 16(c) of the U.S. Securities and Exchange Act of 1934 prohibits officers to short-sell equity of their employers. In 2003, Microsoft created a newtransferable stock option program which allowed employees to sell their options to the investment bank J.P. Morgan (see Hall, 2004).
7Note that it is not rational to exercise atradeableAmerican call options on a non-dividend paying stock before maturity
It is important to note that the value an employee puts on his options is closely related to his exercise behavior. A stock option will usually be exercised whenever an employee’s expected utility from exercising prior to maturity is greater than the expected utility from continuing to hold the option (see Huddart, 1994, Carpenter, 1998 or Bettis et al., 2005). An individual’s exercise decision therefore reveals information about the value he places on an option: the lower the value, the earlier he exercises it. If an employee exercises an option at a certain date prior to maturity, he obviously values it less than or equal to the amount of money he realizes from exercising (while continuing to hold the derivative reveals that he values it above the intrinsic value).
Lambert et al. (1991) were the first that formally showed how risk preferences and en-dowments of individuals affect the valuation of employee options. By using an expected utility framework, they define the value of an option as a lump-sum payment (certainty equivalent) that makes an individual indifferent between receiving this payment for cer-tain and receiving the uncercer-tain payoff that is induced by holding the option. They hereby point out that an employee’s entire wealth structure and his risk preferences affect his subjective valuation.8 Lambert et al. show that the option value is lower for employees
who are more risk averse and who have more of their wealth invested company stock.9
Building on the certainty equivalence approach of Lambert et al. (1991), Hall and Murphy (2000, 2002) investigate in greater depth the relationship between ESO values and risk aversion, wealth, and diversification. In their model an employee has non-firm related wealth of w, holds s shares of company stock, and is granted an option to buy one share of stock at an exercise price X in T years. If he invests w at the risk free rate rf and if
a decline in the stock price and the interest that is eaned from holding the option versus immediately buying the underlying stock. There exist two exceptions from this general principle: when dividends are expected, it may be optimal to exercise options immediately prior to a dividend payment (see Merton, 1973). Moreover, decreases in tax rates might compensate for the loss of the time value making early exercises also rational. The pricing of tradeable stock options is based on the construction of ariskless portfolio that duplicates the return of the option. Therefore, it is possible to price stock options under the very simple assumption that all individuals are risk neutral. If an employee is assumed to be risk neutral and if he believes that the expected return on company stock is at least as great as the after-tax return on the risk-free asset, then it is even in the case of ESO programs optimal to exercise at maturity only (see Proposition 1 in Huddart, 1994).
8For a typical power utility function, Lambert et al. report that an employee’s valuation of a stock option can be less
than 50% of the Black and Scholes (1973) option value if he invested 50% of his wealth in his firm’s shares.
9Huddart (1994) provides identical results by incorporating effects of risk aversion in a Cox et al. (1979) binomial
the stock price at T is given by PT, his wealth at timeT is given by
WT =w(1 +rf)T +sPT +max(0, PT −X) (1) If alternatively, the employee was givenV in cash instead of the option and if he invested this cash at the risk-free rate, his wealth at time T would be
WV
T = (w+V)(1 +rf)T +sPT (2) An employee’s option value is now defined as the certainty equivalent V that equates expected utilities, i.e.
Z
U(WV
T )f(PT)dPT =
Z
U(WT)f(PT)dPT (3) Hall and Murphy solve equation (3) numerically and show that the certainty equivalent value V depends on the usual Black-Scholes parameters (the exercise price, stock price, dividend yield, stock-return volatility, risk-free rate, time until expiration) as well as on managerial risk aversion, initial wealth, and stockholdings.10 In particular, they
demon-strate that option values decrease in risk aversion and holdings of company stock but increase in non-firm-related wealth. Rational models of exercise therefore predict earlier exercises when option recipients are more risk averse, have more of their wealth invested in company stock, and have less outside wealth.
It is well documented that an employee’s firm-specific skills grow over time and increase the productivity at the employing firm (see, e.g., Becker, 1964). However, firm-specific skills are likely to be useless when the current job is terminated and when the employee moves to another company. Although the firm-specificity of human capital is not formally captured in ESO models, it is likely to affect exercise activity as well. More specifically, one can expect that employees with a more firm-specific human capital exercise options earlier in order to diversify. We therefore predict that rational employees with a highly
firm-specific human capital will exercise earlier to reduce the risk exposure that is related to the value of the firm.11
In summary, rational ESO models therefore predict that higher risk aversion, more hold-ings of company stock, and a more firm-specific human capital cause earlier exercise decisions. Increases in outside wealth have the opposite effect and cause later exercises.
2.1.2 Psychology and Employee Behavior: Theory and Predictions
There exists widespread and persistent evidence in the academic literature that psycho-logical/behavioral factors affect individual decision making in economics and finance.12In
what follows, we consider three psychological variables and their relationship to individual behavior in ESO programs.
Increasing empirical evidence shows that individual decisions are subject to the psycholog-ical bias overconfidence. Camerer and Lavallo (1999) provide evidence for overconfidence in the economics literature and Glaser et al. (2004) survey the overconfidence literature in the field of finance. Experimental studies have found that executives are particularly vulnerable to showing overconfidence13 and the concept of overconfidence therefore
cur-rently receives increasing attention in the corporate finance literature.14 Overconfidence
can manifest itself in different forms like miscalibration, the better than average effect or in illusion of control (see Glaser and Weber, 2004).
In what follows, we consider overconfidence as the tendency of individuals to assign confi-dence intervals to their estimates of quantities that are too tight (miscalibration). Several studies find that this kind of overconfidence is a robust phenomenon, especially when people judge items that are difficult.15 As a consequence, overconfidence, defined as an
individual’s degree of miscalibration, is very likely to affect employee behavior in ESO
pro-11Apart from these diversification issues, exercise decisions prior to maturity can be rational in cases where option holders
urgently need liquidity. Early exercise is rational in such a case if the value sacrificed by exercising pre-maturely is less than the cost for a loan that might be taken out alternatively. See Subsection 5.3.
12See Rabin (1998) or Barberis and Thaler (2003).
13See Moore (1977), Kidd (1970), and Larwood and Whittaker (1977). 14See Malmendier and Tate (2004) or Gervais et al. (2003).
grams as well. Miscalibrated employees assign confidence intervals to future stock prices that are too narrow and they thereby underestimate the volatility of future stock returns. In the context of stock options, this bias can result in a misvaluation of the time value imbedded in options. Henderson (2002) argues that a decrease in the stock price volatility has a mixed effect on option values: on the one hand, it increases value as it lowers the firm-specific risk employees are exposed to. But on the other, hand it alsodecreases value because of the convexity in a stock option’s payoff.16 Henderson shows that for certain
volatility levels, the convexity effect dominates the risk effect and decreases the subjec-tive option value. If individuals systematically underestimate volatilities, i.e. if they are miscalibrated, they will put a too small value on their ESOs and will exercise too early. For other levels of volatility, the opposite effect can hold. Consequently, the precise effect of overconfidence (miscalibration) on exercise behavior depends of the volatility level and can not be predicted from an ex-ante point of view. Whether overconfidence leads to earlier or later exercise decisions hence remains an empirical question.17
People regularly believe that favorable outcomes occur more frequently than they ac-tually do (see, e.g., Weinstein, 1980). This phenomenon is often called overoptimism or unrealistic optimism. As with overconfidence, managers are again particulary likely to be exposed to this behavioral bias. In the field of foreign exchange, Ito (1990), for example, documents that managers are more optimistic about how exchange rate changes affect their own company than how they will affect others. Overoptimistic managers believe that future stock returns of their own companies are greater than they actually are. In two recent studies, Bergman and Jenter (2004) and Oyer and Schaefer (2005) incorporate this form of unrealistic optimism into stock option compensation frameworks. Bergman and Jenter show that companies compensate their employees with options when employ-ees are irrationally optimistic about company stock. Oyer and Schaefer use calibration methods and document how optimism about future stock returns affects the subjective valuation of options: employees that are overoptimistic about the movements in company stock place higher values on their options than less optimistic individuals. We can
there-16Due to its asymmetric pay-off profile, ESOs, like any other call options, provide a chance of upside gains while providing
protection from downside losses. Hall and Murphy (2002) and Rajgopal and Shevlin (2002) show that the value of this chance is a function that is increasing in the volatility of the underlying stock.
17We are not aware of theoretical models that try to incorporate miscalibration into the valuation of employee stock
fore predict that more optimistic individuals will exercise their ESOs at later points in time compared to less optimistic individuals.
It is documented in numerous experimental studies that individuals use cognitive op-erations to organize and evaluate financial activities. Thaler (1980, 1999) denotes this kind of thinking as mental accounting. Mental accounting violates the economic axiom of fungibility as individuals perceive economically identical assets in isolation (by assigning them to different mental accounts). One aspect of mental accounting is that investors do not sufficiently integrate individual assets into the rest of their wealth and focus on narrowly defined gains and losses (cross-sectional narrow bracketing).18 Using prospect
theory, Massey (2003b) argues that the more narrowly an individual brackets his ESOs (i.e. the less he integrates them into his total wealth), the lower his valuation of these assets will be.19 Thus, we predict that individuals that suffer from narrow bracketing will
exercise their options earlier compared to individuals that integrate their financial wealth. A related aspect of mental accounting is that individuals often have myopic perspectives when evaluating assets (temporal narrow bracketing).20 Benartzi and Thaler (1999) have
shown that myopia of investors with respect to risky gambles can lead to more risk averse decision-making. In the context of employee options, this line of argument implies that individuals with short-term perspectives concerning stock price changes will regard options as less attractive. We can therefore predict that these individuals will be more likely to exercise their ESOs very early.
So far, the analysis suggests that the following set of rational and psychological vari-ables appears to be relevant and might affect employee behavior in ESO programs: risk aversion, company stockholdings, wealth, the firm-specificity of human capital, miscali-bration, optimism, and mental accounting. Unfortunately, most of these variables are not observable. To get a thorough understanding and explanation of actual exercise patterns, one therefore needs to ascertain these variables (or proxies for them) empirically; e.g. by distributing a questionnaire to option recipients of a particular ESO program. We believe
18The valuation of gains and losses rather than absolute wealth levels is a central feature of prospect theory, see Kahneman
and Tversky (1979).
19This is due to the part of the value function that is being evaluated, see Massey (2003b), p. 8. 20See Kahneman and Lovallo (1993).
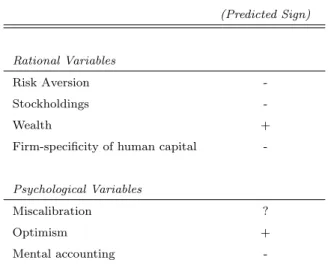
Table 1:Predicted Relationship Between Exercise Behavior and Rational and Psychological Factors
This table reports predicted relationships between various rational and psychological variables and ESO valuation/ESO exercise behavior. “+” means that a model or theory predicts that an increase in the respective variable results in an increase in the subjective option value and hence in a later exercise decision. Correspondingly, “-” means that a model or theory predicts that an increase in the variable results in a decrease in the subjective option value and hence in an earlier exercise decision. “?” means that no prediction is possible.
Variable Exercise Behavior
(Predicted Sign)
Rational Variables
Risk Aversion
-Stockholdings
-Wealth +
Firm-specificity of human capital
-Psychological Variables
Miscalibration ?
Optimism +
Mental accounting
-that conducting a survey is the only way to effectively link individual characteristics with individual-level exercise behavior. Table 1 summarizes the predictions that were derived in the previous two subsections.
2.2 Rationality, Psychology and Employee Behavior: Empirical Evidence
In this subsection, we survey the empirical literature that studies the behavior of individ-uals in ESO programs.
Data on employee behavior in option plans is highly confidential and causes a lack of empirical studies in the field.21 The existing literature can be ordered according to the
21The scarcity of publicly available data is most pronounced forbroad-based option programs. U.S. firms need to publish
information on option exercises by top executives, but not on those by lower-level employees. Poteshman and Serbin (2003) study the behavior of individuals trading inexchange-traded stock options. At present, there is also considerable evidence about the behavior of employees in 401k plans (see, e.g., Benartzi, 2001, Benartzi and Thaler, 2001, 2004, or Huberman and Sengm¨uller, 2004?).
level of data aggregation of the underlying data sets. In a large sample analysis, Core and Guay (2001) study aggregated exercise patterns of non-executive employees in 756 firms. Among other things, they find that option exercises are higher when the realizable value of an option on exercise captures a greater percentage of the options theoretical Black and Scholes (1973) value. This finding is considered evidence consistent with employees recognizing that it is costly to exercise options too early (because it involves sacrificing the time value of the option).22
Bettis et al. (2005) study how cross-sectional firm and individual characteristics affect option exercises at almost 4,000 firms. To proxy for individual characteristics, they employ information on the grade level of an employee and use this variable to capture the effects of unobserved variables like risk aversion and wealth structure.23 Bettis et al. find that
employees working for firms with the highest stock price volatility exercise their options two years earlier than those working for firms with the lowest volatility. Furthermore, employees at higher grades hold their options longer than those at lower levels. They consider this finding as evidence suggesting that risk averse individuals exercise to reduce the exposure to firm specific risk.
Heath et al. (1999) and Huddart and Lang (1996) were the first who tried to study how psychological factors influence the exercise behavior of individuals. They obtained confi-dential data on exercise decisions by over 50,000 employees at seven corporations. Their empirical results suggest that employees generally exercise options from a specific grant in a few large transactions. Much exercise takes place well before expiration, even though there is some degree of variation across the companies they study.24Many employees have
exercised the maximum permissible number of options shortly after the first vesting an-niversary. The major contribution of the studies by Heath et al. (1999) and Huddart and Lang (1996) is that they find that exercise behavior is related to psychological factors. They show that option holders believe that short-term price trends will reverse (mean
22Heath et al. (1999) argue that exercise decisions of rational employees meeting liquidity needs or diversification goals
are more likely when the ratio of the intrinsic value to the Black-Scholes value is relatively large.
23They hereby assume that lower level employees are more risk averse or have more of their financial and human capital
invested in the firm.
24Other studies recording early exercise as a pervasive phenomenon in ESO programs are provided by Hemmer et al.
reversion) and that long-term price trends will persist (trend extrapolation).25 A second
psychological bias relates to the tendency of individuals to set reference points. Based on psychological evidence, they find that exercise activity increases immediately when the stock price exceeds the maximum level that was attained during the previous year. Core and Guay (2001) can confirm these psychological findings using their broader sample. Massey (2003a) matches detailed data on exercise decisions of employees from a Fortune 100 company with a set of demographic characteristics like age, sex, education, grade level, experience with previous option grants and compensation. The employee-level details of his data set distinguish Massey’s study from the previous ones. Massey investigates the decision of whether or not to exercise options from a distinct option grant during a specific week and finds that exercises are sensitive to behavioral factors (the short-term stock performance), the volatility of the option, the time-until expiration, and to an individual’s experience with options. Demographic characteristics seem to have no impact on the probability of exercise.
Evidence on how individuals exercise options from different grants over time is provided in a recent study by Sautner and Weber (2005b).
Less explored is the question of how option recipients dispose of shares in ESO plans. In a study on changes in stock and option ownership of top managers, Ofek and Yermack (2000) document that executives sell nearly all of the shares they acquired on exercise (regardless of their prior equity ownership).
3
Data Sets and the Stock Option Program
This section describes the two data sets we use to test the predictions derived in Subsection 2.1. We further present the company that provided the stock option data for our study and provide institutional details on the ESO program we investigate empirically.
The first data set consists of stock option exercise transactions of 70 senior employees from a large German MDAX corporation. The data set includes detailed individual-level
25More specifically, they document that exercise activity is positively related to stock returns during the preceding month
records of all exercises of these employees between May 30, 2003 and September 16, 2004 (the “observation period”). All 70 employees belong either to the management board (“Vorstand”) or to the first and second hierarchy level of the firm.26
Stock options were granted between July and August 2000. The exercise period within which options are exercisable opened on May 30, 2003 and closes in December 2005.27
To avoid conflicts of interests with regard to insider information, the company decided that options are not exercisable on all days during the exercise period but only within a few so-called exercise windows. Each exercise window opens after the announcement of company earnings and last for approximately four weeks. The ESO program encompasses nine separate exercise windows in total. Our data set consists of exercises that took place within the first five exercise windows. Since 91.8% of all options were exercised during these five windows, we believe to have an accurate picture of the overall exercise activity. Initially, the strike price of the options was equal to the arithmetical average of the stock price 20 days prior to the option grant (15.00 Euro) with a conversion ratio of 1 (i.e. to buy one share of company stock at a price of 15.00 Euro, one option had to be delivered). To avoid adverse effects for the stock price resulting from a large number of option exercises with subsequent stock sales, the company decided to reduce the strike price from 15.00 Euro to 3.00 Euro and lowered the conversion ratio from 1 to St−15
St−3 (i.e. a larger number
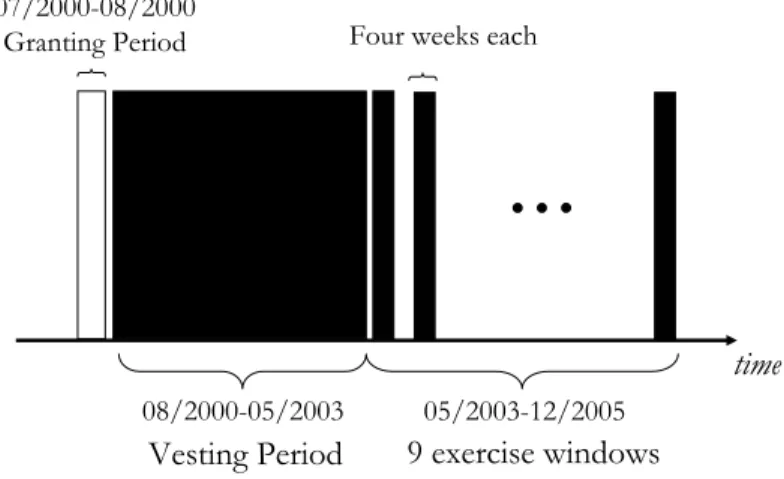
of options had to be delivered to buy one share of company stock at a reduced price). The program was designed such that employees were allowed to exercise all options at one point in time (“cliff vesting”). Employees were prohibited from conducting more than one exercise transaction per exercise window. Moreover, they were not allowed to sell the RSI during the vesting period. Figure 1 provides a simplified overview of the structure of the ESO program.
The company is one of the largest in its industry in Europe and employs more than
26Originally, the stock option program included seven more employees. However, they were excluded from our study
because they either left the company or retired.
27Note that German corporate law (“Aktiengesetz”) requires a vesting period of two years. Within this period, options
are not exercisable at all. The German legislator thereby tries to ensure long-run incentive effects and the shareholder value idea. The company voluntarily extended the vesting period to approximately three years. The firm implemented a performance-based stock option plan which rules that the option holder will not realize any exercise gains unless a pre-specified corporate performance condition was met. At the end of the three-year vesting period, this performance condition was met.
Figure 1:Overview of the ESO Program Structure
This figure documents the basic structure of the stock option program we study. It presents the granting period, the vesting period, and the various exercise windows.
9 exercise windows Vesting Period
08/2000-05/2003 05/2003-12/2005
…
Four weeks each 07/2000-08/2000Granting Period
time
Structure of the Employee Stock Option Program
50,000 people worldwide. Its turnover exceeded 5 billion Euro in 2003 and its shares are publicly traded. The company supplied the data on the condition that itself and its employees remain anonymous. Both during the vesting and during the exercise period, no extraordinary firm-specific events (like bankruptcy or financial distraction) occurred that might have driven the exercise activity.28
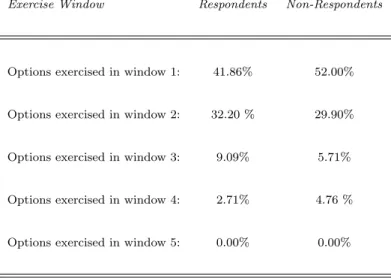
The second data set consists of comprehensive data on employee-specific characteristics, beliefs, and attitudes and was collected by means of a questionnaire. It further includes information on what each employee did with the shares he acquired on exercise and whether or not he sold the stock investment that was required prior to the participation in the ESO program. On May 14, 2004, between the third and fourth exercise window, all employees participating in the ESO program received a mail and were asked to participate in the survey. 48 out of 70 option recipients returned our questionnaire resulting in a response rate of 68.57%. To avoid strategic and untruthful answering, we guaranteed that survey responses are treated confidentially and used for research purposes only. In particular, we assured that neither the executive board of the company nor their human
resources department will be able to access individual answers.
4
Methodology and Data Description
In this section, we present details on the methodology of our study and present descriptions and summaries of the variables and measures we employ throughout our analysis.
Employees were free in deciding when to exercise their stock options (the exercise windows being the only given restriction). Immediate exercise is a binary variable that reflects the exercise behavior of an option holder and documents how early he actually exercised his options. It takes the value 1 if an employee exercised his options during the first exercise window. Correspondingly, it takes the value 0 if he did not exercise during the first window. The latter contains both the case that an employee has not yet exercised any of his stock options and the case that options were exercised in the second, third, fourth or fifth window. If options were exercised in more than one window, the variable takes the value 1 if the majority of options were exercised in the first window. The variable is based on the transaction data provided by the company.
When individuals exercise their ESOs, they acquire the underlying company stock and pay the strike price. Option recipients can sell these shares immediately to log in the difference between the stock price at the exercise date and the strike price.29 Alternatively, they
may decide not to sell acquired shares and keep them in their private stock portfolios. To characterize the stock selling behavior of an individual employee, we use a binary variable named acquired stock. It takes the value 1 if an individual sold his purchased shares by the day of filling in the questionnaire (either by paying the strike price and selling the shares or by cashless exercise), and 0 otherwise. The variable is based on self-reported data collected by our questionnaire.
A variable that is closely related to acquired stock is denoted required stock investment. Recall that before being granted his ESOs, an employee had to buy one share of company stock for every ten options he received. Employees were restricted from selling these
29The immediate sale of shares can also be realized by cashless exercise, a procedure in which a brokerage firm delivers
the difference between the strike price and the market price at exercise to the employee. As documented by Heath et al. (1999), cashless exercise is very common in stock option programs.
shares during the vesting period (i.e. between July/August 2000 and May 2003). From the inception of the vesting period onwards, employees were free in trading their initial stock investments. Required stock investment is a binary variable which takes the value 1 if an employee sold his stock investment (RSI) by the day of participating in our questionnaire, and correspondingly 0 if he did not sell it. We use this measure based on self-reported information.
We argued that risk aversion can have a substantial effect on exercise decicions in ESO plans. Following Massey (2003b), we used a certainty equivalence method to elicit the de-gree of risk aversion of an individual. In this method, employees were offered an uncertain prospect (a lottery) and were asked to indicate the amount of a sure payoff that they con-sider equally attractive. The lottery was designed as a 50% chance of winning an amount equal to a subject’s current wealth, and a 50% chance of winning nothing. The certain payoff was a pre-specified and guaranteed change in wealth (e.g. a 30 or 40% increase in wealth). We extracted certainty equivalence by presenting nine possible sure payoffs and by asking the subjects to choose between these certain payoffs and the lottery. We transformed the certainty equivalents into a risk aversion parameter assuming a specific parametric form of the utility function. Following other studies in the decision analysis literature, we work with a power utility function of the form u(x) =xα (see Tversky and Kahneman, 1992). In this parametric form,αreflects the concavity of the utility function and is a measure of an individual’s degree of risk aversion. Higher certainty equivalents imply higher values of α and a smaller degree of risk aversion.
To measure the exposure to firm-specific financial risk, we asked each individual for the percentage of total wealth that is currently invested in company stock.30 Stockholdings
consequently reflects the value of an employee’s company stock holdings divided by his total wealth.
Managers at higher levels in a company receive a large number of stock options and
30We presented two questions. In the first question, we asked individuals about the percentage oftotal wealth(including
savings, shares, mutual funds, bonds, life insurance, home equity etc.) that is currently approximately invested in stocks and mutual funds including stocks. The second question asked them about the fraction of theirtotal stockholdingsthat is invested in company stock (including shares they received by exercising their options and shares resulting from the required and not yet sold RSI). We combined the answers to both questions multiplicatively to get a measure of an employee’s total wealth invested in company stock.
also get a higher cash salary. They are therefore ceteris paribus wealthier and have more opportunities to diversify wealth. As described in Section 2.1, the value of an ESO is an increasing function of wealth. We use the number of options granted to an individual (options) as a proxy for wealth.31 This information is based on the transaction data set
provided by the company. Following May (1995) and Degeorge et al. (2004), we use tenure as a proxy for the firm specificity of human capital.Tenure is measured as the number of years an employee has been working for the company.
To measure the degree of miscalibration, we asked individuals to provide lower and upper bounds of 90% confidence intervals to two questions concerning index level forecasts (for the DAX and the Euro Stoxx 50), and to one question concerning the forecast of the price of company stock for the end of the year 2004.32Confidence interval questions are widely
used in the literature to elicit probability distributions and variance estimations of stock returns.33 Following the methodology suggested in Keefer and Bodily (1983), we
trans-formed confidence intervals into volatility estimates and compared them with a volatility benchmark.34 We use two measures of miscalibration:Miscalibration market is used as a
measure to reflect an individual’s degree of miscalibration with respect to general stock market trends.35 Miscalibration company measures an individual’s miscalibration of his
volatility forecast for company stock. For both measures, we ranked employees accord-ing to the tightness of their predicted volatilities relative to the historical benchmark. A
31Each non-board member (board member) could obtain up to 10,000 (50,000) options. For every ten options, one share
of company stock had to be bought (see above). Given their personal financial constraints, individuals therefore had to decide how many options they actually wanted to receive. See Subsection 5.1.2 for descriptive data.
32The lower bound was defined such that the correct index/market price level at the end of the year 2004 should not fall
short of this bound with a probability of 95%. Similarly, the upper bound was defined such that correct index/price level at the end of the year 2004 should not exceed the bound with a probability of 95%.
33See, for example, Glaser and Weber (2004, 2005), Klayman et al (1999), Biais et al. (2005), and Soll and Klyman (2004). 34Keefer and Bodily (1983) show that the following approximation provides a good estimation of the forecasted volatility
of a time seriesi: Volatilityi=r(0.95)i
−r(0.05)i
3.25 withi∈ {DAX,Euro Stoxx 50,Company stock}, r(0.95) being the upper
and r(0.05) being the lower bound of the forecast. As volatility benchmarks, we use historical volatilities of non-overlapping 7 months returns. Historical volatilities are often used as objective volatility benchmarks or as estimates for future volatility (see Graham and Harvey, 2002 or Glaser and Weber, 2004). Implied volatilities of exchange-traded options on company stock were not available. Note that the forecast horizon in the questionnaire was approximately 7 months. By dividing the Keefer and Bodily (1983) measure through the corresponding historical values, we get a measure of an individual’s degree of miscalibration.
35It is constructed by calculating the arithmetic average over the miscalibration measures for the two market indexes
lower value of our miscalibration measure reflects tighter confidence intervals and implies a higher degree of miscalibration.36
In order to investigate the impact of stock market forecasts on employee behavior, we asked each option recipient to provide a median forecast for the values of the two indexes DAX and Euro Stoxx 50, as well as for the price of company stock at the end of 2004.37For each
individual, we transformed these price/index forecasts into median return forecasts. We thereby construct a measure of the general market optimism of an individual (optimism market), and a measure of his optimism concerning company stock (optimism company). Optimism market is calculated as the average over the market forecasts for DAX and Euro Stoxx 50. Optimism company is simply the expected return for company stock. To asses the pervasiveness of mental accounting, we investigated whether employees think of their stock options in isolation (narrow bracketing) or as part of an overall investment strategy (asset integration). The resulting variable is denoted as narrow bracketing.38 To
explore a second dimension of mental accounting, we wanted to know how far option recipients actually look ahead when they consider their stock options and possible future prices of company stock. Time horizon is a discrete variable that takes the value 2 if an employee has a long-run perspective (two years or longer), 1 if he has a medium-run perspective (three months up to one year), and 0 if he has a short-run perspective (up to one month only).
In addition, employees provided information on their education levels by indicating to what category their highest degree belonged to.39Due to the fact that all option recipients
were men, we did not have to account for gender effects.
Table 2 summarizes the variables used in our empirical analysis and presents their
respec-36If the value of the miscalibration measure equals one, we call an individual well-calibrated. If the ratio is smaller than
one, he is considered miscalibrated.
37Some studies ask subjects directly for return forecasts, others ask for price and index levels. Our method of elicitation
is used, for example, by Kilka and Weber (2000) and Glaser and Weber (2004).
38More specifically, individuals were asked to indicate to what extend the statement “I try to make my private stock
investments in a way that takes my position in employee stock options into account” is consistent with their own behavior. They registered their answers on a seven-point scale ranging from “I strongly disagree” (1) to “I strongly agree” (7).
39With the categories being “traineeship in business” (coded 1), “university degree” (coded 2), “PhD” (coded 3) and
T able 2: Definition of V ariables This table summarizes and defines variables used in the empirical analysis and presen ts their resp ectiv e data sources. V ariable Data Source Description Imme diate exer cise T ransaction data Binary variable whic h tak es the value 1 if an emplo y ee exercised his options in the first exercise windo w; and 0 if an emplo y ee did not exercise his options in the first exercise windo w. If an emplo y ee exercised his options in more than one windo w, the variable tak es the value 1 if the ma jorit y of options w as exercised in the first windo w. A cquir ed sto ck Questionnaire Binary variable whic h tak es the value 1 if an emplo y ee sold his acquired shares b y the da y of filling in our questionnaire; and 0 otherwise. R equir ed sto ck investment Questionnaire Binary variable whic h tak es the value 1 if an emplo y ee sold his required sto ck in v estmen t b y the da y of filling in our questionnaire; and 0 if he did not sell it y et. R isk aversion Questionnaire Measures an emplo y ee’s degree of risk av ersion (measured as describ ed on page 18). Sto ckholdings T ransaction data The value of an emplo y ee’s compan y sto ck holdings to his total w ealth. Options T ransaction data The n um b er of sto ck options gran ted to an emplo y ee and a pro xy for w ealth. T enur e Questionnaire The n um b er of y ears an emplo y ee w orks for the compan y and a pro xy for the firm-sp ecificit y of h uman capital. Misc alibr ation market Questionnaire Measures an emplo y ee’s degree of miscalibration with resp ect to tw o questions concerning confidence in terv als of tw o mark et indices (measured as describ ed on page 20) and is used as a pro xy for ov erconfidence. Misc alibr ation comp any Questionnaire Measures an emplo y ee’s degree of miscalibration with resp ect to a question concerning the confidence in terv al of compan y sto ck (measured as describ ed on page 20) and is used as a second pro xy for ov erconfidence. Optimism market Questionnaire Measures an emplo y ee’s degree of optimism with resp ect to general sto ck mark et mo v emen ts (measured as describ ed on page 20). Optimism comp any Questionnaire Measures an emplo y ee’s degree of optimism with resp ect to compan y sto ck (measured as describ ed on page 20). Narr ow br acketing Questionnaire Measures an emplo y ee’s degree of w ealth in tegration. Time horizon Questionnaire V ariable whic h tak es the value 2 if an emplo y ee has a long-run p ersp ectiv e concerning the firm’s sto ck price mo v emen ts (t w o y ears or longer); 1 if he has a medium-run p ersp ectiv e (three mon ths up to one y ear); 0 if he has a short-run p ersp ectiv e (up to one mon th). Educ ation Questionnaire An emplo y ee’s education lev el (“traineeship in business” (co ded 1),“univ ersit y degree” (co ded 2), “PhD” (co ded 3) and “none of the ab ov e”).
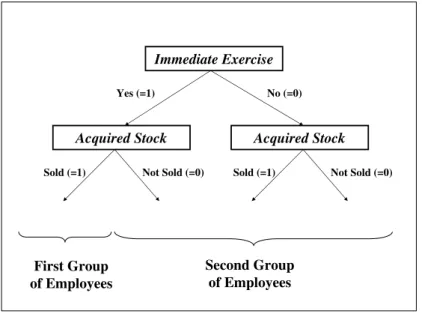
Figure 2: Realizations of Transaction Variables
Immediate Exercise
Acquired Stock Acquired Stock
Yes (=1) No (=0)
Sold (=1) Not Sold (=0) Sold (=1) Not Sold (=0)
Second Group of Employees First Group
of Employees
tive data sources.
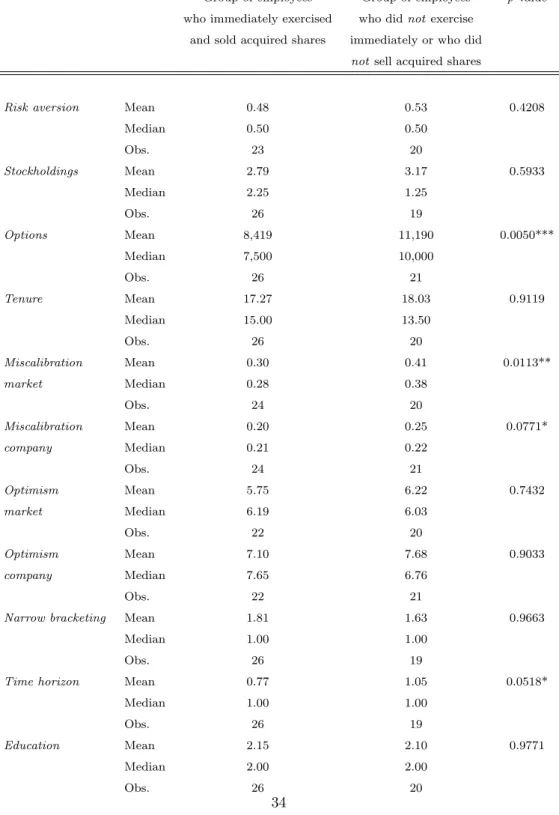
We base our study on the three transaction variables immediate exercise, acquired stock, and required stock investment. To investigate the determinants of exercise decisions, we form two groups of individuals:
• a group consisting of people that immediately exercised stock options and decided to sell the shares acquired on exercise (i.e. a group that decided to reduced the entire risk instantaneously); and
• a group consisting of people that either decided not to exercise stock options imme-diately or not to sell shares acquired on exercise (i.e. a group that decided to kept some risk).
To clarify our classification, Figure 2 provides an overview of the possible realizations of the two transaction variables immediate exercise and acquired stock. The first group consists of people where the value of bothimmediate exercise andacquired stock are “1”, while the second group consists of people where the value of eitherimmediate exercise or acquired stock were “0”.
Having partitioned the option holders, we investigate why the two groups reveal differences in the observed behavior. We therefore employ the information that was collected in our questionnaires. We compare the mean values of a certain variable (e.g. risk aversion) between the two groups and perform a Wilcoxon rank-sum test (Mann-Whitney test) to test the hypothesis that the values of the two sample means are identical. This enables us to discriminate between the two groups and allows us to investigate which factors are responsible for differences in individuals’ actual exercise decisions. We thereby test the theories and predictions outlined in Section 2.1. Because of the limited size of our sample, we do not perform multivariate analyses like discriminant analysis or probit/logit regression models that require much stronger distributional assumptions.
5
Empirical Results
5.1 Descriptive Results
5.1.1 Descriptive Results on Exercise and Stock Selling Behavior
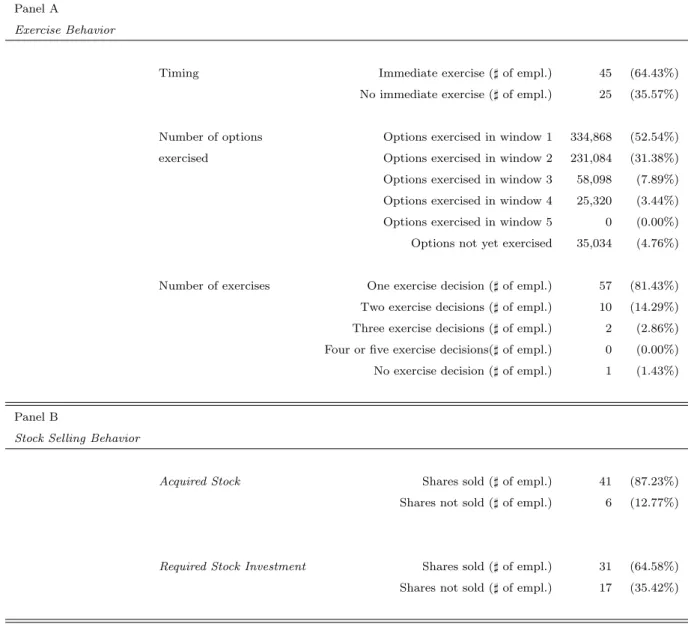
Table 3 presents summary statistics on the behavior of the employees in the studied ESO program. Panel A provides descriptive results on exercise patterns. It reports the num-ber of individuals that exercised their stock options immediately, the numnum-ber of options exercised in the five different exercise windows, and the total number of per-individual exercise transactions that was executed. Consistent with other studies in the field, we find that early exercise is a pervasive and strong phenomenon in our sample.40 Much exercise
activity takes place in the first exercise window: a majority of all individuals, 64.43%, exercised their options during the first window reflecting a strong propensity to exercise early.41 Early exercise is also evident when we consider the fraction of options that was
exercised in each of the five exercise windows. After five out of nine windows, only 4.76% of all outstanding options have not yet been exercised. Interestingly, we find that a vast majority of individuals, 81.43%, exercised their options in one large transaction.
40For similar evidence on early exercise, see, e.g., Bettis et al. (2005), Massey (2003a), Hemmer et al. (1996), Huddart
and Lang (1996) or Sautner and Weber (2005b).
41Within the group of immediate exercisers, 71.11% (32 out 45) exercised their options even within the first three trading
Table 3:Descriptive Results on Employee Behavior
This table summarizes descriptive results on employees’ exercise and stock selling behavior. Panel A presents statistics on the exercise behavior. It documents the number of employees that exercised their stock options immediately (an exercise decision is named early if it occurs within the first exercise window), the number of options exercised by employees in the five distinct exercise windows and the total number of exercise transactions that was executed by option holders. Panel B reports statistics on individuals’ stock selling behavior. It shows whether or not employees sold the shares they acquired on exercise and whether or not they sold the shares they had to acquire prior to the participation in the stock option program (RSI shares). In total, 70 employees participated in the stock option program and 48 employees returned our questionnaire. For a discussion of a potential non-response bias, see Subsection 5.3.
Panel A
Exercise Behavior
Timing Immediate exercise (]of empl.) 45 (64.43%)
No immediate exercise (]of empl.) 25 (35.57%)
Number of options Options exercised in window 1 334,868 (52.54%)
exercised Options exercised in window 2 231,084 (31.38%)
Options exercised in window 3 58,098 (7.89%) Options exercised in window 4 25,320 (3.44%)
Options exercised in window 5 0 (0.00%)
Options not yet exercised 35,034 (4.76%)
Number of exercises One exercise decision (]of empl.) 57 (81.43%)
Two exercise decisions (]of empl.) 10 (14.29%) Three exercise decisions (]of empl.) 2 (2.86%) Four or five exercise decisions(]of empl.) 0 (0.00%) No exercise decision (]of empl.) 1 (1.43%)
Panel B
Stock Selling Behavior
Acquired Stock Shares sold (]of empl.) 41 (87.23%) Shares not sold (]of empl.) 6 (12.77%)
Required Stock Investment Shares sold (]of empl.) 31 (64.58%) Shares not sold (]of empl.) 17 (35.42%)
Panel B reports statistics on the stock selling behavior. It shows that most employees, 87.23%, sold the shares they acquired on exercise.42 Having exercised their options, most
individuals therefore seem to be aware of the diversification problem and rationally con-vert acquired shares into cash. To act consistently, individuals should also sell the shares purchased for the required stock investment (RSI). However, Panel B shows that a signif-icantly smaller percentage of option recipients, 35.42%, also sold these shares of company stock. A majority still ties a significant proportion of personal wealth to the value of the firm by holding RSI shares.43
The observation that employees tend to reduce their option holdings very early is re-markable from an agency perspective. A major argument for the widespread use of stock options are the incentive effects associated with them. If options are systematically ex-ercised for cash very early (as in our case), incentive effects disappear much earlier than probably expected by the issuing companies.
Overall, our results document that most employees exercise a maximum number of options in a few large transactions at the beginning of the exercise period. Individuals exercise for cash and hereby reduce their exposure to company stock. However, our evidence suggests that employees suffer from mental accounting and violate the fungibility principle: they dispose differently over shares acquired on exercise and over shares bought for the RSI. Equity from the first source is much more likely to be converted into cash than that of the second one.
Table 4 provides cross tables of the three transaction variables immediate exercise, ac-quired stock, and required stock investment. Panel A shows that conditional on immediate exercise, 90% of the option holders exercised for cash (27 out of 30). This finding suggests that immediate exercisers are aware of their diversification problems and exercise to di-versify (or to satisfy liquidity needs).44 However, Panel C again shows the differences in
42Shares were sold either immediately or up to the point of time where the questionnaire was returned. Correspondingly,
90.89% of the acquired shares have been sold upon exercise. This finding is consistent with other results in the ESO literature (see, e.g., Ofek and Yermack, 2000).
43Note that 48 option holders provided information on their transactions in the RSI shares. As one individual has not
yet exercised his options when he returned the questionnaire, only 47 persons reported information on transactions in the shares acquired on exercise.
Table 4:Cross Tables of Transaction Variables
This table presents cross tables of the transaction variablesimmediate exercise,acquired stockandrequired stock investment. Panel A
Acquired stock sold No Yes Total
Immediate No 3 14 17
exercise Yes 3 27 30
Total 6 41 47
Panel B
Required stock investment sold No Yes Total
Immediate No 7 11 18
exercise Yes 10 20 30
Total 17 31 48
Panel C
Required stock investment sold No Yes Total
Acquired No 4 2 6
stock sold Yes 12 29 41
the disposition over acquired shares vis-a-vis RSI shares. According to economic theory, individuals should consider shares of company stock, independent of the source, as perfect substitutes. Our finding of a difference in the disposition over these shares might be due to the fact that employees regard shares acquired on exercise and RSI shares separately and consider narrowly defined gains and losses for each source of equity. Prospect theory provides a behavioral explanation for this kind of behavior (see Kahneman and Tversky, 1979). Shares acquired on exercise and shares of the required stock investment differ with respect to their purchase prices: the strike price of an employee option was 3.00 Euro, while the purchase price of the RSI shares was approximately 15.00 Euro.45 At the end
of the closed period, the stock price exceeded 22.00 Euro and did not decline below 20.00 Euro from this date onwards. Virtually, both sources of company stock differed in their purchase prices.46If the purchases prices of employees act as their reference points then the
disposition effect predicts that individuals sell shares acquired on exercise but not those resulting from the RSI (as selling the earlier implies realizing a higher gain).47 Moreover,
it is well-known that individuals are more risk averse on stocks with larger gains compared to those with smaller gains. This is due to the concavity of the value function and further suggests that acquired shares rather than RSI shares are sold. Overall, these behavioral arguments might explain why a significant number of employees sold the shares acquired on exercise and not those bought for the RSI. Supporting evidence for our interpretation is provided by Grinblatt and Keloharju (2001) on trading decisions of individual and in-stitutional investors in Finland. They empirically document that shares with larger past return are more likely to be sold by investors.
and kept these shares in their portfolios. This kind of behavior is difficult to understand on rational grounds, since individuals hereby donotreduce their exposure to company risk (no diversification benefits of exercise) but at the same time forego the advantages of the option (postponing the payment of the exercise price and insuring against stock price declines). We studied the individual characteristics of these 6 individuals and compared them with group of people that sold acquired shares (n = 41). It turned out that these 6 individuals neither show significantly different expectations about future stock returns nor statistically different levels of miscalibration. Moreover, they do not show a significantly different degree of risk aversion and are not exposed to mental accounting in a statistically different way (both cross-sectionally and temporally). However, they have worked significantly longer for the company (25.5 years vs. 16.41 years;p-value = 0.0089) and have higher holdings of company stock (5.15% vs. 2.68%,p-value = 0.0830).
45During the time period in which the company asked individuals to buy the required stock investment, the average stock
price was approximately 15.00 Euro.
46Note that from an economic point of view, funds from selling RSI shares are identical to those that result from selling
shares acquired on exercise.
An alternative explanation for our finding might be the difference in the holding periods of the respective shares. Shares from the RSI were bought at least three years ago and individuals got accustomed to the fluctuations in its value compared to acquired shares which were purchased at the date of exercise. RSI shares therefore likely became part of an employee’s perceived “total wealth”, leading to a reduction in the propensity to sell these assets quickly.
5.1.2 Descriptive Results on Questionnaire Data
Table 5 summarizes descriptive statistics on our questionnaire data. Apart from options, all variables were calculated on the basis of the 48 returned questionnaires. The parameters listed are means, medians, minimums, maximums, standard deviations, and the number of observations of the each variable (Obs.).
The mean certainty equivalent for our presented lottery was a 25% increase in total wealth (median = 25%, std. dev. = 16.42%), leading to a mean value ofrisk aversion equal to 0.55 (median = 0.50, std.dev. = 0.37). The average employee in our sample has invested 2.9% of his total wealth in company stock (median = 1.75%, std.dev. = 3.04%), ranging from 0.25% to 12.75%. As a fraction of his overall equity holdings, the average option holder has put 25.31% into company stock (not reported in Table 5).48 On average, employees
received 10,520 options (median = 10,000, std.dev. = 11,435), and this number fluctuated between 1,000 and 50,000.49 The average individual has been working for the company
for 17.76 years (median = 15.00, std.dev. = 8.17).
We find that individuals’ probability estimates are generally not well-calibrated, both regarding the market and the company forecast (mean value of miscalibration market = 0.35, mean value ofmiscalibration company = 0.22).50However, our findings are consistent
48This figure is in line with the findings of other studies. Benartzi (2001), for example, documents that employees invested
20-30% of their discretionary funds in company stock.
49On average, individuals received 76.6% of the options they could obtain at maximum (median = 100%). Recall that
non-board members (non-board members) could obtain up to 10,000 (50,000) options, depending on personal financial constraints to fulfill the RSI.
50Recall that the miscalibration measures are defined as the ratio of an individual’s volatility estimate to a historical
volatility benchmark. A well-calibrated individual should have a miscalibration measure of one. Note that even the maximum value of the miscalibration measure is significantly below 1 (max. = 0.51) which shows the pervasiveness of miscalibration
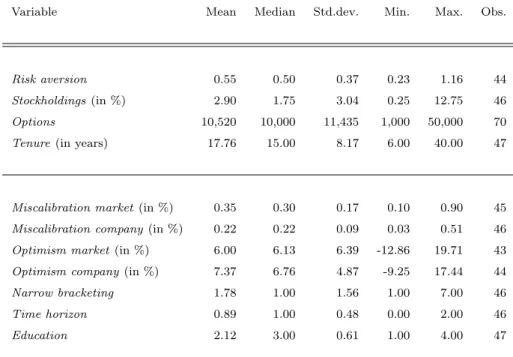
Table 5:Descriptive Statistics on Questionnaire Data
This table reports descriptive statistics on risk aversion, company stockholdings (percentage of total wealth invested in company stock), the number of options granted to employees, employees’ tenure, their degree of miscalibration (see Section 4 for details), their degree of overoptimism (see Section 4 for details), their degree of narrow bracketing, their time horizon (see Section 4 for details), education and age. Descriptive statistics are calculated on the basis of 48 returned questionnaires. The table contains means, medians, standard deviations, minimums and maximums of all variables as well as the number of observations of the respective variables (Obs.).
Variable Mean Median Std.dev. Min. Max. Obs.
Risk aversion 0.55 0.50 0.37 0.23 1.16 44
Stockholdings (in %) 2.90 1.75 3.04 0.25 12.75 46
Options 10,520 10,000 11,435 1,000 50,000 70
Tenure(in years) 17.76 15.00 8.17 6.00 40.00 47
Miscalibration market (in %) 0.35 0.30 0.17 0.10 0.90 45
Miscalibration company(in %) 0.22 0.22 0.09 0.03 0.51 46
Optimism market(in %) 6.00 6.13 6.39 -12.86 19.71 43
Optimism company(in %) 7.37 6.76 4.87 -9.25 17.44 44
Narrow bracketing 1.78 1.00 1.56 1.00 7.00 46
Time horizon 0.89 1.00 0.48 0.00 2.00 46
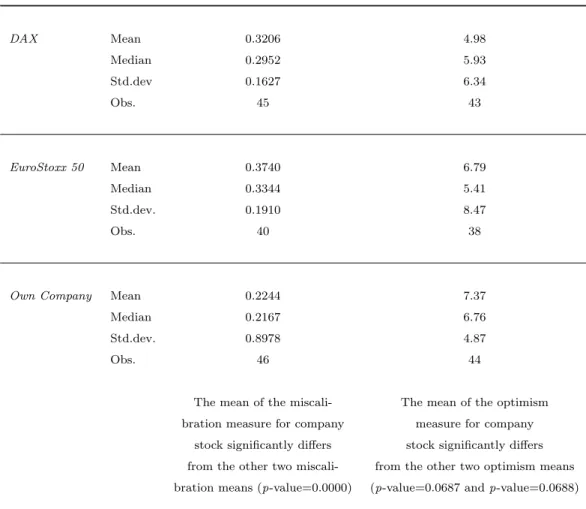
Table 6:Volatility Forecasts
This table presents volatility forecasts for the stock market indexes DAX and EuroStoxx 50 and for company stock. Volatility forecasts are calculated as described in Section 4. In addition, the table shows historical volatilities of non-overlapping 7 month returns. We calculated historical volatilities until October 2004.
DAX Mean 5.75%
Number of Observations 45
Historical standard deviation 17.94% (May 1987 - October 2004)
EuroStoxx 50 Mean 5.78%
Number of Observations 40
Historical standard deviation 15.45% (May 1987 - October 2004)
Company Stock Mean 6.80%
Number of Observations 46
Historical standard deviation 30.32% (May 1987 - October 2004)