AN ANALYSIS OF SPORT UTILITY VEHICLES INVOLVED IN ROAD ACCIDENTS
Dimitri Margaritis, Boudewijn Hoogvelt, Ydo de Vries, Cees Klootwijk, Herman Mooi TNO Automotive
The Netherlands Paper Number 05-0370
ABSTRACT
Trends are noticeable that the European car fleet is changing rapidly towards a higher diversity of vehicles on the roads. On the high end of the scale larger and heavier automobiles, such as Multi Purpose Vehicles (MPV’s) and Sports Utility Vehicles (SUV’s) take a larger share than before.
This paper shows the results from a study done on SUV accidents. The crash involvement and behaviour of Sports Utility Vehicles (SUV) was analysed. The analyses were based on a review of Dutch national statistics and in-depth studies of SUV accidents in The Netherlands and of passenger cars in Europe (the EACS project). Also comparisons were made with actual numbers of the car fleet of the vehicles types, so that exposure rates can be included. Accidents of vehicles in the above-described categories will also be compared with each other.
The national statistics and the in-depth analysis were compared and it was shown that the studies point in the same direction. It can be concluded that SUV’s are significantly more aggressive against vulnerable road users. In this study no difference is found between heavy passenger cars and SUVs. SUVs are about as heavy as the average full-size passenger car. So the same mass difference occurs between passenger car classes (e.g. full-size and small cars). Although the bumper height is about 20% higher compared to passenger cars, this difference could not directly be related to an increase in injury severity in this study due to the lack of data.
INTRODUCTION
The Dutch car fleet is changing rapidly towards more extreme vehicles on the public roads. Larger and heavier vehicles, such as Sport Utility Vehicles (SUVs) are taking a larger share than before. The SUV sales in The Netherlands show a clear increase in the last five years. The success of these vehicles probably results from a public feeling on good ride and comfort, a safe feeling with respect to crashworthiness (self-protection) driving these
cars and the fact that it is ‘trendy’ to own such a car.
At the moment many discussions are going on about the traffic safety aspect of SUV’s, mainly about their aggressiveness. Some of their properties as size (geometry) and mass differ considerably from normal passenger cars. There is a lack of so called ‘compatibility’. The worst item concerning compatibility is the height and especially the ‘bumper height’. Other road-users feel threatened by SUV’s because of the above mentioned differences. Accident studies for vehicle compatibility and traffic fatalities by vehicle type in the US show ([1], [2], [3], [4], and [5]) that the chance to get killed in a crash with a SUV, being an occupant in a passenger car is higher especially if the SUV is coming from the side. Another safety aspect is their rollover sensitivity. Research in this field show that SUVs tend to be more involved in vehicle rollover ([6], [7]). Normally, a passenger car never rolls over.
For this study the definition of an SUV is set to:
An SUV is a vehicle with a nose type front-end, a bigger geometry and an increased mass, front and rear bumper height, overall ground clearance and higher centre of gravity, in comparison to normal passenger cars. Terrain (off-road) vehicles and so called ‘pickup-trucks’ are also included in this definition.
Firstly the methods used for the analysis of the data are described. Next the results are presented, subdivided into national traffic accident statistics and TNO in-depth database. Finally the conclusions and the recommendations are presented.
METHODS
A database with all SUV and passenger car accidents is built from the combination of the Dutch National Traffic Accident Statistics or in the Dutch ‘Verkeers-Ongevallen-Registratie’ (VOR) database of 2001 until August, 2002 and the Dutch licence plate registration system (RDW-data) to identify the vehicle types in a collision. All
passenger car accidents and SUV accidents were extracted from the database. Normally all SUVs should be coded as passenger cars, however in the VOR in some cases these vehicles are also coded as ‘Van’ or ‘Truck’; this is taken into account in the selection. The names of SUV type vehicles were selected from several internet sources and year book lists. In total approximately 120 SUV types were identified. The collision partners of the selected vehicles were found by coupling the vehicles in the VOR-database that were involved in the primary collision.
The filtered database was exported to the statistical analyses tool ‘SPSS 12’ [8] and further analysed. For each of the variables a cross-tabulation was made between that variable and SUV vs. passenger car. When in these cross-tabulation a significant correlation between the two variables was detected by the Pearson Chi-squared test, the adjusted residuals (a.r.) were inspected for significant deviation, which are two or more standard deviations from the expected values. The expected values are calculated based on the assumption of independence of two variables.
The VOR database contains accidents with killed (K), seriously injured/hospitalised (SI), slightly injured/non-hospitalised (SLI), unknown injuries and ‘damage only’ (DO). It is known that around 95% of all accidents related to fatalities are registered in the VOR database. It is estimated that 85% of all traffic accidents are included in the database, where a person was injured. For accidents with slight injured persons involved a value of 40% is estimated. Due to representation issues, only accidents in which fatalities and/ or injuries (K+SI+SLI) occurred are discussed in the following section.
For an internal TNO Automotive study every accident was investigated where a SUV was involved and where the Technical department of the police (TOD) made a report. The police officers from the mentioned regions contacted DART when an accident with a SUV happened. The team started an investigation when the criteria are met.
Apart from these cases, DART collected data from old SUV accident cases from 1998 to 2002 in the region “Rotterdam-Rijnmond”. The team did not collect any information at the specific accident location nor inspected the vehicles involved, because of the time gap between the accident occurrence and the investigation. It is obvious that the level of detail of the data will be lower than the normal in-depth research procedure. In total 32 accidents were investigated.
Due to the fact that only SUV accidents were collected and investigated for this part of the study, a comparison between SUVs and cars cannot be made.
RESULTS
National Traffic Accident Statistics Analyses
General analyses on aggressiveness and lethality
A total of 650 SUV accidents are analysed, where fatality and or injury has occurred within the SUV and or the passenger car. With the same criteria 44559 passenger car accidents are analysed. This second group is used as a so-called ‘comparison group’ or ‘control group’.
First co-linearity is treated followed by a general analysis of passenger car and SUV accidents. This general analysis is done, to identify to what extent vehicle accidents might ‘differ from’ or ‘be equal to’ SUV accidents. All variables that were coded in the VOR-database that might influence accident causation or severity were also analysed.
Co-linearity
In the research on aggressiveness of SUVs compared to passenger cars a major problem exists. The main factors which distinguish SUVs from passenger cars (mass, bumper height, stiffness) are highly correlated with these vehicles, except for mass. The large bumper heights and high body stiffness are found in SUVs and not in passenger cars. This high correlation between SUVs and these other parameters makes it impossible to state statistically what causes have a relationship with the aggressiveness. The only statement that can be given is whether SUVs are more aggressive than passenger cars, either compensated for the mass effect or not. It cannot be said that this may be due to bumper height or vehicle stiffness.
Cross-tabulation analysis
For all variables that are coded in the VOR-database that might have a relationship with accident causation or might influence accident severity, cross-tabulations are executed between those variables and the vehicle type, being SUV or passenger car. So a comparison is made between passenger cars and SUVs. All the frequency counts that are presented in the cross-tabulations (N) are the number of SUVs that are involved.
The objective is to find to what extent the SUV crashes differ from passenger car crashes. If no differences are found, this can be considered positive for the analysis, because then both classes are involved in the same type of accidents. When differences are found, they might have influence on
accident severity. So in order to say something about possible differences in lethality or aggressiveness, one needs to statistically compensate for these differences. This can be done with a method called (logistic) regression analysis.
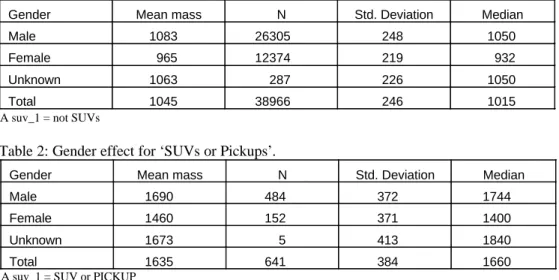
Table 1 and 2 show a strong relationship between vehicle mass and gender (gender effect). Female drivers were driving significantly lighter vehicles than male drivers in the accidents that are stored in the database.
Table 1: Gender effect for ‘Not SUVs’.
Table 2: Gender effect for ‘SUVs or Pickups’.
For the following variables that are coded in the VOR-database, no differences between passenger car accidents and SUV accidents were found:
• Type of accident; • The accident cause;
• Impact location, both bullet and target vehicle;
• Movement of the vehicle(s) after the accident, both bullet and target vehicle; • Type of manoeuvre;
• Locations on the road before the accident (bullet + target);
• Road type; • Weather;
• Intended manoeuvre (bullet + target); • Gender of the driver of the target vehicle; • Collision opponent.
Also no difference in aggressiveness between SUVs is found based on SUV vehicle mass and SUV bumper heights. So, heavier SUVs are not more aggressive than lighter SUVs. Nor are SUVs with a higher average bumper height more aggressive than SUVs with a lower bumper height.
Factors that did differ significantly between passenger car accidents and SUV accidents are: • Accident types:
- Gender of the driver of the bullet vehicle; Significant more male drivers of SUVs (76%) are involved in accidents, for passenger cars this figure is (68%);
- Speed limit roads; SUVs are more involved in accidents on 80 km/h roads (a.r.=3.1, N=180, 28%) and less on 50 km/h roads (a.r.= -2.4, N=362, 56%);
- Areas; There are more SUV related collisions found in non-urban areas in comparison to passenger cars, 42% versus 37%, (a.r.=2.6,
N=272). Less SUV related collisions are found in urban areas in comparison to passenger cars, 58% versus 63%, (a.r.=-2.6, N=378).
• Accident severity:
- SUV occupants are less likely to get killed in an accident than passenger car occupants, 0.3% versus 1.3%, (a.r.=-2.3, N=2);
- SUV occupants have significantly less chance to get killed or seriously injured in case of an accident than passenger car occupants, 8.5% versus 13%, (a.r.=-3.1, N=55);
- Opponent vehicle occupants have a significantly higher chance to get killed being involved in an accident with a SUV then being involved in a passenger cars accident, 2.6% versus 1.1%, (a.r.=-3.8, N=17);
- Occupants in the target vehicle have a significant higher chance to get killed or being seriously injured when involved in an accident with a SUV then when involved in a passenger cars accident, 25% versus 19%, (a.r.=-4.2, N=164).
It has to be noted that these differences in accident severity do not yet indicate that there is a higher aggressiveness of SUVs compared with passenger cars. The aggressiveness can only be estimated when taking into account the differences in accident types and differences in vehicle characteristics (mass, geometry and stiffness).
Gender Mean mass N Std. Deviation Median
Male 1083 26305 248 1050
Female 965 12374 219 932
Unknown 1063 287 226 1050
Total 1045 38966 246 1015
A suv_1 = not SUVs
Gender Mean mass N Std. Deviation Median
Male 1690 484 372 1744
Female 1460 152 371 1400
Unknown 1673 5 413 1840
Total 1635 641 384 1660
Regression analysis
Logistic regression analysis is a statistical predicting method based on one ore more factors or variables. The method estimates the independent effects of input parameters on the outcome as for example aggressiveness.
- Aggressiveness
A logistic regression analysis was performed to identify to what extent vehicle mass and gender relate to vehicle aggressiveness, more explicit: the probability that a collision opponent will get killed or seriously injured, taking into account vehicle type, mass and gender of the driver. Table 3 shows that increasing mass, increases the probability to get killed or seriously injured (sig< 0.05 and Exp(B)> 1). A significance level less than 0.05, indicates a significant difference with a 95% confidence level. An Exp(B) larger than 1 indicates an increasing probability.
Females have an injury reducing effect, possibly due to the fact that they drive lighter cars (sig<0.05, Exp(B)<1). Whether the actual vehicle is a SUV, is not relevant (sig>0.05, Exp (B) ~1). The global effect of aggressiveness can be mainly related to vehicle mass, according to the VOR analysed accidents.
- Self-protection (Lethality)
A logistic regression analysis was also performed to identify to what respect vehicle mass and gender relate to vehicle lethality, more explicitly the probability that the driver or passengers in the SUV will get killed or seriously injured. It is found that an increasing mass (sig<0.05, exp(B)< 1) has an injury reducing effect. Gender plays a role but is not significant at the 95% confidence level. Whether the vehicle is a SUV or not is not relevant. Therefore the mass is the most relevant factor for self-protection. A larger vehicle mass reduces the injury level for the occupant, according to the VOR analysed accidents.
Analyses in relation to the collision partner
A total of 650 SUV accidents are analysed, where fatality and or injury has occurred within the
SUV and / or the passenger car. With the same criteria 44559 passenger car accidents are analysed. Accidents with the following collision partners are analysed in this section:
- Passenger cars; - Vans (Light Trucks); - Two-wheeler; - Pedestrians.
Passenger cars
The number of SUVs involved in a collision with a passenger car is 192 and the number of passenger car to passenger car collisions equals 19739.
For both SUVs and passenger cars the head-tail collisions are most frequent (45%), followed by side impacts (40%) and thereafter frontal impacts (12%). The parking accidents occur in 3% of the cases. The impact location on the mid-front is more
pronounced (45%). With SUVs the impact point is somewhat more to the right-front, 10% versus 6% (a.r = 2.6, N=28). More male drivers are involved in relation to passenger-drivers, 73% versus 67% (a.r.=2.0, N=212).
Related to the type of road and road side, SUVs are significantly more often involved in accidents with passenger cars on the right side of normal two lane roads, 71% versus 65%, (a.r.=2.1, N=207). There is a slight indication that SUVs are more involved on 80 km/h roads, 30% versus 26% (a.r.=1.5, N=88). Most accidents occur in urban areas on 50 km/h roads (51%).
The probability to get killed, for both vehicles, in an accident with SUV involvement is not higher than in accidents with only passenger car involvement. There is however a trend that is confirmed when taking into account severe injuries in the analysis.
The probability to get killed and/or seriously injured for:
• SUV passengers is significantly lower than for the persons in passenger cars, 8.2% versus 15% (a.r.= -3.0, N =24). This effect disappears
95.0% C.I.for EXP(B) B S.E. Wald Df Sig. Exp(B) Lower Upper Step Mass .001 .000 98.68 1 .00 1.001 1.000 1.001
1 Gender .092 .097 .91 1 .34 1.097 .907 1.326
SUV -.139 .028 24.85 1 .00 .870 .824 .919
constant -1.690 .093 330.29 1 .00 .184 A Variable(s) entered on step 1: mass, SUV (0= no, 1= yes), gender (male = 0, female = 1) Table 3: Variables in the equation for the prediction of aggressiveness.
in a logistic regression analysis with the vehicle mass taken into account;
• The passengers in the collision opponent is significantly higher with a SUV collision related to a passenger car to passenger car collision, 21% versus 15%, (a.r.=3.0, N=61). Logistic regression analysis shows that mass is the main predictor for accident severity. The vehicle type is not anymore relevant and the difference found above is caused by the higher vehicle mass compared to the mean mass of passenger cars
Vans (Light Trucks)
The number of SUVs involved in an accident related to Vans is 34 and the number of passenger car within this type of accident equals 2574. The numbers are small and the results are therefore presented as trends and not as real significant differences.
There is a trend towards more head/tail accidents with SUVs, in comparison to passenger car accidents, 65% versus 47%, (a.r.=2.0, N=22) and towards slightly less side impacts, 21% versus 40%, (a.r.=-2.3, N=7). There is more often a collision point on multiple locations on the Van in collisions with SUVs (24%), in comparison with passenger car – Van accidents (5%) (a.r.= 4.7, N=8).
More male SUV drivers are involved in accidents with Vans then male passenger car drivers, 85% versus 66%, (a.r.=2.4, N=29). A strange observation is that in Van - SUV accidents, the driver of the Van is percentage wise more often a female driver (32%) in comparison with car – Van accidents (9%) (a.r.= 4.5, N = 11). This difference cannot easily be explained.
No difference is found in road type, which is in contradiction to other categories.
There is no difference in aggressiveness between SUVs and passenger cars against Vans. There seems to be a light trend towards better self-protections for SUV occupants (a.r.= -2.1, 6% vs. 20% fatal and/or seriously injured, N= 2 vs. N=521). But when vehicle mass is taken into account in a regression analysis, this effect disappears.
Two-wheelers
The two-wheeler selection covers: motorcycles, mopeds, mofas and bicycles. The number of SUVs involved in an accident with a two-wheeler is 224 and the number of passenger cars within this type of accident equals 15292.
Fatality or injury rate of the two-wheeler rider related to the SUV accident is significantly higher than related to a passenger car accident:
• Fatality rate SUV versus passenger car, respectively 4.5% and 1.6% (a.r.=3.3, N=10); • Fatality or seriously injured rate SUV versus
passenger car, respectively 36% and 29% (a.r.=2.2, N=80).
The injury levels of the SUV occupant do not differ significantly from car occupants in two-wheeler accidents. Binary logistic regression analysis shows again that vehicle mass is the main indicator for injury severity.
Gender of the SUV driver is not a significant factor in two-wheeler accidents.
Pedestrians
The number of SUVs involved in an accident with a pedestrian is 32 and the number of passenger cars within this type of accident equals 1756.
There is no difference in male SUV or passenger car drivers involved in accidents with pedestrians.
The probability to get killed or seriously injured for pedestrians is independent of the vehicle type (SUV or passenger car). The numbers are too small to draw a conclusion. There seems to be a trend towards higher probability for pedestrians to get killed or seriously injured in an accident with a SUV (56% versus 42%, a.r.= 1.6, N=18).
However, when a logistic regression analysis is done, a trend is spotted for higher aggressiveness of SUVs (sig<0.1, 90% confidence interval), due to the compensation of gender (sig<0.05, females reduce accident severity possibly due to lower vehicle weight). Therefore, for pedestrians the geometry or stiffness of a SUV may be of influence.
TNO Automotive In-depth Accident Database analyses
Damages
For the SUVs 47 damage locations were identified. In Table 4 the number of deformations per collision partner type is shown. Most frequent are damages on cars followed by objects or the ground and powered two-wheelers.
‘SUV - Car’ deformation locations
Combined deformation locations from CDC-coding [9] show for ‘SUV - Car’ impacts, that cars seem to be more frequently damaged on the side (8+4) than SUVs (4+2) and that SUVs seem to be more frequently damaged from the back (6 versus
0). There seems to be no real difference in frequencies of frontal interactions. Five damages are caused by side to side interactions. In three cases no damages are found on the SUV, while the car is damaged.
When vertical and lateral locations are taken into account, it can be checked if over-ride situations occur. There is a weak indication for some over-ride problems in collisions between cars and SUVs. (More proof for under-ride will be given in the section “Case-by-case analysis from accident photographs”) Most frequently the lower half of both vehicles is damaged (E). In five cases the total height of the car is damaged (A); for the SUV only two damages are coded over the total height (A).
‘SUV - Object’ deformation locations
In four cases an impact occurred but no deformation on the SUV was found. The front and left side seem to be most frequently damaged in a collision with an object.
‘SUV - Powered two-wheeler’ deformation locations
The deformation locations on the ‘powered two-wheelers’ seem to concentrate on the front of the vehicle. In impacts with powered two-wheelers, there seems to be a tendency that the full height of the two-wheeler is damaged (A), while on the SUV only the lower half or bumper area is damaged (E and L).
Injury levels
For the SUV in-depth research, it was tried to obtain the injuries from the victims. In 21 accidents of the 32 investigated accidents, persons were injured. 40 known injuries were coded and from eight persons it was known that they were injured but the injury level was unknown.
‘SUV - Powered two-wheeler’ injury levels
The most injuries caused by the vehicle side are abdominal injuries and injuries on the extremities (mostly fractures). Injuries resulting from the contact with the pavement are various. The injury
levels for the powered two-wheeler rider vary from AIS 1 to AIS 4. Most frequently AIS 2 injuries were noticed, which are mainly fractures and some dislocations. AIS 4 injuries are a lung hemothorax with hemomediastinum and a gallbladder laceration.
‘SUV - Car’ injury levels
Unfortunately, for car occupants many injury causes are unknown. Injuries caused by the car interior, are mainly injuries on head and face. AIS levels for the car occupant are at maximum AIS 3. Here, the AIS3 injury is an unspecified brain injury. Also some low injury spine and neck injuries were found.
SUV occupants were hardly injured in the investigated accidents; only some bruises were found and some unknown injuries. The injuries were obviously caused by the SUV interior: one by the steering wheel and one by the front door. It seems that injury levels for the SUV occupant might be lower than that of their collision partners; SUV occupants are more frequently uninjured, which might point to a safer environment for the SUV occupant.
Case-by-case analysis from accident photographs
The photographs of accidents from the TNO Automotive In-depth database concerning SUVs and from the European Accident Causation Study (EACS) project were used for further analysis of the vehicles’ damage. In total, 37 cases were analysed from which 10 from the EACS project. The pictures were taken by the various research groups (TNO Automotive and/or other European institutes) or by the Dutch accident police departments during the on-scene inspections, the reconstruction of the impact position of the vehicles, and/or the technical inspection of the vehicles.
The 37 cases can be divided into five categories:
- Frontal/rear impact (n=14); - Side impact (n=9);
- Rollover (n=3); Collision partner Frequency Percent Valid Percent
Cumulative Percent Truck 2 4.3 4.3 4.3 Powered two-wheeler 10 21.3 21.3 25.5 Object or ground 11 23.4 23.4 48.9 Van 2 4.3 4.3 53.2 Car or car-derivative 22 46.8 46.8 100.0 Total 47 100.0 100.0
- Impact with two-wheelers (n=8); - Impact with pedestrians (n=3).
The results of the photographs’ analysis can be divided into the following categories:
- Bumper height; - Protruding objects; - Stiffness of the SUV; - Rollover of SUVs.
Bumper height
The height of the bumper of the SUV was a parameter, which influenced the development of the crash in many accidents. The accident configurations that have been studied are head-on collision (SUV versus passenger car), rear-end collision (SUV versus passenger car and vice versa) and side impact (SUV versus passenger car and vice versa).
Figure 1 illustrates the height of the lowest point of the bumper of a SUV from the ground compared to the height of the bumper of a passenger car. This difference exists because the vehicles are built as terrain vehicles. A terrain vehicle and now the SUV too is equipped with large diameter tires and with big stroke shock absorbers so the ground clearance of the frame and the components underneath the vehicle needs to be high enough to avoid contact with the rough surface during off-road driving.
It is noticed from the analysis of the photographs that when a passenger car crashes into the rear of the SUV, the front of the passenger car dives under the rear of the SUV (Figure 2-left). This is even more serious when the passenger car decelerates before the impact. The front suspension system is compressed, the front of the vehicle lowers towards the ground and the passenger car dives under and lifts the rear end of the SUV during the impact (Figure 2-right). The disadvantage in both scenarios is that energy is absorbed by the top of the hood, whereas the hood is not designed for this purpose and this gives huge deformations. The easily deformed metal sheet could cause injuries to the occupants.
Another accident scenario where the SUV runs into the rear of a Van was also observed. The SUV hits the rear door because of the high positioned SUV bumper and the low positioned bumper of the Van. The Van normally has a low height of the loading floor from the ground, which makes the loading of the vehicle easier. A possible danger in this case is that the rear door can easily collapse during an impact and the SUV may penetrate the loading compartment. Some Vans are modified by the manufacturer into ‘nine-person’ buses. The rear row of seats (usually three seats) is placed very close to the rear door and in case of an impact this may cause injuries.
Bull-bars and other protruding objects
Many objects installed on a SUV are observed in the pictures, which can increase the severity of an accident. A frequently seen object is the ‘Bull-bar’. The shape and the material of the bull-bar are the two important parameters. The danger of this construction is that the bar will apply the impact force and not a broad surface. This will increase the local penetration depth. In two-wheeler and pedestrian accident the bull-bar will increase the chance for a bone fracture of the rider and the pedestrian.
In many cases the pipes of the bull-bar were not deformed during the impact. The difference in
stiffness between the bull-bar and the impact partner was huge. As a result of this, the deformation of the partner increased. Bull-bars must be banned from vehicles in normal traffic or more attention must be paid to the design of the bull-bars and to the choice of the material.
Another object that could be dangerous is the outside mounted spare wheel at the rear door of the SUV. When a passenger car crashes into the rear of a SUV, the spare wheel will push the hood towards the rear (Figure 2-right). The deformed or displaced hood may break the windshield and may come through the occupant’s compartment. The spare wheel largely increases the under run effect. Figure 1. Difference in the height of the bumpers.
Figure 2. Under run effect.
When a high-fronted vehicle (such as a truck, a bus, or van) crashes into the back of a SUV, the spare wheel will move into the SUV (the wheel is stiffer than the door), deforming the rear door at the same time. The wheel is protruding the rear end approximately 300 to 400 mm and therefore it increases the deformation extent 300 to 400 mm locally. The passengers on the rear seat are more endangered to sustain injuries.
Ornaments on the top of the hood (fastened with screws) or fog lights attached to the bull-bar may cause or increase the injuries during an impact with a two-wheeler rider or a pedestrian. Foldable ornaments and fog lights are an easy solution, but this solution is effective only during a frontal impact or only during a side impact with the ornament or the lights, depending on the direction in which they fold.
Two other objects that may be found at the SUV front are a towing hook and/or a winch. Because of their shape and stiffness and the fact that these objects are rigidly attached to the longitudinal ladder frame, these objects may become very dangerous during a side impact or during an impact with a pedestrian.
Stiffness of the SUV
An important factor in compatibility is the crash stiffness of the SUV. SUVs are much stiffer compared to passenger cars. This is caused by the principle of chassis construction. Most SUVs are built on a ladder chassis with stiff beams, where
passenger cars in general have a uni-body construction.
The SUV with the ladder chassis construction is more aggressive, due to the fact that the beams of the ladder chassis are very stiff. Also from the pictures of the real accidents (Figure 3) it can be seen that the damage to the SUVs is rather small, where the target vehicle has extensive damage, in frontal accidents.
Rollover of SUVs
SUVs tend to rollover more easily due to a higher centre of gravity and this type of accident is of special interest from the fact that a relatively high percentage of the SUV occupants die. The problem with rollover is two-fold:
- The deformation of the roof of the vehicle results to a little survival space at the top. This is due to the construction of the car, such as lowering the centre of gravity by reducing the weight at the upper part (A-, B- and C-pillar). In case of rollover, the construction is not strong enough to resist the impact. An example is the left picture in Figure 4; - Most common is the ejection of the SUV passengers in a rollover, especially in the case of not wearing the safety belt. In the left picture in
Figure 4 the windows are broken and ejection may occur. From the in-depth TNO rollover cases no fatalities are reported.
CONCLUSIONS Figure 3. The front of a small passenger car that drove into the back of a SUV.
SUV’s are significantly more aggressive against vulnerable road users. Problems with SUV crashes
to other vehicles are related amongst others to compatibility, except for commercial vehicles. However in this study no difference is found between heavy passenger cars and SUVs. SUVs are about as heavy as the average full-size passenger car. So the same mass difference occurs between passenger car classes (e.g. full-size and small cars).
Although the bumper height is about 20% higher compared to passenger cars, this difference could not directly be related to an increase in injury severity in this study due to the lack of data. Nevertheless, based on accident pictures and other investigations, it is believed that mass, frontal stiffness and geometry factors play a role in the compatibility between SUVs and other road users.
Regarding accidents with injurious outcome, SUVs are generally involved in the same kind of crashes as normal passenger cars. Side impacts and ‘head – tail’ impacts are most frequent, followed by frontal impacts. Collisions between SUVs and passenger cars are relatively more frequent on 80 km/h roads, for SUV’s against trucks however this trend could not be observed. The speed of the SUV (and of a passenger car) has a significant influence on the prediction for the collision opponent to get killed or seriously injured.
Mass of the striking vehicle is a factor in the prediction of accident severity. The accident data used in this study did not allow to distinguish whether this 'mass' aspect contains hidden stiffness and geometrical aspects such as bonnet height and bumper height, due to high correlation between mass, stiffness and geometrical aspects.
For aggressiveness it was found that striking vehicle mass is the main predictor for the accident severity. A higher vehicle mass as such increases the accident severity, whatever the type of vehicle (SUV or passenger car). From the 32 in-depth cases studied, the resulting injuries of car occupants observed were mainly to head and face and at maximum AIS 3 (serious). SUV are significantly
more aggressive towards pedestrians and powered two-wheeler riders than passenger cars, even when
compensated for the mass differences. The in-depth data showed that the injury of powered two-wheeler riders were mainly bone fractures. The level varied from AIS 1 (light) to AIS 4 (fatal). With under-run accidents by passenger cars the difference in the height of structural parts, but also other external geometric features of the SUV may play an important role in the damage and injury sustained.
With respect to fatality there is tendency towards a slightly better crash protection for the SUV driver and his passengers, than for the driver and passengers of a ‘normal’ passenger car. SUV occupants seem to be more frequently not injured in a crash. This might indicate a safer environment for the SUV occupant, but it is most probably due to the higher vehicle mass, less absorbed energy and resulting intrusions in a crash.
With respect to the gender of the driver, SUVs are more frequently driven by males than by females. In the analysed accidents males are also found to generally drive heavier vehicles and for that reason they are found to be a significant factor in the prediction of fatality and serious injuries for the occupant(s) in the struck vehicle. In this respect, female SUV drivers significantly decrease the probability at fatal or serious injuries for struck car occupants. This effect might be partly due to the fact that in general women involved in accidents drive significantly lighter cars than males involved in accidents.
RECOMMENDATIONS
Design recommendations
Concerning the aggressiveness, the front and rear ladder chassis construction could be redesigned to a less aggressive during an impact with a passenger car. The height of the bumper and other load bearing components of SUVs could be made more compatible to other road vehicles. Figure 4. Rolled over SUV, left a frontal rollover, right a side rollover.
Ornaments and fog lights could be integrated in the front and the spare wheel could be placed within the vehicle, in a similar way as the spare wheel of the passenger cars.
The use of a winch needs to be considered for strictly limited or no admittance on public roads. An easily demountable version of the winch should be developed.
Attention should be paid to the bar. A bar is of no use in road traffic. In principle the bull-bar is an add-on structure and was not part of the safety considerations by the manufacturer. A closer bull-bar construction, allowing less space in between the bars and not protruding the width of the vehicle should be designed. A suggestion could be a more restricted regulation, which would allow the use of a bull-bar only if it has no negative effect on the safety of other road-users.
With respect to lethality, a less deformable SUV roof and upper pillars have to be designed, to prevent the collapse of the roof during rollover accidents.
Recommendations to improve the analyses
The effect of mass needs further investigation with a study in which passenger cars and SUVs in identical mass-classes should be compared. The two groups need to be of equal mass-distribution. Difference between the two categories could then be explained by geometry (e.g. bumper height, height of principal force) or stiffness characteristics.
The effect of gender needs to be further investigated through a so called ‘control group’. Video shots at random locations should be able to give information about the frequency of male and female drivers in passenger cars and SUVs. Compared with accident data, this information could give valuable information about driving behaviour differences between men and women, and information about average vehicle mass in these categories.
ACKNOWLEDGEMENTS
The authors would like to acknowledge the Dutch Ministry of Transport, Public Works and Water Management, Directorate-General for Passenger Transport (DGP) for supporting this study.
REFERENCES
[1] Summers, S.M., Prasad, A., Hollowell, W.T., 2002, NHTSA’S Research program for Vehicle aggressivity and fleet compatibility, Paper #249
[2] U.S. Department of Transportation National Highway Traffic Safety, 2000, Administration Traffic Safety Facts 2000
[3] Jocks, H.C., 1998, Vehicle Aggressivity: Fleet Characterisation Using Traffic Collision Data, report number DOT-VNTSC-NHTSA-98-1 [4] Gabler, and Hollowell, W.T., 2000, SAE paper 980908, The aggressivity of Light Trucks and Vans in traffic crashes
[5] Ross, M., Wenzel, T., 2002, An analysis of traffic deaths by vehicle type and model, Report prepared for the U.S. department of Energy, report number T021
[6] Parenteau, C., Thomas, P., Lenard, J., 2001, US and UK Field rollover Characteristics, SAE paper 2001-01-0167
[7] Deutermann, W., April 2002, Characteristics of fatal rollover crashes, report number DOT HS 809 438
[8] SPSS, 1999, SPSS Base 12.0 Application Guide [9] Collision Deformation Classification (CDC), SAE J224 MAR80
[10] Hoogvelt, R.B.J. et al, 2004, Impact of Sport Utility Vehicles on Traffic Safety and the Environment in The Netherlands, TNO Automotive report, Delft, The Netherlands