8 1986 Alan R. Liss, Inc. Cytometry 7:391-395 (1986)
~ _ _ _
TECHNICAL NOTE
Flow Cytometric Estimation of Cell Cycle Parameters
Using
a
Monoclonal Antibody
to
Bromodeoxyuridine
Kohsuke Sasaki,
Tornoyuki
Murakami, Tetsuro Ogino, Manabu Takahashi, and Shoji Kawasaki
Departments of Pathology (K.S., T.M., TO., M.T.) and Radiology (S.K.), Yamaguchi University School of Medicine,Ube-shi, Japan
Received for publication December 10,1985; accepted March 16, 1986
An estimation of cell kinetic parameters was made by simultaneous flow cytometric mea- surements of DNA and bromodeoxyuridine (BrdUrd) contents of cells. The procedure de- scribed in this paper involves the incorpora- tion of BrdUrd by S phase cells, labeling the BrdUrd with an indirect immunofluorescent technique using a monoclonal anti-RrdUrd antibody, and staining
DNA
with propidium iodide (PI). The amount of incorporated RrdUrd in HeLa cells was proportional to that of synthesized DNA through S phase. For all cell lines examined, the pattern of BrdUrd incorporation was essentially the same and the rate of DNA synthesis during S phasewas
not constant. The bivariate BrdUrd/DNA dis- tributions showed a horse-shoe pattern, max- imum in the mid S phase and minimum in theearly and
late
S phases. Furthermore, the du- rations of cell cycle Cl'c) andS
phase CTs) were estimated from a FLSm (fraction of labeled cells in mid S phase) curve that was generated by plotting the percentage of BrdUrd pulse- labeled cells in a narrow window defined in the mid S phase of the DNA histogram. The values of these parameters in NIH 3T3, HeLaS3,
and HL-60 cells were in good accordance with the reported data. This FCM method us- ing the monoclonal anti-BrdUrd antibody al- lows rapid determinationof
both cell cycle compartments and also Ts and Tc without the use of radioactive DNA precursors.Key terms: Dual-parameter
FCM
analysis, DNA synthesis rate, cell kineticsWith the advent of flow cytometry (FCM), rapid quan- titation of cellular DNA content has become feasible, and this technique has been increasingly employed in studying cell kinetics. Many mathematical methods have been reported in a n attempt to resolve DNA distri- butions into the three compartments of cell cycle, G1, S,
and G2M. For the more reliable estimation of cell ki- netic parameters, knowledge of the DNA synthesis rate
is a necessary and biologically interesting subject (2,3,13,14). However, the pattern of the DNA synthesis
rate throughout the S phase is still a matter of controversy.
Recently, a monoclonal antibody against bromodeoxy- uridine (BrdUrd), which is a pyrimidine analogue of
thymidine, was developed (11,lZ) and now is commer- cially available. Dolbeare et al. (4) demonstrated a tech- nique for the simultaneous flow cytometric analysis of
cellular DNA content and the amount of incorporated BrdUrd in DNA, This facilitates a rapid and accurate quantitation of cells in different compartments of the cell cycle, and a n assessment of the process of cellular DNA synthesis during
S
phase without any laborious procedures. However, the durations of various phases of the cell cycle for exponentially growing cell populationscannot be determined by flow cytometric analysis of DNA content alone. The fraction of labeled mitoses
@LM) method has been widely used to measure the cell cycle parameters both of normal and tumor cells. Fur- thermore, Gray and his colleagues (12) have unequivo- cally demonstrated the RCSi (radioactivity per cell in
Si) method in which the durations of cell cycle phases are estimated by the serial measurements of radioactiv- ity of cells that were pulse-labeled with 'H-thymidine and then were flow sorted from the mid S region of the FCM DNA histogram.
Our attempt is to use a monoclonal anti-BrdUrd anti- body for the rapid estimation of the durations of cell cycle (Tc) and S phase (Ts). These parameters can be estimated by the FLSm (fraction of labeled cells in the mid S phase) curve that is provided by plotting labeling indices in a narrow window against the time after BrdUrd pulse-labeling. Although the BrdUdDNA FCM
Presented a t the Kansai Flow Cytometry I11 Conference, Osaka,
April 1985. This work was supported in part by the grant-in-aid for Cancer Research (59-12) from the Ministry of Health and Welfare.
392 SASAKI ET AL procedure presented in this paper also requires sequen-
tial samplings after BrdUrd pulse-labeling as well as the FLM and RCSi methods, this method necessitates neither radioactive DNA precursors nor a procedure of cell sorting. The present communication shows that im- munofluorescent staining of BrdUrd combined with con- ventional DNA staining allows rapid and reliable FCM estimation of some parameters of cell kinetics.
MATERIALS AND METHODS
Cell Culture
Four different cell lines, NIH 3T3, HeLa 53, WI-38 and HL-60 cells were used. The former three lines were maintained in a Petri dish with Dulbecco’s modified Eagle’s medium (Nissui Seiyaku Co.) supplemented with
10% calf serum (Flow Lab.) at 37°C in a humidified atmosphere of 95% air and 5% COz. HL-60 was cultured in
RPMI
1640 medium (Flow Lab.) supplemented with10% calf serum. All cell lines were used at a n exponen- tially growing phase after subculture in completely fresh medium.
Continuous Labeling With BrdUrd
To examine the relation between the intensity of FITC fluorescence and the amount of incorporated BrdUrd in a cell, HeLa cells were exposed to the BrdUrd (10 pM, Sigma Chemical Co.) for 14 h, a n interval corresponding to the slightly longer period than the duration of S
phase, harvested using 0.04% trypsin solution, and fixed in 70% cold ethanol.
Pulse-Labeling With BrdUrd and Chase of the Labeled Cells
For the determination of the relative DNA synthesis rate and periods of cell cycle (Tc) and S phase (Ts), the three cell lines were labeled with 15 p M BrdUrd at
37°C. Ten minutes later, the pulse-labeled cells were washed twice with the warm culture medium and recul- tured in the BrdUrd-free standard medium to monitor their traverse through the cell cycle. The cells were taken 0.5- to 3-h intervals for 36 h and they were fixed as described above and stored a t 4°C.
Staining Procedure
The ethanol-fixed cells were rinsed with cold PBS and incubated in 4 N HC1 a t 20°C for 20 min. The ceIls were washed twice with borax-borate buffer (pH 9.1) and sub- sequently once with
PBS,
suspended in 1 mlPBS
con- taining 0.5% Tween 20 (Sigma Chemical Co.), 0.5% bovine serum albumin (BSA, Calbiochem-Behring Co.), and 10 pl of a monoclonal anti-BrdUrd antibody (Becton- Dickinson Co.), and incubated a t 20°C for 1 h. After washing twice in PBS, the cells were next exposed to FITC-conjugated goat antimouse IgG antibody (Cappel Lab.) diluted 1:lOO with PBS including 0.5% Tween 20 and BSA a t 20°C for 30 min. After rinsing once in PBS, the cells stained with FITC were resuspended in PBScontaining 0.1% RNase (Sigma Chemical Co.). The staining of DNA was performed in 5 pg/ml of propidium
iodide (PI, Calbiochem-Bering Co.). Clumps of cells were removed by passing the specimens through 43-pm nylon mesh and subjected to FCM analysis. As control, the cells with no BrdUrd label were prepared by the same staining procedure as the BrdUrd-labeled cells.
Flow Cytometry
Flow cytometry was carried out with a Becton Dick- inson FACS Analyzer. The instrument was adjusted to optimal resolution (coefficient of variation, CV:less than
2.0%) by the use of standard fluorescent beads (Coulter Electronics). FITC and
PI
dyes were simultaneously ex- cited when the doubly stained cells were exposed to the blue light (485 nm) from a n arc lamp. Red fluorescence from PI was collected through a 605-nm long-pass filter and recorded as measure of cellular DNA content, and green fluorescence from FITC was collected through a 530-nm band-pass filter. Routinely, 20,000 cells were measured a t flow rate of less than 50 cellsisec to mini- mize interference of each cellular fluorescence signals, and a 256-channel histogram was generated.In dual-parameter flow cytometry, gated analysis per- mits selective analysis of cellular BrdUrd content on the basis of criteria set by DNA content. To deduce how the rate of DNA synthesis changes as a function of the position in S phase, gated analysis was applied to the doubly stained cells at various stages within the fraction of S phase. For comparison of BrdUrd incorporation rate in different parts of the S phase, BrdUrd content was quantified on the basis of the average channel (fluores- cence intensity). The average value of relative BrdUrd content was determined from the distribution obtained on each gated window within S phase; the average chan- nel number was calculated by the integral value of the distribution divided by the number of labeled cells, and these values were plotted against the corresponding DNA contents. For measurement of Tc and Ts, like RCSi analysis (13), cells in S phase were pulse-labeled with BrdUrd at the start of the experiment, and thereafter the labeled cells were allowed to progress through the cell cycle. An electronic window was placed on a subpop- ulation of cells in the mid S phase (mid 5 channels in DNA histogram corresponding to 6% of 4C DNA). The percentage of BrdUrd-labeled cells was determined in the narrow window in mid S phase using a technique of gated analysis. For calculation of the percentage of FITC-
labeled cells (DNA synthesizing cells), the threshold was
set to exclude nonspecific fluorescent cells on the basis
of the fluorescence of the control cells. The labeled cells in the window were scored and the labeling index (LI)
was determined by the following equation: LI = the number of labeled cells in the windowithe number of
cells in the window x 100. These signals were also recorded as a n X-Y dot-plot distribution reflecting BrdUrd and DNA contents, respectively. The FLSm curve was generated by plotting the labeling indices against the time after BrdUrd pulse-labeling. From the graphic analysis, cell cycle parameters can be extracted.
CELL CYCLE ANA1,YSIS BY ANTI-BRDURI) ANTIBODY 393 RESULTS
Discrimination between labeled and unlabeled cells was substantially easy in the bivariate BrdUrd/DNA distribution since the labeled cells have elevated green fluorescence as compared with nonlabeled cells. The clusters of cells corresponding to G1 and G2M showed only nonspecific binding to the antibody since the unla- beled control cells prepared as well a s the labeled cells demonstrated the same fluorescent level as G1 and G2M
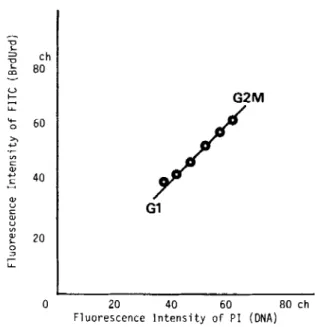
cells treated with BrdUrd. In contrast, the S phase pop- ulations were identified as cells with high fluorescence intensity. In the bivariate FITCPI fluorescence distri- bution of HeLa cells continuously labeled with BrdUrd for 14 h, a n increase in green fluorescence intensity was associated with a n increase in red fluorescence within S
phase of the cell cycle. On five gating windows in the S
phase, the average values of FITC fluorescence intensity calculated after stripping the nonspecific fluorescence intensity from the fluorescence of the labeled cells pro- vided a regression line, Y = 1.08 X (correlation coeffi- cient, r = 0.98) (Fig. 1). Thus, the intensity of FITC fluorescence, or the amount of incorporated BrdUrd in a cell, was proportional to that of replicated DNA. The bivariate distributions showed a horseshoe contour in all cell lines examined, although imperceptible varia- tions in the bivariate patterns were seen for each cell line (Fig. 2). The rate of DNA synthesis increased in the early S phase, reached a maximum in the mid S phase, and dropped sharply again in the late S phase (Fig. 3).
EEciency of BrdUrd incorporation was a function of the position in the S phase. On average, the rate of DNA synthesis in the mid S phase was nearly twice as fast as that in the early and late S phase for 3T3 and HeLa cells. Interestingly, a small fraction of S phase cells (their DNA content corresponding to those of S phase) failed to incorporate BrdUrd; about
5%
of HeLa cells with S phase DNA content was not labeled. The method described here gave reproducible results.In principle, in the method for estimation of Tc and Ts described here, S phase cells that are marked with BrdUrd by pulse labeling a t the start of the experiments were able to continue their cell cycle progression. The cell cycle passage of the labeled cell cohort, as a function of time after pulse-labeling, was monitored by counting the labeled cells within a narrow window (6% of
4C-
DNA content) fixed in the mid S phase of DNA distri- bution. The labeling index fell markedly as the labeled cohort left the mid S phase and remained low as it traversed the late S, G2, M, G1, and earlyS
phases in order. As the labeled cohort re-entered the narrow win- dow, the labeling index increased again to almost the same level as the first cycle. However, the intensity of FITC per cell decreased to half because of the dilution of label with cell division in the preceding mitosis. Dis- crimination between labeled and nonlabeled cells re- mained easy and labeling indices in the window were not largely changed even after one cell cycle transit. The labeling index was plotted against time after pulse-la- beling with BrdUrd. The FLSm curves of 3T3 and HL-G2M
J
Gl
20 40 60 80 ch Fluorescence Intensity o f P I (DNA)
Frc. 1. HeLa 53 cells that are labeled with BrdUrd for 14 h. After subtraction of background fluorescence, the average values of FITC fluorescence intcnsity for subpopulations delineated on the basis of
cellular DNA content are plotted against the corresponding DNA con- tent. The amount of incorporated BrdUrd is proportional to that of synthesized DNA. Ordinate, fluoiyescence intentiity of FITC (BrdUrd content); abscissa fluorescence intensity of PI (DNA content).
+.' c a, Y 0 u -0
5
'c?DNA con t ent
FIG. 2. BrdUrd/DNA dot-plot distribution of asynchronously grow- ing HeLa cells pulse-labeled (for 10 min) with BrdUrd. The cells labeled with BrdUrd fnrrn a horseshoe pattern, although variation in green fluorescence intcnsity is seen for cells with the same DNA content. Green fluorescent intensity from the cells in G1 and G2M phases are just at background levcl.
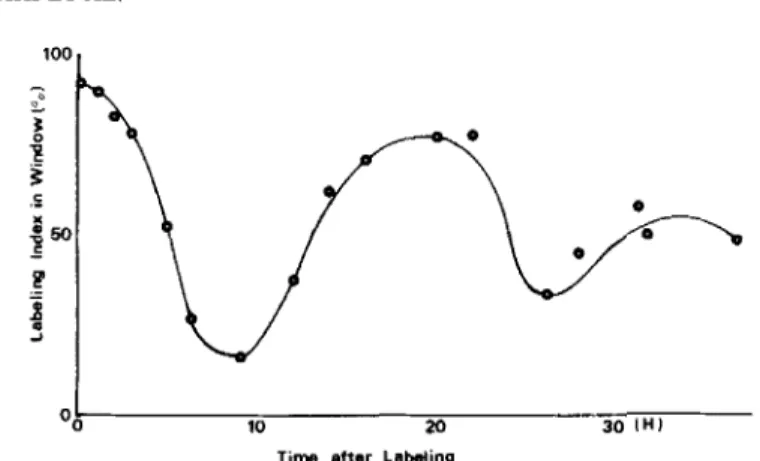
60 cells are demonstrated in Figure 4. The curve that displays the change of the fraction of the labeled cells in a narrow window defined in S phase allowed the flow of labeled cells through the cycle to be followed. After the empirical procedure of cell cycle analysis by FLM and RCSi methods, we graphically estimated cell cycle time (Tc) and S phase period (Ts). The time between the mid-
394 SASAKI ET AL.
-
0Ll
40 a0a
00I
10 20 30 I H IT i m e after Labeling
d
FIG. 4. Extraction of the cell cycle parameters by hand. Solid line: FLSm curves of 3T3 (A). Circles: experimentally measured points. Tc
is the time from the 50% of labeling index on the descending part of
the first wave to the 50% of labeling index on the descending portion
of the next wave and Ts is the time between 50% points of labeling index on the second wave. In 3T3 cells, Tc and Ts estimated are 19 and
11 h, respectively.
Table 1
Tc and Ts Estimated From FLSm Curve
40 80
b
Cell line Tdh) Tdh)P I
6
80P
r
20 U 20I
C
0L'
40 a0 Relative D N A Content ( C h . No.) FIG. 3. The change of BrdUrd incorporation rate throughout S phase. AfZer subtraction of background fluorescence seen in cells in the G1and G2M phases, the plot of the average BrdUrd content against DNA content for S phase cells of NIH 3T3 (a), HeLa 53 (b), and WI-38 (c) lines. All cell lines demonstrate similar BrdUrd incorporation pattern. The average BrdUrd content (channel value) is calculated by the inte- gral value of each distribution.~The rate of BrdUrd incorporation i s
maximum in the mid S phase in the cell populations with DNA content corresponding to the mid S phase.
points of the descending limbs corresponds to Tc. The width of the second peak at the 50% level gives an approximate value for Ts. Tc and Ts for three cell lines are summarized in Table 1.
DISCUSSION
Gratzner and Leif (11) and Dolbeare et al.
(4)
reported that the magnitude of the green fluorescence is propor- tional to the amount of monoclonal anti-BrdUrd anti- body stoichiometrically bound to the incorporated BrdUrd in cells. We have also observed this relationship (data not demonstrated). The bivariate BrdUrmNA distribution of HeLa cells measured after labeling with BrdUrd for 14 h, which is slightly longer than the dura- tion of the S phase, showed a 1:l relationship between3T3 19 11
HeLa 53 20 10
HL-60 20 12
green and red fluorescence intensities. The average value of BrdUrd content in the early S phase cells was slightly over the regression line. This i s probably due to contamination of cells that had been labeled in the pre- vious S phase and entered the next S phase through G2,
M, and G1 phases in order during 14-h-labeling. The amount of incorporated BrdUrd is parallel to that of synthesized DNA throughout S phase. This would imply that BrdUrd is not incorporated preferentially into DNA at a particular period of S phase.
The rates of 3H-thymidine incorporation (DNA synthe- sis) throughout S phase are important for interpretation
of a variety of experiments estimating cell cycle phase durations (2,3,13,14). In the experiment described here, the cells in the G1/0 phase were easily distinguished from the very early S phase cells by the apparent differ- ence of the green fluorescence intensity. This may lend support to the hypothesis that replicons are organized into clusters and that each replicon in a cluster is initi- ated synchronously at a distinct point in S phase (16).
Generally, changes in DNA synthesis rate are accom- plished by altered frequency of initiation of replication (16). The bivariate BrdUrdiDNA content distribution provides direct and unambiguous evidence that the rate of BrdUrd incorporation depends on the position in S
phase. The principal advantage of the method described here is that neither cell synchronization nor cell sorting is required. (If a high degree of synchrony is not achieved, an accurate analysis is impossible. The frac- tions sorted as early and late S phase cells are admixed with a considerable number of G1 and G2 cells, respec-
CELL CYCLE ANALYSIS BY ANTI-BRDURD ANTIBODY 395 tively.) In the cell lines examined in our laboratory, the
BrdUrd incorporation is relatively low in the early and late S phases and maximum in the mid S phase. The average rate of BrdUrd incorporation in HeLa and 37'3 cells in the early S phase was about half the rate in mid
S phase. Dolbeare et al. first demonstrated a horseshoe pattern in the bivariate distribution of CHO cells (7). The results are substantially consistent with the data using radioactive DNA precursor (6,10,13). In contrast, there are several conflicting observations that in WI-38 and HeLa cells the relative rate of DNA synthesis is higher in early and late S phase than in the mid S phase
(1,14,15). We have never detected such a profile, at least in all cell lines in the exponentially growing phase ex- amined in our laboratory (data not shown). The discrep- ancy may be attributed to the difference in the experimental procedures used. The method adopted in these experiments yielded reproducible results, al- though there is a report that thermal denaturation pro- cedure provides better results (5).
The bivariate FCM analysis using a monoclonal anti- BrdUrd antibody permits the rapid and reliable deter- mination of the percentages of cells in the
G1,
s,
and G2M phases of cell cycle without any mathematical procedure. The most important aspect of the method for the determination of Ts and Tc is that the features of the curve accurately track the movement of the cells through the cycle. For cells examined in this study, the contour of the bivariate distribution seen at the start ofthe experiment was generally preserved well even after one cycle traverse, although the amount of incorporated BrdUrd halved with cell division. The duration of the cell cycle can be estimated by observing the cyclic pas- sage of the pulse-labeled cells in the narrow window set in the mid S phase at various times. It would be reason- able to define the window fixed in the mid S phase, since the rate of DNA synthesis as shown by the bivariate BrdUrd/DNA distribution is highest in the mid S phase, i.e., the transit time through the mid S phase is consid- ered to be shortest throughout S phase. The labeling indices within the window can be automatically deter- mined since the discrimination between labeled and un- labeled cells is objectively carried out. The FLSm curve
is generated by plotting the labeling index against the time after pulse-labeling. The Tc and
Ts
were estimated by a graphical approximation method that may involve inherent errors. However, the cell kinetic parameters estimated using the bivariate FCM analysis were in good agreement with reported data (8,9). The FLSmmethod has essentially the same ability to deduce Tc and Ts as the FLM and the RCSi methods and make it possible to analyze the cell population treated with a n anticancer drug in vivo (17). This technique would be applicable to clinical materials.
LITERATURE
CITED 1. 2 . 3. 4. 5. 6. 7. 8. 9. 10. 11. 12. 13. 14. 15. 16. 17.Collins JM: Rates of DNA synthesis during the S-phase of HeLa cells. J Biol Chem 253:8570-8577, 1978.
Culpin D, Morris VB: Pattern of DNA synthesis and its effect on ification of cells by flow cytometry. Cell Tissue Kinet
18:l-12,1985.
Dean PN, Didbeare F, Gratzner H, Rice GC, Gray J W : Cell-cycle analysis using a monoclonal antibody to BrdUrd. Cell Tissue Ki- net 17:427-436, 1984.
Dolbeare FA, Gratzner HG, Pallavicin MG, Gray JW: Flow cyto- metric measurement of total DNA content and incorporated bro- modeoxyuridine. Proc Natl Acad Sci USA 805573-5577,1983.
Dolbcare F, Beisker W, Pallavicini MG, Vanderlaan Gray Jw:
Cytochemistry for bromodeoxyuridineDNA analysis: Stoichiome- try and sensitivity. Cytometry 6:521-530, 1985.
Dormer P, Brinkmann W, 'Born R, Steel GG: Rate and time of
DNA synthesis o f individual Chinese hamster cells. Cell Tissue Kinet 8:399-412, 1975.
Drewinko B, Yang LY, Barlogie R , Trujillo JM: Cultured human tumor cells may be arrested in all stages uf the cycle during stationary phase: Demonstration of quiescent cells in G1, S and G2 phase. Cell Tissue Kinet 17:453-463, 1984.
Erlandson RA, de Harven E: The ultrastructure of synchronized HeLa cells. J Cell Sci 8:353-397, 1971.
Foa P, Maiolo AT, Lombardi L, Toivonien H, Rytomaa, Polli EE: Growth pattern o f the human promyelocytic leukemia cell line
HL60. Cell Tissue Kinet 15:399-404, 1982.
Fried J, Perez AG, Clarkson B: Quantitative analysis of cell cycle perogression o f synchronous cells by flow cytometry. Exp Cell Res
126:63-74, 1960.
Gratzner HG, Leif RC: An immunofluorescence method for rnoni- tnring DNA synthesis by flow cytometry. Cytometry 1:385-389, 1981.
Gray J W , Carver JH, George YS, Mendelsohn ML: Rapid cell cycle analysis by measurement of'the radioactivity per cell in a narrow window in S phase (RCSi). Cell Tissue Kinet 10:97-109, 1977.
Gray JW, Pallavicini MG, Gorge YS, Groppi V, Look M, Dean PN: Ratos of incorporation o f radioactive molecules during the cell cycle. J Cell Physiol 108:135-144, 1981.
Kim M: Mathematical methods for determining cell DNA s y n t h e ~ sis rates and age distribution utilizing flow microfluorometry. J Theor Biol68:27-42,1977.
Kleveez RR, Kapp LN: Intermittent DNA synthesis and periodic expression of enzyme activity in the cell cycle o f WI-38. J Cell Biol 58:564-573, 1973.
Hrf V, Bjerknes CA: Similar replicon properties of higher plant cells with different S periods and genome sizes. Exp Cell Res
136:461-465,1981.
Pallavicini MG, Summers LJ, Dolbeare FD, Gray JW: Cytokinetic properties of asynchronous and cytosine arabinoside perturbed murine tumors measured by simultaneous bromodeoxyuridine/