The Flynn effect puzzle: A 30-year examination from the right tail of the
ability distribution provides some missing pieces
Jonathan Wai
⁎
, Martha Putallaz
Duke University, Talent Identification Program, 1121 West Main Street, Durham, NC 27701, United States
a r t i c l e i n f o
a b s t r a c t
Article history:
Received 8 October 2010
Received in revised form 22 February 2011 Accepted 25 July 2011
Available online 26 August 2011
The Flynn effect is the rise in IQ scores across the last eighty or more years documented in the general distribution of both industrialized and developing nations primarily on tests that require problem solving and non-verbal reasoning. However, whether the effect extends to the right tail (i.e., the top 5% of ability) remains unknown. The present study uses roughly 1.7 million scores of 7th-grade students on the SAT and ACT as well as scores of 5th- and 6th-grade students on the EXPLORE from 1981 to 2010 to investigate whether the effect operates in the right tail. The effect was found in the top 5% at a rate similar to the general distribution, providing evidence for thefirst time that theentire curveis likely increasing at a constant rate. The effect was also found for females as well as males, appears to still be continuing, is primarily concentrated on the mathematics subtests of the SAT, ACT, and EXPLORE, and operates similarly for both 5th and 6th as well as 7th graders in the right tail. Thesefindings help clarify thenatureof the effect and may suggest ways that potentialcausescan now be more meaningfully offered and evaluated.
© 2011 Elsevier Inc. All rights reserved. Keywords: Flynn effect Environmental factors Sex differences Historical examination Gifted 1. Introduction
When data provide researchers with a scientific puzzle–a paradoxicalfinding that cannot easily be placed in the current network – this provides an opportunity for the field to advance in an attempt to resolve the contradictions, apparent or real. For the field of psychology and specifically intelli-gence, one such conundrum has been named theFlynn effect afterFlynn (1984, 1987), a political scientist who convinced psychologists that it needed explanation. This phenomenon is the rise in scores on intelligence tests over the last eight or more decades at the rate of about 10 IQ points per 30 years (Rodgers, 1998). The effect is noteworthy partly because large differences in scores are demonstrated in just those situations wheresimilaritywould be expected (Deary, 2001). The rises occur primarily on those tests with content that
does not appear easily learned, such as the Raven's Progres-sive Matrices (Raven, 1941; Raven, 1981), which includes no words or numbers but requires the completion of abstract patterns. The Raven's primarily measures g or general intelligence (Jensen, 1998), hence the paradox: Why should the rise occur on precisely those measures where we would not expect it? There has been disagreement over whether the gains are genuine intelligence increases, due to artifact, or potentially both, as well as why they are occurring.Flynn (1999, p. 6)marveled at the almost magical monotonic rate of gain, saying“It is as if some unseen hand is propelling scores upward.”Perhaps before trying to understand why scores are rising, we should learn more about all the places this invisible hand is at work.
1.1. A brief history of research on the Flynn effect
SinceFlynn's (1984, 1987)initial synthetic papers, others have confirmed the effect operates in the general distribution in industrialized nations including the United States, Britain, and Denmark (e.g., Flynn, 1984, 1987, 2007; Lynn, 2009;
Intelligence 39 (2011) 443–455
⁎Corresponding author at: Duke University, Talent Identification Program, 1121 West Main Street, Durham, NC 27701, United States.
E-mail address:[email protected](J. Wai).
0160-2896/$–see front matter © 2011 Elsevier Inc. All rights reserved. doi:10.1016/j.intell.2011.07.006
Contents lists available atScienceDirect
Intelligence
Teasdale & Owen, 1987, 1989) as well as developing countries including Brazil, Kenya, and Sudan (e.g., Colom, Flores-Mendoza, & Abad, 2007; Daley, Whaley, Sigman, Espinosa, & Neumann, 2003; Khaleefa & Lynn, 2009). Many have thus concluded that the Flynn effect is well established (e.g., Deary, 2001; Jensen, 1998).
Deary (2001, p. 112)said that“If there was a prize to be offered in thefield of human intelligence research, it would be for the person who can explain”the effect. Researchers have not been shy in proposing causal explanations. The American Psychological Association published The Rising Curve (Neisser, 1998) wherein multiple scholars proposed causes. None of them were definitive and at best remain unproven hypotheses (Jensen, 1996, 1998). More recently, a special issue in theJournal of Psychoeducational Assessment (Kaufman & Weiss, 2010) was devoted to the topic. Aligned withJensen's (1996, 1998)view, in this special issueCeci and Kanaya (2010, p. 446)note that“It is clear that we still have a long way to go before we understand the exact nature and magnitude of the [Flynn Effect] for all types of individuals, across time, and across tests. Until we do, discussions regarding its cause(s) and interpretation may be futile.”We think it has been helpful to thefield for scholars to propose multiple explanations so that relevant data can be used to test or help inform these perspectives. Some of these explanations include an improvement in education (Blair, Gamson, Thorne, & Baker, 2005; Ceci, 1991; Flynn, 1984, 2007), increased test sophistication and more confident test taking attitudes (Brand, 1987), more cognitive stimulation arising from the greater complexity of more recent environments, for example, the broad exposure to television and video games (Schooler, 1998; Sundet, Barlaug, & Torjussen, 2004; Williams, 1998), the idea that environmental and social factors may serve as multipliers of cognitive abilities in a model of reciprocal causality—the individualorsocial multiplier(Dickens & Flynn, 2001; Flynn, 2007), improvements in nutrition (Lynn, 1990, 2009), and heterosis or hybrid vigor (Mingroni, 2004, 2007).Jensen (1998) stated that although the proponents of the various theories often treat the individual explanations as if they were mutually exclusive, they are not incompatible. Therefore, he suggested a multiplicity hypothesis—the idea that each of the proposed explanations “is involved to some (as yet undetermined) degree in producing the secular rise in scores”(p. 323). 1.1.1. What research has been missing
In contrast to those who have taken the Flynn effect as well established, there have been others who have expressed their concern over the quick acceptance of the effect. For example, Rodgers (1998), (Rodgers & Wänström, 2007) stressed that there are still areas in which the nature and legitimacy of the effect remains unclear, for example, within the right tail of the ability distribution. Some of these areas, in particular for the right tail, include whether the effect holds for females as well as males, the current time period, some subtests over others, more than one measure, and for different age groups.
First, the effect consistently appears in the general distribution, but to our knowledge no studies have been able to adequately test whether the Flynn effect operates throughout the right tail (i.e., the top 5%).Flynn (1996, p. 25) has suggested that“IQ gains extend to every IQ level,”but it is surprising this assertion has been generally assumed without
empirical verification. Prior studies have likely had ceiling effects on measures that prevented individual differences in the right tail from being adequately captured and likely have not explicitly sampled from a right tail population. We are now able to bring some evidence to help evaluate whether gains extend to every level using samples from the top 5% on measures that have enough headroom. Whether the effect operates in the right tail may provide clues as to which causal hypotheses appear most promising (and for what parts of the ability distribution). Also, as some have suggested (Micceri, 1989; Rodgers, 1998, p. 351),“we need to understand in much more detail the nature of the whole distribution of IQ scores to unravel the puzzles underlying the Flynn effect.”Second, research has primarily examined males and whether the effect operates similarly for females remains unknown for the right tail (Rodgers & Wänström, 2007), although it has been demonstrated for the general distribu-tion (Ang, Rodgers, & Wänström, 2010). If the effect operated only for males, this would suggest different causes than if the effect also operated for females. Third, some studies suggest the effect may have ended in Denmark, Norway, and Britain (Shayer, 2007; Sundet et al., 2004; Teasdale & Owen, 2008). Therefore, it is important to assess whether the effect continues, at least in the United States. Fourth, the effect primarily appears on measures that require problem solving and other non-verbal components of IQ. Thus, does the effect operate on similar non-verbal measures in the right tail? Fifth, if the effect appears on multiple tests measuring similar constructs in the right tail, this would provide validation that the effect in the right tail is not test specific. We use the Scholastic Assessment Test (SAT) and the American College Test (ACT) to examine whether the effect is test specific for 7th graders and the EXPLORE test to address this question for 5th and 6th graders, and we also use these tests to examine whether the effect operates in the right tail for different age groups.
Rodgers (1998, p. 338)has said that“research addressing the legitimacy and meaning of the effect should precede research testing for and evaluating causes of the effect.” Therefore, certain aspects of the nature of the effect–some of the boundary conditions – need to be clarified before the many explanations that researchers have proposed can be more fully considered.
2. Method
2.1. The present study
With a focus on the right tail of the ability distribution, the aims of the present study include: 1. determining whether the Flynn effect operates in the top 5%, and if so, whether it does to the same degree as in other parts of the distribution, 2. determining whether the effect operates similarly for males and females, 3. determining whether the effect continues, 4. determining whether the effect appears at the composite level or on particular subtests, 5. determining whether the effect appears on both the SAT and ACT as well as the EXPLORE, and 6. determining whether the effect operates similarly for different age groups (i.e., 5th and 6th versus 7th graders).
We provide a broad historical analysis of average SAT, ACT and EXPLORE scores across 30 years–one generation–using
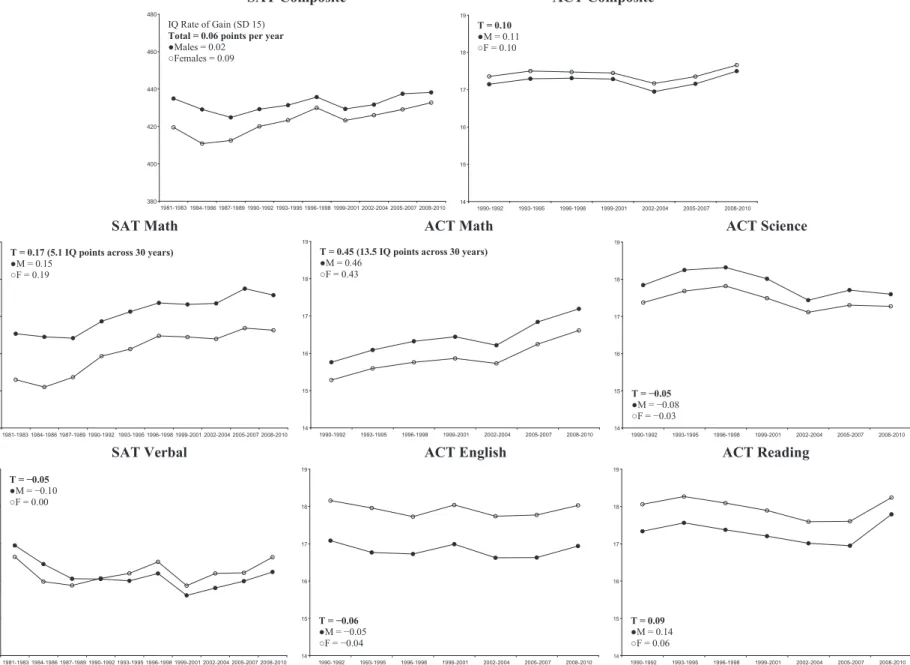
Fig. 1.Illustration of the Flynn effect on the SAT and ACT among 7th grade participants in the top 5% of ability as a function of sex across 30 years. 445 J. Wai, M. Putallaz / Intelligence 39 (2011) 443 – 455
data from the Duke University Talent Identification Program Talent Search (Duke TIP;Putallaz, Baldwin, & Selph, 2005). 2.2. Sample
2.2.1. SAT
We used 1,173,342 (Males= 587,829; Females = 585,513) test scores from 1981 to 2010 of students primarily from a 16-state region in the South and Midwest U.S. who took the SAT in the seventh grade. To qualify for the Duke TIP 7th-Grade Talent Search, all participants had previously scored in the top 5% of ability for their grade on a standardized test, either on a composite score or subtest. Males and females participated in roughly equal numbers across the years. We examined the SAT-Composite (average of math and verbal), as well as the SAT-Mathematics (SAT-M) and SAT-Verbal (SAT-V) subtests. In 1995, the SAT was recentered. We used the Educational Testing Service conversion tables to transform scores from 1981 to 1995 so that they would be comparable to post-1995 scores (ETS, 2010).
2.2.2. ACT
We used 440,380 (M = 224,406; F = 215,974) test scores from a similar but independent population as the SAT sample. Because the ACT was adopted later for the Talent Search than the SAT, data were only available from 1990 to 2010. We examined the ACT-Composite, as well as the ACT-Mathematics (M), Science (S), English (E), and ACT-Reading (ACT-R) subtests (ACT, 2005).
2.2.3. EXPLORE
We used 89,470 (M = 47,111; F = 42,359) test scores from a population of 5th and 6th grade students. Since the younger Talent Search was established later than the 7th-Grade Talent Search, data were only available from 1995 to 2010. Analyses were performed by grouping across multiple years to uncover the stable trend. To qualify for the Duke TIP 5th-and 6th-Grade Talent Search, all participants had previously scored in the top 5% of ability for their grade on a standardized test either on a composite score or subtest. Males and females participated in roughly equal numbers across the years. The EXPLORE, which is composed of four 30-minute multiple-choice tests, serves as an out-of-level test for 5th- and 6th-grade students because it is designed for 8th- and 9th-6th-grade students to assess their ability in mathematics (EXPLORE-M), science (EXPLORE-S), English (EXPLORE-E), and reading (EXPLORE-R). The EXPLORE-M emphasizes math reasoning ability rather than memorization or computation, with a primary focus on testing the ability to solve practical math problems. Items from the EXPLORE-M cover knowledge and skills, direct application, understanding concepts, and inte-grating conceptual understanding. The EXPLORE-S empha-sizes scientific reasoning ability rather than recall of scientific content, math ability, or reading comprehension. Items from the EXPLORE-S require the ability to“recognize and under-stand the basic features of, and concepts related to, the information provided; to examine critically the relationships between the information provided and the conclusions drawn or hypotheses developed; and to generalize from given information to gain new information, draw conclusions, or make predictions” (ACT, 2007, p. 6). The EXPLORE-E
emphasizes the ability to understand the conventions of standard written English and rhetorical skills. Items from the EXPLORE-E cover the areas of punctuation, grammar and usage, sentence structure, as well as strategy, organization and style. Finally, the EXPLORE-R emphasizes reading compre-hension ability. Items from the EXPLORE-R focus on “the complex of complementary and mutually supportive skills that readers must bring to bear in studying written materials across a range of subject areas”(ACT, 2007, p. 6) including the social sciences, prosefiction, and the humanities. Further description of and information on the EXPLORE subtests can be found in its technical manual (ACT, 2007).
3. Results
For the SAT, ACT, and EXPLORE, means for composites and subtests are shown inFig. 1(SAT and ACT) andFig. 2(EXPLORE) by sex. For the SAT and ACT, means are displayed in three year groups (e.g., 2008–2010) and for the EXPLORE in four year groups (e.g., 1995–1998) to uncover the stable trend. Also in Figs. 1 and 2are values for the individual year rate of gain in IQ units (SD= 15). These values were computed for males and females combined (Total) as well as separately (M, F) and provide a metric that is comparable not only across measures and subtests in this study, but alsofindings from the broader Flynn effect literature. We used a method similar to that used by Lubinski, Webb, Morelock, and Benbow (2001, p. 719) in converting SAT to IQ scores, then made rate of gain calculations.1 Appendixes A, B, and C provide means, standard deviations, and sample sizes for each of these samples.
3.1. Composite results
Fig. 1shows that within the top 5% of ability, on average, males outperformed females on the SAT whereas females outperformed males on the ACT, perhaps in part because the ACT is a more verbal measure (Koenig, Frey, & Detterman, 2008). The rates of gain in IQ points per year for the SAT (Total = 0.06, M = 0.02, F = 0.09) and ACT (T = 0.10, M = 0.11, F = 0.10) were both slightly positive with the gain for males being lower than the gain for females on the SAT. Appendixes A and B show both means and variances are increasing.Fig. 2shows that for the EXPLORE, there was not much male–female composite level difference. The composite rate of gain in IQ points per year for the EXPLORE (T = 0.23,
1
Similar toLubinski et al. (2001, p. 719), we based IQ calculations on the years 1981–1983 on the SAT-M only. We made the assumption that the SAT-M recentered mean of 417.88 (SD = 70.58) reflected approximately the top 1% or a z-score of 2.32. Then we converted the differences between the means at each of the two time points (e.g. 2008–2010 minus 1981–1983 for the SAT-M) to actual IQ point gains (SD = 15) in the following way. First, we took mean differences, divided them by 70.58, and added 2.32. Next, we multiplied these values by 16 and added 100 to convert them to IQ scores with SD= 16. Then, we took differences between these values and 137.12 (SD = 16) which according to
Lubinski et al. (2001)represents roughly the cut score for the top 1%. Next, we divided these values by 30 to get the individual year rate of gain. Finally, we multiplied these values by 15/16 to convert the IQ rate of gain to values with roughly SD= 15. The same procedure was used for each of the subtests on the ACT using calculations on the years 1990–1992 using the ACT-M mean of 15.51 and SD= 2.22 accounting for a span of 21 years. Finally, the same procedure was used for each of the subtests on the EXPLORE using calculations on the years 1995–1998 using the EXPLORE-M mean of 15.20 and SD = 3.45 accounting for a span of 16 years.
M = 0.22, F = 0.25) was higher than for the SAT and ACT. Appendix C shows that, in contrast to the SAT and ACT, the EXPLORE variances appear to be decreasing. The overall pattern indicates a slight rise on the SAT, ACT, and EXPLORE composites. However, are the composite gains a function of all subtests showing similar gains, or are some subtests increasing and others decreasing?
3.2. Mathematical subtest results
On the SAT-M, ACT-M, and EXPLORE-M males, on average, outperformed females (seeFigs. 1 and 2). In contrast to slight composite gains, the SAT-M (T= 0.17, M = 0.15, F = 0.19), ACT-M (T = 0.45, M = 0.46, F = 0.43), and EXPLORE-M (T = 0.37, M = 0.39, F = 0.37) gains are higher than their respective composites and do not differ much by sex. The total average yearly gain across the SAT-M, ACT-M, and EXPLORE-M (adding the total gains for each measure and dividing by 3) is 0.33 IQ points, exactly the average gain in other studies (0.33) on the Flynn effect which focused on the general curve (Rodgers, 1998, p. 338).2Appendixes A and B again show
increasing means and variances across time for the SAT-M and ACT-M. The total gain on the ACT-M and EXPLORE-M is higher than the SAT-M, but as Appendix C shows, the EXPLORE-M variances are decreasing rather than increasing. Thesefindings are consistent with the Flynn effect literature which predom-inantly shows gains on subtests that reflect problem solving and nonverbal components of IQ. Both the SAT-M and ACT-M are likely powerful measures of reasoning ability for students in the 7th grade (Benbow, 1988), and perhaps we now provide some evidence that the same can be said for the EXPLORE-M for students in the 5th and 6th grades.
3.3. Science and verbal subtest results
Fig. 1 shows that for the ACT-S, on average, males outperformed females, whereas for the ACT-E and ACT-R, females outperformed males. For the SAT-V, although males were higher than females in the early 1980s, they were surpassed by females in the early 1990s and the difference remains. In contrast to the mathematical ability results, the ACT-S, ACT-E, and SAT-V all indicated a slight decrease (−0.05 for the ACT-S and SAT-V and−0.06 for the ACT-E). For 7th-grade students the only verbal test that demonstrat-ed a slight gain was the ACT-R (0.09). Appendixes A and B show increasing variances for the SAT-V and ACT-R, but fairly stable or slightly decreasing variances for the S and ACT-E. Therefore, the small composite gains on the SAT and ACT were generally composed of large gains on the math subtests and slight losses on the science and verbal subtests.Fig. 2 shows that for the EXPLORE-S (T = 0.39, M = 0.37, F = 0.40), on average, males outperformed females, whereas for the EXPLORE-E (T = 0.14, M = 0.10, F = 0.19) and EXPLORE-R (T = 0.01, M =0.01, F = 0.02) females outperformed males.
In contrast to thefindings for the ACT-S, the EXPLORE-S showed gains (0.39) similar to that of the EXPLORE-M and ACT-M (0.37 and 0.45). In contrast, there were relatively small to no gains on the EXPLORE-E and EXPLORE-R (0.19 and 0.01). Appendix C shows decreasing variances for the EXPLORE-S and EXPLORE-R and slightly increasing variances for the EXPLORE-E. Therefore, the small composite gains on the EXPLORE were composed of large gains on the math and science subtests and relatively smaller or slight gains on the verbal subtests. Within each of the measures (e.g., SAT), we see a similar pattern among the various subtests, with the exception of large gains on the EXPLORE-S. Overall, that we observed primarily no change or slight gains on the tests that likely require more content knowledge is also aligned with the literature.
4. Discussion
4.1. The Flynn effect operates in the right tail of the ability distribution
Our results provide one of the key missing pieces to the Flynn effect puzzle—that the Flynn effect operates in the right tail.Flynn (1996)was correct in suggesting that IQ gains extend to every level. This result, along with thefinding that the rate of gain in the right tail on the math subtests is the same as in the middle and lower parts of the distribution, illustrates for thefirst time that it is likely theentire curve that is rising at a remarkably constant rate.Rodgers (1998) inquired as to whether the effect was due to mean changes or variance changes, or a combination of both. Appendixes A and B (i.e., SAT-M and ACT-M) show that the effect appears to be due to both mean and variance increases, at least within the right tail. However, Appendix C (i.e., EXPLORE-M) shows that the effect for this sample is associated with variance decreases, although among all three samples, this one is relatively smaller with an N≈90,000. Based on three in-dependent samples, the pattern is not entirely clear. How-ever, the pattern for the 7th-grade samples with much larger sample sizes (SAT: N≈1.2 million, ACT: N≈440,000) seems clearer. Maybe the overall gains observed in many prior studies can be potentially attributed to both decreasing variance in the lower part of the distribution as well as increasing variance in the upper part of the distribution. Now with these boundary conditions better informed, perhaps the many causal hypotheses that have been offered can be more incisively evaluated.
4.2. The Flynn effect operates similarly for males and females in the right tail
We also showed for thefirst time that the effect operates similarly for males and females in the right tail. This links with thefinding that the effect operates similarly for both sexes in the general distribution (Ang et al., 2010). This finding alsofits withJensen's (1998, p. 323)analogy that“the upward trend in scores is like a rising tide that lifts all ships without changing their relative heights.”The only exception to this trend was for the SAT-V, where males were higher than females from 1981 to 1989, but females were higher than males from 1993 to 2010. Although this is not the focus
2
Calculations based on weighting by N gave a slightly lower value (0.25) across these three mathematics measures due to the larger sample size for the SAT. Although this may suggest that the overall rate of gain is slightly lower in the right tail, we think it is also reasonable to think that with larger samples from the ACT-M and EXPLORE-M, the gains would have been similar. Therefore, we believe that adding up the total rate of gain values and dividing by three is a reasonable approach.
447
of our study, the pattern of sex differences found among these measures is consistent with prior research (Wai, Cacchio, Putallaz, & Makel, 2010).3
4.3. The Flynn effect appears to be continuing in the right tail In contrast to the studies showing that the Flynn effect may be ending (Shayer, 2007; Sundet et al., 2004; Teasdale & Owen, 2008), the effect in the right tail in the United States appears to remain. We cannot predict whether the effect will continue or change course in the future, so future investigations will be needed.
4.4. The Flynn effect appears primarily on the mathematical subtests In agreement with other studies (e.g.,Ang et al., 2010; Flynn, 1984, 1987; Rodgers & Wänström, 2007), we also found gains concentrated on mathematical or non-verbal subtests and relatively absent on others (with the exception of the EXPLORE-S).Figs. 1 and 2show that these gains on the SAT-M, ACT-M, and EXPLORE-M translate into generational gains of 5.1, 13.5, and 11.1 IQ points, respectively. Why the ACT-M and EXPLORE-M gains are more than double the SAT-M gain provides an interesting puzzle. However, if we average these gains (about 10 IQ points across 30 years), we get exactly the same rate of gain for the prior literature that focused on the general curve (10 points). Rodgers and Wänström (2007, p. 194) also found the effect primarily isolated to the mathematical ability subtests and asked, “Which part of the [math] ability distributions caused”the effect? Based on ourfindings, we would suggest that the right tail likely caused at least part of the effect in their sample and it is likely that the cause could be attributed evenly to those from low to high ability (Ang et al., 2010).
Flynn (2007, 2010)demonstrated that for the Wechsler Intelligence Scale for Children (WISC) there have been gains on the arithmetic subtest (relevant to math) as well as gains on the math subtests of the Nation's Report Card (NRC). These gains align with our findings on the SAT-M, ACT-M and EXPLORE-M. Flynn'sfindings on the WISC information and
vocabulary subtests (relevant to reading) also align with our findings on the SAT-V, ACT-R and EXPLORE-R which each assess reading, at least in part. However, thesefindings do not align with the reading subtests of the NRC, which demonstrated gains. Perhaps this might be due to the more challenging nature of the SAT-V, ACT-R, and EXPLORE-R in relation to the NRC reading subtests for the respective populations.
That the gain appears on the ACT-M but not the ACT-S suggests that these two subtests may be measuring different constructs to some degree, which may provide a clue for future sex differences research (Wai, Cacchio, et al., 2010). However, the fact that the EXPLORE-S does not show differentiation from the EXPLORE-M in regards to the Flynn effect provides yet another puzzle. Both the ACT and EXPLORE are designed by the same company so each test appears to be similar, just differing in degree of difficulty (ACT, 2005, 2007), so perhaps part of the discrepancy has to do with age differences of the samples and the complexity of the scientific content. Maybe we see the EXPLORE-S gains be-cause this test functions more like a reasoning test for this population due to the reduced exposure of the students to the scientific content. Future research investigating what the ACT-S and EXPLORE-S subtests measure in these populations is important.
4.5. The Flynn effect is not limited to one measure in the right tail
The Flynn effect appeared on the SAT-M, ACT-M, and EXPLORE-M demonstrating it is not measure specific. The present study serves as a series of constructive replications (Lykken, 1968) of the effect in the right tail. However, each of these subtests is not identical as the rate of gain differences on the tests illustrate (although the two tests made by the ACT appear similar). Why this is so may require future re-search on these measures. Perhaps greater exposure to math content earlier has led to larger increases on the ACT-M and EXPLORE-M in comparison to the SAT-M (Wai, Lubinski, Benbow, & Steiger, 2010). It may also be, asFlynn (1998, p. 26)has said, tests like the Raven's, and now potentially the SAT-M, ACT-M, EXPLORE-M and perhaps even the EXPLORE-S for these right tail populations, measure“the mind's ability to solve problems at the moment.”
4.6. Are these genuine intelligence gains?
Are the gains uncovered here genuine intelligence gains, are they due to artifact, or some of both?Jensen (1998)has argued that the increase in IQ scores over time is likely on the measure's specific knowledge content rather than thegfactor (e.g., Nettelbeck & Wilson, 2004; Rushton, 1999). He also provided a distinction betweenshadowaspects andtrueaspects of the IQ gains, using the analogy of trying to indirectly approximate the height of an individual by using their shadow rather than measuring their height directly. Jensen (1996, p. 150)notes that“it is still quite unknown just how much of the secular increase in scores ong-loaded tests is due to the ‘shadow’aspect of mental measurement and how much is due to real changes in the biological substrate of mental develop-ment.”He suggested that one way to determine whether the gains are real or trueis to examine the degree of gains on
3Using EXPLORE data from 1995 to 2010, we conducted an analysis of male–
female ratios among perfect scorers on the math and science subtests (a score of 25) which we believe provides the closest approximation to an ability level of 0.01% in the SAT and ACT data (Wai, Cacchio, et al., 2010). If anything, the EXPLORE may have a lower ceiling than the SAT and ACT for its respective population so the ratios may be larger than what we uncovered. In order to put thesefindings in perspective, we examined the male–female ratios in three groups (1995–2000, 2001–2005, and 2006–2010) which can be found in Fig. 1 of
Wai, Cacchio, et al. (2010). The graph found in Appendix D is an adaptation from
Wai, Cacchio, et al. (2010)which includes data from 1996 to 2010 on the EXPLORE-M and EXPLORE-S.Swiatek, Lupkowski-Shoplik, and O'Donoghue (2000)also examined perfect scores on the EXPLORE-M and EXPLORE-S for participants from 1997 to 1999 and found a male–female math ratio of 2.27 to 1 and a science ratio of 1.74 to 1. We replicate thesefindings using an independent sample from 1995 to 2000 (3.03 to 1 for the math subtest and 1.85 to 1 for the science subtest). We also extend thesefindings to demonstrate that the male–
female math and science ratios for 5th- and 6th-grade students, in addition to 7th-grade students, have been fairly stable for the last 16 or more years. In agreement with prior research, the ratios in the 5th and 6th grade are lower than in the 7th grade (e.g.,Swiatek et al., 2000). Thesefindings provide more evidence in addition to Wai, Cacchio, et al. (2010) that male–female math and science reasoning differences are still likely part of the equation explaining the underrepresentation of women in high level science, technology, engineering, and mathematics (STEM) careers.
various composites and subtests. For example, for tests that are mostgloaded such as the SAT, ACT, and EXPLORE composites, the gains should be lower than on individual subtests such as the SAT-M, ACT-M, and EXPLORE-M. This is precisely the pattern we have found within each set of measures and this suggests that the gain is likely not due as much to genuine increases in g, but perhaps is more likely on the specific knowledge content of the measures. Additionally, following Wicherts et al. (2004), we used multigroup confirmatory factor analysis (MGCFA) to further investigate whether the gains on the ACT and EXPLORE (the two measures with enough subtests for this analysis) were due togor to other factors.4Using time
period as the grouping variable, we uncovered that both tests were not factorially invariant with respect to cohort which
aligns with the findings of Wicherts et al. (2004) among multiple tests from the general ability distribution. Therefore, it is unclear whether the gains on these tests are due togor to other factors, although increases could indeed be due tog, the trueaspect, at least in part.
Alternatively, since we have seen a rise in scores, does this mean that more individuals are being identified as gifted and is this associated with a genuine rise in intelligence?Howard (1999, 2001) proposed that population intelligence really could be rising as documented by increased real world achievements and also notes it is unclear whether the prevalence of gifted students has risen over time. Flynn (2007)said he thinks there are more gifted individuals today and this is in accord with more recent reports of students identified as gifted before kindergarten (Otterman, 2010). What about in our samples, specifically on the SAT-M and ACT-M where the gains are most pronounced, we have the largest samples, and where we would expect larger numbers to be identified? To investigate this, we performed an analysis using data from Wai, Cacchio, et al. (2010, Appendixes A and B). We examined the number of participants scoring ≥500 (the top 0.5%) on the SAT-M and at a similar level on the ACT-M. We then compared the percentages scoring at this level at the oldest and most recent time points. For the SAT-M, this was 1981–1985 and 2006–2010; for the ACT-M, this was 1990–1995 and 2006–2010. For the SAT-M from 1981 to 1985, 7.7% of the sample scored at or above 500 and for 2006– 2010, 22.7% did so. For the ACT-M from 1990 to 1995, 17.7% scored at or above a similar level and for 2006–2010, 29.3% did so. Therefore, it appears there have indeed been more students being identified as gifted, at least on the subtests where the gains are primarily located. We use the term gifted here as part of a Talent Search definition rather than a school-based definition of giftedness. Whether this increase in the number of gifted children identified primarily on the mathematical subtests corresponds with an increase in associated high level real world achievements (Park, Lubinski, & Benbow, 2007, 2008; Wai, Lubinski, & Benbow, 2005) remains an area that requires future work.
4.7. Potential explanations
Ourfinding that the effect operates in the right tail and thus throughout the curve allows us to examine whether certain explanations may be operating, and maybe provide some clues as to where. That we found the effect operates among 5th- and 6th- as well as 7th- grade students indicates that causes in the right tail are in effect well before middle childhood or adolescence (Lynn, 2009).
Rowe and Rodgers (2002, p. 762)noted that“If the rising mean were driven by the smart getting smarter, then the change might reflect the introduction of some qualitatively novel form of environmental stimulation. If the overall dis-tribution increased in pace, the cause would lie in processes that affected everyone equally.”Wefind the rising mean of the entire distribution is partly driven by the smart getting smarter. This suggests some form of environmental stimula-tion may be at work in the right tail. We alsofind the overall distribution is likely increasing at a constant pace so perhaps a package of factors are affecting everyone equally.
4
According to Wicherts et al. (2004), MGCFA provides a better test of whethergis increasing over time. We used thefirst and last time periods as the grouping variable (i.e., ACT: time 1 = 1990–1992, N = 37,673 and time 2 = 2008–2010, N = 80,022; EXPLORE: time 1 = 1995–1998, N = 12,459 and time 2 = 2007–2010, N = 21,024) andfit a single factor model to the ACT and EXPLORE data. Using MPlus statistical software (Muthén & Muthén, 2010) with summary data, wefirst assessed configural invariance, or a test of whether the number of factors is the same and the same pattern of factor loadings characterize each group. Our goal with the MGCFA was to explore possible lack of measurement invariance and implications for Flynn effect interpretations, not to identify a perfectlyfitting model. Results for the ACT indicated that configural invariance held. Although theg-loading on the math subtest had increased over time, the magnitudes, rank-ordering, and pattern of standardized factor loadings were remarkably similar. Modelfit was assessed with the following indices: χ2 (4) = 6603, RMSEA = 0.167, CFI = 0.958, BIC = 2,418,404, SRMR = 0.035. The chi-square results here are inflated due to the very large sample sizes. For the EXPLORE, the configural modelfit was even better with the following indices:χ2 (4)= 4306, RMSEA = 0.135, CFI = 0.978, BIC= 2,312,237, SRMR = 0.022. Standardized loadings were nearly identical in both groups. Imposing a metric or factorial invariance model on the ACT data resulted in substantial decrease infit according to somefit indices, but still gave satisfactory results: χ2 (7) = 7619, RMSEA = 0.136, CFI = 0.952, BIC = 2,419,385, SRMR = 0.048. Relaxing the factor invariance model such that the math loading could increase resulted in substantialfit improvements. As for the EXPLORE, the metric invariance model stillfit quite well:χ2 (7) = 6367, RMSEA= 0.124, CFI = 0.967, BIC = 2,314,263, SRMR = 0.046. Allowing the English loading to increase over time markedly improvedfit. Moving to the scale invariance model was necessary to estimate potential Flynn effect gains ong, but did cost another decrease infit for the ACT data:χ2 (10)= 18,865, RMSEA= 0.179, CFI= 0.881, BIC = 2,430,596, SRMR = 0.096. Under this model theggain on the ACT was estimated at 0.078 of the time 1 SD. This result was highly sensitive to model assumptions. Models that allowed g loadings and intercepts for math to change resulted in Flynn effect estimates ranging from zero to 0.30 of the time 1 SD. Models where the math intercept was allowed to change resulted in no gains on
g. This indicates thatggain estimates are unreliable and depend heavily on assumptions about measurement invariance. However, all models tested consistently showed an ACTgvariance increase of 30 to 40%. Flynn effect gains appeared more robust on the EXPLORE, with all model variations showing ag
gain of at least 30% of the time 1 SD. The full scalar invariance model estimated a gain of 30% but showed poorfit. Freeing intercepts on reading and English as well as their residual covariance resulted in a model with very goodfit:χ2 (7) = 3024, RMSEA = 0.086, CFI = 0.985, BIC = 2,310,919, SRMR= 0.037. Estimates forggains were quite large under this partial invariance model (50% of the time 1 SD). Contrary to the results from the ACT, all the EXPLORE models found a decrease ingvariance of about 30%. This demonstrates that both the ACT and EXPLORE are not factorially invariant with respect to cohort which aligns with thefindings of Wicherts et al. (2004) investigating multiple samples from the general ability distribution. Following Wicherts et al. (2004, p. 529),“This implies that the gains in intelligence test scores are not simply manifestations of increases in the constructs that the tests purport to measure (i.e., the common factors).”In other words, gains may still be due togin part but due to the lack of full measurement invariance, exact estimates of changes in the g distribution depend heavily on complex partial measurement invariance assumptions that are difficult to test. Overall the EXPLORE showed stronger evidence of potentialg
gains than did the ACT.
449
Blair et al. (2005)emphasized that more recent cohorts from the general population have had more math education. Wai, Lubinski, et al. (2010)have shown this has been true for intellectually talented youth from the early 1970s to the early 1980s and potentially into the present. This might explain why scores are rising specifically on the SAT-M, ACT-M, and EXPLORE-M. However, the rising opportunities available to gifted students are not just limited to math, although math may be the greatest focus, so it is unclear whether this ex-planation holds merit. Why are scores not also increasing in tandem in verbal areas? Perhaps the slight gains on the ACT-R and EXPLORE-R are due in part to earlier exposure to reading? Is the larger gain on the EXPLORE-E due to earlier exposure among 5th- and 6th-grade students to English content? And has there been more early science education for the 5th- and
6th-grade students? This might explain, at least in part, why there were large gains on the EXPLORE-S. Yet, it would not explain why there was no gain on the ACT-S. So perhaps, as we mentioned earlier, the EXPLORE-S may function more as a reasoning test than the ACT-S for the respective populations. Maybe for all these measures on which we see gains, it would seemBrand's (1987)explanation of increased test sophisti-cation might play a role. For example, the United States has likely become a more test focused society given No Child Left Behind and competitiveness for college admission.
Researchers uncovering gains concentrated in the lower tail (Colom, Lluis-Font, & Andres-Pueyo, 2005; Teasdale & Owen, 1989) have concluded that increased nutrition (Lynn, 1990, 2009) and education appear to be likely candidates for explaining the Flynn effect in this region. With ourfinding
that the effect operates in the right tail to a similar degree, this does not rule out these conclusions for the lower tail. However, this suggests that there may be factors other than nutrition operating in the right tail, perhaps greater early schooling and education (Blair et al., 2005; Ceci, 1991; Flynn, 1984, 2007; Jensen, 1998) as well as cognitive stimulation (Flynn, 1984, 1987, 2007; Schooler, 1998; Sundet et al., 2004; Williams, 1998).Flynn (1998, p. 49)has said that“The very fact that children are better and better at IQ test problems logically entails that they have learned at least that kind of problem-solving skill better, and it must have been learned somewhere.” Some modern television shows and video games have become sophisticated puzzles themselves and this may be one mechanism through which such skills are learned (Schooler, 1998; Sundet et al., 2004; Williams, 1998). Now that we show gains are occurring along the entire curve, this supports the idea that cognitive stimulation may have at least some explanatory role to play (Colom et al., 2005), in particular for the right tail (Rowe & Rodgers, 2002).Flynn (2007)has hypothesized that perhaps individuals have had increased access to their own portable mental gymnasiums where they can exercise their minds. Especially for individuals in the right tail, this hypothesis appears to provide an intriguing possibility. However, what this analogy also suggests is that if smart people are exercising in their mental gyms, they are doing so primarily on the machine that develops problem solving or non-verbal ability.
Thus, theindividualorsocial multipliermay also be at work (Dickens & Flynn, 2001; Flynn, 2007) especially for this right tail population, many of whom have early environments that provide them with highdoses(Wai, Lubinski, et al., 2010) of intellectual stimulation, both academic and social. Heterosis (Mingroni, 2004) could also be a contributing factor, as well as other expla-nations not yet considered. However, none of the individual explanations considered likely account for the gains in entirety, whether shadow or true aspects, when examined in isolation.
Flynn (1999) provided the image of an unseen hand propelling scores upward at a constant rate across the decades. Rodgers (1998) has pointed out that the driving forces of the Flynn effect may be different in the lower versus the upper tail. Thus, although the rate of gain appears to be constant throughout the curve, there may be different explanatory forces at work in different locations along the curve. For example, the gains in the lower and upper regions of the distribution may both be caused, at least in part, by the factors of nutrition and education plus cognitive stimulation which when combined provide an equivalentFlynn effect dose (hence relatively constant rate of gain). However, this dose for the lower region may include a higher weight for nutrition and a lower weight for education plus cognitive stimulation whereas for the upper region the opposite weights may be in effect. Building uponJensen's (1998)multiplicity hypothesis, there may be multiple factors operating with different weights for different parts of the distribution, but that give a similar overall dose. Perhaps the four major trends that Jensen believes are likely to play a role should be considered factors in this equation, namely,“(1) a greater use of standardized tests and a resultant increased familiarity with test taking, (2) improvements in education and more years of schooling for more people, (3), improved nutrition and health care, and (4) advances in obstetrical practices and in inoculations of most children against the formerly common childhood diseases”(Miele, 2002,
p. 140). We think our hypothesis of a similarFlynn effect dosewith different allocation of weights in different parts of the ability distribution may hold merit and warrants future research, but we cannot rule out that alternatively, it may simply be that the same set of factors are operating on everyone along the curve equally as Rowe and Rodgers (2002)have suggested. In our view, what these factors are and their respective weights in the equation of explanation remain unknown. Although we cannot come tofirm conclusions, we hope that our research will better inform the discussion and perhaps stimulate some fresh thinking on this topic (Deary, 2001).
4.8. Limitations and future directions
The optimal methods needed to detect the Flynn effect in high ability samples include 1. tests measuring comparable constructs over time with enough headroom to measure individual differences in ability adequately, and 2. samples that have minimal to no selection bias across cohorts. First, the SAT, ACT, and EXPLORE likely measure comparable constructs across time (e.g., Kobrin & Melican, 2007) and there was sufficient headroom on these measures to detect an effect. Second, our samples are likely minimally affected by selection bias and are arguably the best presently available to test whether the effect operates in the right tail of the distribution. One might argue that since the 1980s, there has been a steady increase in pressure regarding entrance to the most prestigious United States colleges and perhaps this might mean a gradual yet steady increase in the proportion of smart American children who participate in the Duke TIP Talent Search, which would then simulate a Flynn effect. It certainly is possible that this trend might play a role to some extent, but we do not think this is likely. For example, if smarter children were to gradually self-select more into testing in the Talent Search, why would the gains be primarily on the mathematical ability tests, but not the other subtests as well? There is no reason for us to believe that across each year smarter students who would not have tested before would be pressured to test with greater frequency. In fact, qualification to be a part of the Talent Search has likely become less stringent over time due to the increasing number of tests a student can qualify on at the 95th percentile. If anything, then, the overall population testing is likely to have become slightly less select over the years, possibly simulating an anti-Flynn effect. This would suggest that the rate of gain in the right tail might be larger than what we have found. Additionally, it seems unlikely that we wouldfind nearly the same rate of gain on the SAT-M, ACT-M and EXPLORE-M in comparison to the general Flynn effect literature if factors other than a genuine effect are primarily at work. However, it is important to note that the instruments used in this in-vestigation were designed to be achievement tests. Although there is a strong correlation between achievement tests and traditional IQ tests, these different types of tests were designed for very different purposes which could be a potential confound. Ultimately, our samples are not perfect and we cannot rule out all potential methodological artifacts (Rodgers, 1998), but they are substantial in size (especially for a pop-ulation in the top 5%) and at least this likely offsets selection bias due tofluctuations across time.
Some authors have pointed out that examinations of the Flynn effect need to move beyond means, for example, by 451
investigating item properties (Beaujean & Osterlind, 2008; Wicherts et al., 2004) in order to determine whether the effect is due to a genuine increase in intelligence, psychometric artifact (items changing properties over time), or a combination of both. We, unfortunately, did not have item level data, but future research in this direction would be profitable. As mentioned earlier, we did investigate this issue using MGCFA on the ACT and EXPLORE and found that it was not clear as to whether the gains were due togor other aspects.
Rodgers (1998; Rodgers & Wänström, 2007)have empha-sized that there has been little work done to define the various domains (e.g., demographic, geographic, environmental, and biological) and the boundaries for each of the domains in which the Flynn effect occurs. We have provided some of the missing pieces that hopefully help clarify some of the boundary conditions for the effect in the right tail of the ability distribution; however, future research using this right tail population investigating other boundary conditions is still needed. For example, investigating the effect as a function of race/ethnicity similar toAng et al. (2010)may be informative (Ceci & Kanaya, 2010).
5. Conclusions
Over a decade later, we are in a similar state of mind as Rodgers (1998, p. 339)who said, “Having read all of the literature I canfind pertaining to the Flynn effect, I am still not
sure what [it] really is.”The puzzle remains, but maybe now that we have added a number of critical pieces, the overall pattern may begin to emerge and potential explanations can now be more meaningfully offered and investigated. Ourfindings lead us to suggest that the environment may have a role to play in the rise of scores among those in the right tail, in particular early education and cognitive stimulation. Perhaps future studies carefully examining the reasons behind these gains among the smartest individuals may help us improve not only education, but maybe even intelligence (Detterman, 1996; Kyllonen, Roberts, & Stan-kov, 2008). Research on the effect may one day help us better understand the causes of individual differences in intelligence and the measures used to assess it (Rodgers, 1998). Until then, probably the most reasonable conclusion was given byFlynn (1999, p. 9)himself who wisely said that “No one knows which role IQ gains over time will eventually play.”
Acknowledgments
We thank Terence Costello for his assistance with data management, are grateful to James Gambrell and Chongming Yang for their assistance with the MGCFA analysis and interpretation, and thank James Flynn and an anonymous reviewer for their helpful comments on earlier drafts of this manuscript.
Appendix A. Means, standard deviations, and sample sizes for participants in the top 5% of ability on the SAT as a function of sex across 30 years
Males Females Total
Mean SD N Mean SD N Mean SD N
SAT Composite 1981-1983 434.91 63.32 19150 419.47 59.04 20588 426.91 61.63 39738 1984-1986 429.06 65.63 35421 410.83 60.60 37846 419.64 63.74 73267 1987-1989 424.79 65.21 44634 412.48 59.63 47611 418.43 62.69 92245 1990-1992 429.25 67.82 50263 420.05 62.20 52870 424.53 65.16 103133 1993-1995 431.36 68.69 59056 423.29 62.97 57778 427.37 66.05 116834 1996-1998 435.68 68.97 73218 429.93 64.75 70436 432.86 66.99 143654 1999-2001 429.37 69.71 90592 423.23 65.52 86585 426.37 67.77 177177 2002-2004 431.64 71.22 85840 426.00 66.30 82771 428.87 68.91 168611 2005-2007 437.47 71.32 69617 429.08 65.60 70029 433.26 68.64 139646 2008-2010 438.15 71.95 60038 432.69 66.02 58999 435.44 69.13 119037 SAT Math 1981-1983 430.70 73.86 19152 405.96 65.18 20591 417.88 70.58 39743 1984-1986 429.01 77.87 35422 401.99 68.80 37847 415.05 74.56 73269 1987-1989 428.32 76.68 44634 407.31 66.87 47611 417.47 72.54 92245 1990-1992 437.38 81.10 50263 418.63 71.75 52871 427.77 77.02 103134 1993-1995 442.59 80.05 59056 422.46 72.03 57778 432.63 76.85 116834 1996-1998 447.29 78.29 73218 429.53 71.86 70436 438.58 75.73 143654 1999-2001 446.44 78.61 90592 428.92 72.54 86585 437.88 76.21 177177 2002-2004 447.01 81.56 85840 427.90 73.71 82771 437.63 78.39 168611 2005-2007 454.96 80.48 69617 433.73 72.53 70029 444.31 77.32 139646 2008-2010 451.43 80.80 60038 432.56 71.75 58999 442.08 77.03 119037 SAT Verbal 1981-1983 439.12 74.34 19154 432.99 73.15 20589 435.94 73.79 39743 1984-1986 429.11 75.57 35421 419.68 73.28 37848 424.24 74.54 73269 1987-1989 421.26 75.78 44634 417.64 72.92 47611 419.39 74.34 92245 1990-1992 421.12 77.34 50268 421.47 74.25 52875 421.30 75.77 103143 1993-1995 420.13 80.17 59057 424.13 75.06 57779 422.11 77.71 116836 1996-1998 424.07 81.22 73218 430.33 78.21 70436 427.14 79.82 143654 1999-2001 412.29 80.81 90593 417.55 78.01 86585 414.86 79.49 177178 2002-2004 416.27 80.88 85840 424.10 78.11 82771 420.12 79.63 168611 2005-2007 419.99 82.72 69617 424.43 78.60 70029 422.22 80.71 139646 2008-2010 424.88 84.25 60038 432.82 80.64 58999 428.81 82.58 119037 Note. Total N does not always equal Male N + Female N for each row because some participants did not report their sex.
Appendix B. Means, standard deviations, and sample sizes for participants in the top 5% of ability on the ACT as a function of sex across 21 years
Males Females Total
Mean SD N Mean SD N Mean SD N
ACT Composite 1990-1992 17.15 2.92 18229 17.36 2.72 19502 17.25 2.82 37732 1993-1995 17.29 2.95 24414 17.50 2.83 24831 17.40 2.89 49245 1996-1998 17.31 3.03 30154 17.47 2.89 29700 17.39 2.96 59859 1999-2001 17.28 3.09 34927 17.45 2.92 33154 17.36 3.01 68083 2002-2004 16.95 2.99 36159 17.17 2.87 34805 17.06 2.93 70964 2005-2007 17.16 3.12 38579 17.35 3.02 35904 17.25 3.07 74483 2008-2010 17.50 3.38 41944 17.66 3.17 38078 17.58 3.28 80022 ACT Math 1990-1992 15.76 2.33 18223 15.28 2.08 19498 15.51 2.22 37722 1993-1995 16.09 2.28 24413 15.59 2.04 24831 15.84 2.18 49244 1996-1998 16.32 2.32 30154 15.76 2.05 29700 16.04 2.20 59859 1999-2001 16.44 2.33 34927 15.86 2.02 33154 16.16 2.20 68083 2002-2004 16.22 2.37 36159 15.73 2.03 34805 15.98 2.22 70964 2005-2007 16.84 2.57 38579 16.25 2.20 35904 16.55 2.42 74483 2008-2010 17.19 2.75 41944 16.61 2.31 38078 16.92 2.57 80022 ACT Science 1990-1992 17.84 3.44 18202 17.37 3.08 19470 17.60 3.27 37673 1993-1995 18.25 3.53 24411 17.68 3.16 24829 17.96 3.36 49240 1996-1998 18.32 3.67 30154 17.82 3.26 29700 18.07 3.48 59859 1999-2001 18.01 3.65 34926 17.49 3.25 33154 17.76 3.47 68082 2002-2004 17.44 3.58 36159 17.11 3.30 34805 17.28 3.45 70964 2005-2007 17.71 3.79 38579 17.30 3.53 35904 17.51 3.67 74483 2008-2010 17.60 4.02 41944 17.27 3.65 38078 17.44 3.85 80022 ACT English 1990-1992 17.08 3.88 18226 18.16 3.91 19500 17.64 3.93 37727 1993-1995 16.77 3.95 24413 17.96 4.02 24831 17.37 4.03 49244 1996-1998 16.73 4.05 30154 17.73 4.14 29700 17.22 4.13 59859 1999-2001 16.99 4.26 34927 18.04 4.22 33154 17.50 4.27 68083 2002-2004 16.62 4.29 36159 17.74 4.34 34805 17.17 4.35 70964 2005-2007 16.63 4.36 38579 17.77 4.40 35904 17.18 4.42 74483 2008-2010 16.94 4.62 41944 18.03 4.63 38078 17.46 4.66 80022 ACT Reading 1990-1992 17.34 4.77 18202 18.06 4.60 19470 17.71 4.70 37673 1993-1995 17.56 4.73 24411 18.27 4.69 24829 17.92 4.72 49240 1996-1998 17.37 4.77 30153 18.09 4.74 29700 17.73 4.77 59858 1999-2001 17.20 4.69 34927 17.89 4.69 33154 17.54 4.70 68083 2002-2004 17.01 4.54 36159 17.59 4.56 34805 17.30 4.56 70964 2005-2007 16.95 4.54 38579 17.60 4.57 35904 17.26 4.57 74483 2008-2010 17.79 4.86 41944 18.24 4.78 38078 18.00 4.82 80022 Note. Total N does not always equal Male N + Female N for each row because some participants did not report their sex.
Appendix C. Means, standard deviations, and sample sizes for participants in the top 5% of ability on the EXPLORE as a function of sex across 16 years
Males Females Total
Mean SD N Mean SD N Mean SD N
EXPLORE Composite 1995-1998 16.71 3.30 6706 16.54 3.05 5606 16.64 3.19 12459 1999-2002 16.60 3.18 15779 16.62 3.03 14274 16.61 3.11 30231 2003-2006 16.78 2.65 13503 16.67 2.54 12578 16.73 2.59 26087 2007-2010 17.52 2.80 11123 17.45 2.72 9901 17.49 2.76 21024 EXPLORE Math 1995-1998 15.57 3.63 6706 14.74 3.15 5606 15.20 3.45 12459 1999-2002 15.81 3.38 15779 15.20 3.18 14274 15.52 3.30 30231 2003-2006 16.08 2.88 13503 15.41 2.69 12578 15.76 2.81 26087 2007-2010 17.00 3.13 11123 16.12 2.92 9901 16.58 3.06 21024 EXPLORE Science 1995-1998 17.28 3.97 6706 16.69 3.73 5606 17.01 3.87 12459 1999-2002 17.28 3.70 15779 16.93 3.51 14274 17.12 3.62 30231 2003-2006 17.99 2.66 13503 17.64 2.46 12578 17.82 2.57 26087 2007-2010 18.65 2.91 11123 18.18 2.73 9901 18.43 2.84 21024 EXPLORE English 1995-1998 16.83 3.59 6706 17.26 3.43 5606 17.03 3.53 12459 1999-2002 16.56 3.61 15779 17.26 3.59 14274 16.89 3.62 30231 2003-2006 16.75 3.71 13503 17.23 3.71 12578 16.98 3.72 26087 2007-2010 17.19 3.76 11123 17.95 3.80 9901 17.55 3.80 21024 EXPLORE Reading 1995-1998 16.72 4.61 6706 16.97 4.35 5606 16.84 4.49 12459 1999-2002 16.25 4.44 15779 16.58 4.24 14274 16.41 4.35 30231 2003-2006 15.80 3.39 13503 15.90 3.29 12578 15.85 3.35 26087 2007-2010 16.76 3.59 11123 17.05 3.56 9901 16.89 3.58 21024 Note. Total N does not always equal Male N + Female N for each row because some participants did not report their sex.
453
References
American College Testing (2005). Your guide to the ACT. Downloaded on October 25, 2009 from.http://www.act.org/aap/pdf/YourGuidetoACT.pdf
American College Testing (2007). EXPLORE technical manual. Downloaded on July 20, 2010 from.http://www.act.org/explore/pdf/TechManual. pdf
Ang, S., Rodgers, J. L., & Wänström, L. (2010). The Flynn effect within subgroups in the U.S.: Gender, race, income, education, and urbanization differences in the NLSY-Children data.Intelligence,38, 367–384. Beaujean, A. A., & Osterlind, S. J. (2008). Using item response theory to assess
the Flynn effect in the National Longitudinal Study of Youth 79 Children and Young Adults data.Intelligence,36, 455–463.
Benbow, C. P. (1988). Sex differences in mathematical reasoning ability among the intellectually talented: Their characteristics, consequences, and possible explanations. The Behavioral and Brain Sciences, 11, 169–183.
Blair, C., Gamson, D., Thorne, S., & Baker, D. (2005). Rising mean IQ: Cognitive demand of mathematics education for young children, population exposure to formal schooling, and the neurobiology of the prefrontal cortex.Intelligence,33, 93–106.
Brand, C. (1987). Bryter still and bryter?Nature,328, 110.
Ceci, S. J. (1991). How much does schooling influence intellectual development and its cognitive components? A reassessment of the evidence. Develop-mental Psychology,27, 703–722.
Ceci, S. J., & Kanaya, T. (2010). “Apples and oranges are both round”: Furthering the discussion on the Flynn Effect.Journal of Psychoeduca-tional Assessment,28, 441–447.
Colom, R., Flores-Mendoza, C. E., & Abad, F. J. (2007). Generational changes on the Draw-a-Man test: A comparison of Brazilian urban and rural children tested in 1930, 2002, and 2004.Journal of Biosocial Science,39, 79–89.
Colom, R., Lluis-Font, J. M., & Andres-Pueyo, A. (2005). The generational intelligence gains are caused by decreasing variance in the lower half of the distribution: Supporting evidence for the nutrition hypothesis.
Intelligence,33, 83–92.
Daley, T. C., Whaley, S. E., Sigman, M. D., Espinosa, M. P., & Neumann, C. (2003). IQ on the rise: The Flynn effect in rural Kenyan children.
Psychological Science,14, 215–219.
Deary, I. J. (2001).Intelligence: A very short introduction.New York: Oxford University Press.
Detterman, D. K. (1996).Current topics in human intelligence Volume 5: The environment.New Jersey: Ablex Publishing Corporation.
Dickens, W. T., & Flynn, J. R. (2001). Heritability estimates versus large environmental effects: The IQ paradox resolved.Psychological Review,108, 346–369.
Educational Testing Service (2010). SAT I individual score equivalents. Downloaded from. http://professionals.collegeboard.com/data-reports-research/sat/equivalence-tables/sat-score
Flynn, J. R. (1984). The mean IQ of Americans: Massive gains 1932 to 1978.
Psychological Bulletin,95, 29–51.
Flynn, J. R. (1987). Massive IQ gains in 14 nations: What IQ tests really measure.
Psychological Bulletin,101, 171–191.
Flynn, J. R. (1996). What environmental factors affect intelligence: The relevance of IQ gains over time. In D. K. Detterman (Ed.),Current topics in human intelligence. The environment,5. (pp. 17–29) New Jersey: Ablex Publishing Corporation.
Flynn, J. R. (1998). IQ gains over time: Towardfinding the causes. In U. Neisser (Ed.),The rising curve(pp. 25–66). Washington, DC: American Psychological Association.
Flynn, J. R. (1999). Searching for justice: The discovery of IQ gains over time.
American Psychologist,54, 5–20.
Flynn, J. R. (2007).What is intelligence? Beyond the Flynn effect.New York: Cambridge University Press.
Flynn, J. R. (2010). Problems with IQ gains: The huge vocabulary gap.Journal of Psychoeducational Assessment,28, 412–433.
Howard, R. W. (1999). Preliminary real-world evidence that average human intelligence really is rising.Intelligence,27, 235–250.
Howard, R. W. (2001). Searching for real world signs of rising population intelligence.Personality and Individual Differences,30, 1039–1058. Jensen, A. R. (1996). Secular trends in IQ: Additional hypotheses. In D. K.
Detterman (Ed.),Current topics in human intelligence. The environment,5. (pp. 147–150) New Jersey: Ablex Publishing Corporation.
Jensen, A. R. (1998).The g factor.Westport, CT: Praeger.
The Flynn effect [Special Issue]. Kaufman, A. S., & Weiss, L. G. (Eds.). (2010).
Journal of Psychoeducational Assessment,28, 379–505.
Khaleefa, O., & Lynn, R. (2009). The increase of intelligence in Sudan 1964–
2006.Personality and Individual differences,45, 412–413.
Kobrin, J. L., & Melican, G. J. (2007, January). Comparability of scores on the new and prior versions of the SAT reasoning test.College Board Research Notes(pp. 31).
Koenig, K. A., Frey, M. C., & Detterman, D. K. (2008). ACT and general cognitive ability.Intelligence,36, 153–160.
Kyllonen, P. C., Roberts, R. D., & Stankov, L. (2008).Extending intelligence: Enhancement and new constructs.New York: Lawrence Erlbaum Associates. Lubinski, D., Webb, R. M., Morelock, M. J., & Benbow, C. P. (2001). Top 1 in 10,000: A 10-year follow up of the profoundly gifted.Journal of Applied Psychology,86, 718–729.
Lykken, D. T. (1968). Statistical significance in psychological research.
Psychological Bulletin,70, 151–159.
Lynn, R. (1990). The role of nutrition in secular increases of intelligence.
Personality and Individual Differences,11, 273–285.
Lynn, R. (2009). Fluid intelligence but not vocabulary has increased in Britain, 1979–2008.Intelligence,37, 249–255.
Micceri, T. (1989). The unicorn, the normal curve, and other improbable creatures.Psychological Bulletin,105, 156–167.
Miele, F. (2002).Intelligence, race, and genetics: Conversations with Arthur R. Jensen.Boulder, CO: Westview Press.
Mingroni, M. A. (2004). The secular rise in IQ: Giving heterosis a closer look.
Intelligence,32, 65–83.
Mingroni, M. A. (2007). Resolving the IQ paradox: Heterosis as a cause of the Flynn effect and other trends.Psychological Review,114, 1104. Muthén, L. K., & Muthén, B. O. (2010).MPlus user's guide (6th ed.). Los
Angeles, CA: Muthén and Muthén.
Neisser, U. (1998).The rising curve.Washington, DC: American Psychological Association.
Appendix D. Male-female math and science ratios among the top 0.01% of ability for the SAT and ACT and among perfect scorers on the EXPLORE across 30 years
Nettelbeck, T., & Wilson, C. (2004). The Flynn effect: Smarter not faster.
Intelligence,32, 85–93.
Otterman, S. (2010, April).More pre-K pupils qualify for gifted programs.New York Times.
Park, G., Lubinski, D., & Benbow, C. P. (2007). Contrasting intellectual patterns for creativity in the arts and sciences: Tracking intellectually precocious youth over 25 years.Psychological Science,18, 948–952.
Park, G., Lubinski, D., & Benbow, C. P. (2008). Ability differences among people who have commensurate degrees matter for scientific creativity.
Psychological Science,19, 957–961.
Putallaz, M., Baldwin, J., & Selph, H. (2005). The Duke University talent identification program.Journal of High Ability Studies,16, 41–54. Raven, J. C. (1941). Standardization of progressive matrices. The British
Journal of Medical Psychology,19, 137–150.
Raven, J. (1981). Manual for Raven's Progressive Matrices and Mill Hill Vocabulary Scales (research supplement No. 1).London: H. K. Lewis. Rodgers, J. L. (1998). A critique of the Flynn effect: Massive IQ gains,
methodological artifacts, or both?Intelligence,26, 337–356.
Rodgers, J. L., & Wänström, L. (2007). Identification of a Flynn effect in the NLSY: Moving from the center to the boundaries.Intelligence,35, 187–196. Rowe, D. C., & Rodgers, J. L. (2002). Expanding variance and the case of the
historical changes in IQ means: A critique of Dickens and Flynn (2001).
Psychological Review,109, 759–763.
Rushton, J. P. (1999). Secular gains in IQ not related to thegfactor and inbreeding depression—unlike Black–White differences: A reply to Flynn.Personality and Individual Differences,26, 381–389.
Schooler, C. (1998). Environmental complexity and the Flynn effect. In U. Neisser (Ed.),The rising curve. Washington, DC: American Psychological Association. Shayer, M. (2007). 30 years on-a large anti-‘Flynn effect’? The Piagetian test volume and heaviness norms 1975–2003.British Journal of Educational Psychology,77, 25–42.
Sundet, J. M., Barlaug, D. G., & Torjussen, T. M. (2004). The end of the Flynn effect? A study of secular trends in mean intelligence test scores of Norwegian conscripts during half a century.Intelligence,32, 349–362. Swiatek, M. A., Lupkowski-Shoplik, A., & O'Donoghue, C. C. (2000). Gender
differences in above-level EXPLORE scores of gifted third through sixth graders.Journal of Educational Psychology,92, 718–723.
Teasdale, T. W., & Owen, D. R. (1987). National secular trends in intelligence: A twenty-year cross-sectional study.Nature,325, 119–121.
Teasdale, T. W., & Owen, D. R. (1989). Continuing secular increases in intelligence and a stable prevalence of high intelligence levels.Intelligence,
13, 255–262.
Teasdale, T. W., & Owen, D. R. (2008). Secular declines in cognitive test scores: A reversal of the Flynn effect.Intelligence,36, 121–126. Wai, J., Cacchio, M., Putallaz, M., & Makel, M. C. (2010). Sex differences in the right
tail of cognitive abilities: A 30 year examination.Intelligence,38, 412–423. Wai, J., Lubinski, D., & Benbow, C. P. (2005). Creativity and occupational
accomplishments among intellectually precocious youth: An age 13 to age 33 longitudinal study.Journal of Educational Psychology,97, 484–492. Wai, J., Lubinski, D., Benbow, C. P., & Steiger, J. H. (2010). Accomplishment in science, technology, engineering, and mathematics (STEM) and its relation to STEM educational dose: A 25-year longitudinal study.Journal of Educational Psychology,102, 860–871.
Wicherts, J. M., Dolan, C. V., Hessen, D. J., Oosterveld, P., van Baal, G. C. M., Boomsma, D. I., et al. (2004). Are intelligence tests measurement invariant over time? Investigating the nature of the Flynn effect.Intelligence,32, 509–537.
Williams, W. M. (1998). Are we raising smarter children today? School and home-related influences on IQ. In U. Neisser (Ed.),The rising curve. Washington, DC: American Psychological Association.
455