6
Deboad iKirwnu PAimna.
!~~~~~~~~~~~o
NW\l
kwvo Fboo
Intemational Economlcs Department
The Wcrld Bank O.Wober 1993
WPS 1202
Privatization
and Foreign Investment
in the Developing
World,
1
988-92
Frank
Sader
Developing countries can use privatization to attract foreign investment in two ways: by selling assets to foreign investors and by improving the general economic environment so that investment seems more likely to be profitable.
IhcPolicy ResarchWodking npmu dissaiinte the fndings of wotk in progrs and encourage theexchangofideu among Bank saff and a1 ahen interested in devlopmentisgses. heT e pap,. diatdbmed by the Reseach Advisoy Staff, cary the nameg of the authar,
rsilct alytheirview. and aholdhbeused and citedaordingly.ThefY. dinnp, iteproEttins, VndW cclumu ane the utho' owL They
should not be attibuted to the Wodd Ban, its Bord oi Dinctors. its managernae or any of its manber contries.
Public Disclosure Authorized
Public Disclosure Authorized
Public Disclosure Authorized
cr: V ~ ~ ~ ~ ~ ~ ~ ~~OC
VWPS 1202
Ths paper - a product of the Debt and Intemnational Finarce Division, International E-conomics
DepAzMcnt - is part of a larger effort In the department to evaluate foreign Investment as a source of financing for developing countries. Copies of the paper are available from tht; World Bank, 1 81I8 H Street
NW, Washingt, DC 20433. Please contact Roe Vo rom SB-042, exteon 31047 (October 1993,62
pages)
Foreigv? direct investment in the developing The relative size of the privatization program
world has grown rapidly in recet years, making and the degree of openness to foreigners are
it one of the most importat sources of financing important detenninants of foreign direct
invest-to developing countries. Sader presents a data- ment. Each dollar in privatization revenue
basw on about 1,1I00 global privatizatlor transac- generates an additional 35 cents in new foreign
dons from 1988 through 1992. direct investmnent inflows, and a 1 percent
increase in foreign participation adds another 50
Between 1988 and 1992, developing country cents.
governments eamned almost US$62 billon in
revenues from the sale of state-owned assets. In addition to the direct inflow of funds
About a third of those revenues came from through the sale of assets, many developing
foreign sources. Privatization in Latin America countries also increasingly attracted foreign represents about 66 percent of privatization in investment outside of their privatization pro-the developing world. Privatization in Europe, grams. Privatization of infrastructure and the
including Eastern Europe, accounts for 17 financial sector especially seem to have sent
percent, and privatization in East Asia, 13 important signals to foreign investors, indicating
percent. The beaviest foreign participation is in an imnproved economic envirounment and possibly
Eastern Eumpe,; primarily for lack of domestic the eventual elimination of bottlenecks.
Im-financing. proved expectations about the profitability of
investment projects render these countries more
Foreign investors' general participation in attractive to foreign investors.
privatization programs was strong, providing developing countries with substantial amnounts of
foreign exchange.
T'he Prlicy Reseach Working Pape Series disseninates the findings of work under way in the Bank. An objective of the seTies is to get thee findings out quickly, even if presentations are less than fully polished. The findings, interpretations, and
PRIVATIZATIONS AN.3
FOREIGN INVESTMENT IN THE
DEVELOPING WORLD: 1988-1992
by Frank Sader
World Bank
International Economics Department
Numerous individuals within the World Bank as well as outside provided support in the data collection. Without their help, this study would have been impossible. Special thanks in this respect go to Antonio Estache and Maziar Minovi. Also thanks for many helpful comments on earlier drafts from Stijn Claessens, Guy Pfeffermann, Gerd Schwartz, as well as the economists at IECDI,
TABLE OF CONTENTS
I. Introduction ... , ... 3
IH. Early Experiences with Privatizations ... ...5
II.1 The Formation of State-Owned Enterprises (SOEs) .5
11.2 The Early Phase of Privatizations... 7...7
III. The Recent Wave of Privatizations, 1988-1992 .10
11. I The Data ... ,,,, 10
III.2 Global Trends in Privatizations .11
111.2 Trer,ds in Developing Country Privatizations ... 12
IV. Privatizations as a Source of Foreign Exchange .17
IV.1 Data .... 17
IV.2 Overall Trends ... 17
IV.3 Portfolio Equity Investments .19
IV4 Foreign Direct Investment ... 21
V. Privatization Experiences at the Country Level .22
VI. Do Privatizations Attract Foreign Direct Investors . 24
VII. Conclusion ... 31
ANNEX: COUNTRY NOTES .33
A Latin America and the Caribbean ... , 33
B Europe and Central Asia .37
C East Asia and Pacific .39
D South Asia .40
E Sub-Saharan Africa .41
F North Africa and the Middle East ... 42
APPENDIX
Table A-1: Privatization Transactions in the Developing World: 1988-1992
Table A-2: Privatization Transactions in the Industrialized World: 1988-1992
Table A-3: Foreign Direct Investment from Privatizations: 1988-1992 Table A-4: Privatizations as Share of Foreign Direct Investment: 1988-1992 BIBLIOGRAPHY
SUMMARY
Foreign direct investment in the developing world experienced a rapid growth in recent years, rendering it one the most important financial flows to developing countries as a whole One of the driving forces behind this renewed interest by private investors in developing country economies is the privatization of 3tate-owned en:erprises, which
expanded rapidly over the last years in many developing countries. In order to gain a better understanding of the relationship between privatizations and foreign investment, a database was constructed for privatization transactions worldwide for the period 1988-92. The data were compiled based on information from a wide variety of public sources such as newspapers and journals, country and regional departments as well as residence missions of the World Bank, and privatization groups and ministries within the individual countries. The database ',omprises about 1,100 transactions and is available from the author upon request.
The study shows that during the period 1988-92, developing country governments earned almost IJS$62 billion in revenues from the sale of state-owned assets. About a third of these revenues came from foreign sources in the form of portfolio equity and foreign direct investment. Measured in sales volume, the largest privatizers are located in Latin America, which accounts for 66 percent of total privatizations in the developing world. European countries, including the Eastern European economies, account for 17 percent, followed by East Asia with another 13 percent. The degree of foreign participa n differs substantially among countries, but the Eastern European nations clearly show the most substantial invoivement of foreign investors compared to other large privatizers, primarily due to the fundamental lack of domestic investment finance. But besides being a direct source of foreign exchange, privatizations also serve as an important vehicle in attracting additional foreign investments, not directly obtained from h..e sale of state-owned assets to foreigners. An econometric analysis shows that the relative size of the privatization program as well as the degree of openness to foreigners are important determinants of foreign direct investment inflows. In fact, for the analyzed sample of countries, it turns out that each dollar in privatization revenue generates an additional 38 cents in new foreign direct investment inflows, and that a one percentage increase in foreign participation adds another 50 cents. The analysis also shows that privatizations in the financial sector and infrastructure have a strongly positive effect on foreign investors, while privatizations in manufacturing or services do not appear to attract foreigners to any significant extent beyond the initial sale of the state-owned enterprises themselves. Thus, developing countries can use privatizations as a vehicle to attract additional foreign investment in two ways: directly through the sale of assets to foreign investors as well as by improving the general economic environment such that it appears more profitable for foreigners to engage in ventures in these countries.
1.
Introduction
During most of the 1980s,
the inajority
of the developing
countries
were basically
shut out
from the international
capital markets,
following
the borrowing
binge of the 1970s and the
breakdown
of normal financial
relations
in 1982/83. This financial
constraint,
particularly
severe for the heavily indebted countries, quickly translated into declining investment
expenditures
and growth rates in these countries. In recent years, however, these same
countries witnessed a substantial
increase in inflows of equity capital in the form of
portfolio equity and foreign direct investment
(FDI), reflecting
a renewed trust in the
economic potential of many developing
countries. FDI alone rose by almost US$29
billion between 1987 and 1992, reaching
a projected
US$38 billion last year. Together
with portfolio
equity investments
of US$35 billion,
private investments
in the developing
world accounted
for almost 60 percent of total net resource flows in 1992.1
This remarkable turnaround in private flows is driven by a general climate of
macroeconomick
btabilization
and liberalization,
providing
a more attractive
environment
to
private investors. In most countries
affected
by the deb' crisis, stabilization
was achieved
through an extensive
program of sound macroeconomic
policies comnbined
with several
rounds of debt work-outs with official and, in particular,
private creditors. Economic
liberalization
is generally
pursued via the reduction of trade restrictions
as well as the
elimination
of distortions
within the domestic
economy
in order to improve internation?l
competitiveness.
For many countries,
a centerpiece
of this liberalization
effort is a stroll
move towards privatization
of formerly
state-owned
enterprises
(SOEs). After a relatively
slow start in the mid-1980s,
privatization
programs
expanded
remarkably
over the last five
years in many developing
countries
and fueled
a rapid growth .n foreign
direct investment,
supporting
the recovery
in gross domestio
investment
which fell substantially
during the
mid-J
980s.
The existence
of privatization
programs
is generally
acknowledged
as one of the central
reasons
for the renewed
access to international
capital
markets as well as rising
investment
levels in developing
countries. As of yet, however,
no detailed
study has been undertaken
to analyze the size and extent of privatizations
and its impact on capital inflows and
investment levels. This paper intends to fill this gap by providing information
on
privatization
transactions
world-wide
at a micro-level.
A database
was constructed,
listing
privatization transactions during the period 1988-1992 for all developing and
industrialized
countries
for which information
was available. Based on this information,
the foreign exchange
content of these tr nsactions
in the form of foreign direct investment
and portfolio equity investment
was estimated,
allowing some inferences
regarding the
financial
effects of the existing
privatization
programs.
The study shows that privatizations
grew at an unprece(
4ented rate in recent years and
contributed
substantially
to the boom in foreign financing
from private investors. While
privatization
programs started in many countries during the mid-1980s
already, they
became effective
and wide-ranging
not before the end of the decade. During the period
1988-92, the developing world wvitnessed the privatization of about 870 medium- and large-sized enterprises, generating a revenue of almost $62 billion. The strongest privatizers were located in Latin America and Eastern Europe, while sub-Saharan African countries did barely engage in any significant sell-offs of state assets. Foreign investors contributed substantially to this privatization boom through portfolio eq"ity as well as foreign direct investment, accounting for about 30 percent of total revenues. But besides the direct gain of foreign exch4nge through the sale of SOEs, privatizations also have the ability to attract additional investments indirectly. It appears that extensive privatizations in infrzstructure projects and financial institutions have a posiiive effect on foreign direct investment inflows by enhancing the profitability of the economic environment for private ventures.
The following section lays out experiences with privatizations in developing countries prior to 1988 based on previous studies undertaken. In Section III, the data on recent privatization transactions are presented and analyzed at an aggregate level . The direct inflows of foreign exchange in the form of foreign direct as well as portfolio equity investment resulting from privatizations are analyzed in Section IV. Section V describes
privatization exp.eriences at the country level and provides a comparison of the intensity of
privatizations among countries. A more detailed discussion of the privatization programs in individual countries that engaged strongly in privatizations is relegated to the Annex. Besides the direct gains from asset sales to foreigners, privatizations, in the areas of infrastructure and finance in particular, played an important role in attracting ?dditional FDI, as shown in an OLS regression analysis in Section VI. Section VII concludes the
study by summarizing the findings and discussing the prospects for privatizations in the
near future.
H.
Early Exoeriencts with Privatizations
IL1 The Formation of State-Owned
Enterprises (SOEs)
Starting in
'early 1960s, the developing
world witnessed a steady expansion of
economic
act{vity
carried out by the public sector. Governments
increasingly
intervened
directly
in the economic
process
to suppoit econormic
development.
Ideological
reasoning
aside, the primary
arguments
for this economic
strategy were based on efficiency
c,iteria.
Particular
sectors such as mining,
petroleum,
telecommunications,
finance,
transportation,
and heavy industry were viewed as central to the development
strategy by providing
crucial goods and services to all other industries. Governments
hoped to accelerate
eco*nomic
growth by eliminating bottlenecks in these crucial areas, enhancinig
the
profitability
and performance
of all other sectors. Most importantly,
these intended
efficiency
gains were expected to translate into increased
export earnings,
reducing the
often severe foreign exchange
constraint. The export of raw materials
in the mining or
hydrocarbons
sectors, in particular,
were thought to boost export performance
directly,
while the provision
of :ntermediate
goods and services was expected to improve the
comrpetitiveness
of domestic
industries
in the world markets.
The development
of these core sectors was, however,
generally
quite unsatisfactory
due to
structural
market
failures
which impeded
the progress
of the economy
as a whole. In most
cases, the private sector was viewed as structurally
weak, not having access to the
necessary skills and financial
means to provide these strategically
important "public
goods". In order to overcome
these inadequacies,
the public sector began to carry out a
steadily increasing
share of domestic capital formation, reaching on average over 45
percent in 1985 in the developing world.
2The main instrument for government
intervention
was the creation of SOEs in those sectors deemed most important. By the
early 1980s, SOEs are estimated
to have accounted
for an average 17 percent of GDP in
Su'. -Saharan
Africa and around 12 percent in Latin America. Asia, on the other hand,
revealed a relatively modest share of only 3 percent (excluding
China, India, and
Myanmar),
while Eastern Europe's SOEs were responsible
for up to 90 percent of total
domestic
production.
3All too often, however, the efficiency
cor.;jerations, initially
used as an explanation
for
the rapidly expanding
economic
activities
of the public sector, were quickly replaced by
short-term
political
goals, rendering
SOEs primarily
as large employers
and suppliers
of
highly subsidized
goods and services
to the public. Thus, in many cases, SOEs did not
contribute significantly
to the long-term
development
process, being directed at quelling
temporary
economic
dissatisfaction
rather than improvin,g
long-term
economic
efficiency.
Instead of generating economy-wide
multiplier
effects, fostering the development
of
private industry through the provision of essential services and raw materials, they
typically turned out to be grossly inefficient,
resulting in bottlenecks and generally
2 see Pfeffermann and Madarassay (1992), Table 4b, p.26.
inadequate and de. iorating infrastnictural conditions.4 The social benefits resulting from
the provision of subsidized goods and services to the public in the form of staple goods, energy, transportation and others became an increasing financial burden to the governments, when many of these SOEs incurred substantial financial losses, draining resources from the budget as well as the domestic financiai markets. In 1982, the Mexican government had to spend 4 percent of its GNP in transfers and subsidies to its SOEs. During 1989 to 1991, SOE losses are estimated to have reached 9 percent of GDP in
Argentina and, on avei - over 5 percent in Sub-Saharan African countries.5
SOEs also generally failed to enhance export growth and to provide the country with additional foreign exchange. )n ,ie contrary, with relatively easy access to foreign capital during the lending boom of the 1970s, SOEs absorbed a substantial amount of loans taken on in the international financial markets, rendering them a substantial contributor to the ballooning of sovereign debt during the 1970s. With cieditors e.fectively treating them as part of the goverment based or. public guarantees issued by the authorities, SOEs coL;d obtain loans independent of their economic pe.formance. Hence, during the period of 1970 to 1982, the real stock of debt of SOQ.s grew at an average annual rate of 10.8 percent, comnared to an average 7.4 percent growth of Non-SOE debt, reaching $164 billion at con-cant 1991 dollars, or 23.6 percent of the total stock of debt. Servicing the old debt proved to be a heavy burden for the governnents: SOE debt alone accour:ted for almost 30 percent of total debt service. Creditors managed to avoid extensive defaults by continuously rescheduling the outstanding debt. Within this process almost $100 billion liad to be rescheduled, accounting for 16.5 percent of total reschedulings for the developing world. With SOEs being unable to service their debt and requiring reschedulings, public guarantees became reality in the sense that the government effectively had to take over the rescheduled portion of the SOE debt, further increasing the stoclz of public debt and exacerbating the debt burden for the governments of
developing countries.6
Confronted with the generally disappointing performance of the SOEs and the dire financial straits, many developing countries found themselves in during the 1980s, privatization became an important economic policy tool n many developing countries. The transfer of ownership is generally hoped to improve the efficiency with wh,ich these strategically important goods and services are provided, forcing the firms to ifolow market signals by eliminating the existing soft budget constraints. Equally important, maiiy governments hope to reduce budgetary pressures resulting from subsidies and tra,isfer payments, while at the same time generating revenues as well as foreign exchange through the sale of these assets.
4 For an example in the case of Latin America see World Bank (1991). 5 Kikeri, Nellis, and Shirley (1992), P. 15.
6Based on the World Bank's Debt Reporting System (DRS).
11.2 The Early Phase of Privatizations
The beginnings of pri',atization programs, defined z a systematic strategy by the public
sector to withdraw from direct economnic activity, is usually associated with the United
Kingdom and Chile as the two most outstanding cases. In both countries, the initial
motivation was primarily ideological and politic&! in the sense that the government
intended to return to private ownership assets tlrit tve!' nreviously nationalized.
In the United Kingdom, an ext en3ive privatization program was initiated by the Conservative Party shortly aRer its ele 'zon in )979. The general goal. .ere to reduce
government involverr?nt in commercial activities, widen private share o-wnership, and
raise government revenue to help finance a notorious budget deficit. A large number of well-known companies were transferred to private ownership, among them British Petroleum, British Gas, British Telecom, British ;.'-Cays, Jaglar, Rolls Royce, and Cable & Wireless Over the last 13 year2 it is estintn-t1 that thii country has raised
approximately $65 billion through privatizations.7
Chile developed probably the most eteisW..e pniv,tra.tion program in the world.
According to one estimate, Chiie has transtf&-ed .wice tV.e value of state-owned assets
relative to GNP coinpared to the U.K^.8 The progilim was started in 1974 under the
rilitary regime of General Pinociiet as a eaaction to the socialist government under
Salvador Allende who during 1970-7/. nationq.al...,1 about 350 enterprises, giving the
government control over approximraely 600 enterprises accounting for almost 50 percent
of GDP.9 In the first two years, around 240 -,nterprises were returned to their previous
owners, and by 1983 another 1 10 er.rprises h,A been divested. Duiring this time, only around US$1 billion was raised in revei,ue, because, in most cases, the assets were simply
returned without anv official sjes transaction. Following the financial shock of the debt
crisis, whlich led to ar increased iiivolvement of the state by bailing out many large
financial and industrial cor-donwerates, a final phase of privatization began in 1985. Since
then, Chile has divested most of the remaining 40 large industrial enterprises under state control, predominantly via the sale of shares, gerierating a total revenue of approximately
$1.4 bil,ion.
For the overwhelming majority of developing countries, however, the recent trend in privatizations was not based on particular ideological reasoning, but rather initiated out of
economic necessity. Given the stringent financial constraints most countries faced during
the 1980s, ways had to be found to relieve the already strained budget from any additional pressures. Clearly, one of the first items on the list were transfers and subsidies to SOEs, a move strongly supported bv tl e multilateral organizations. In most structural adjustment programs by the IMF as well as the adjustment loans made by the World Bank, a reduction of SCE sUppoit paymenrts, combined with pricing at operating costs and a general deregulation were envisaged.10 These adjustment programs were oflen heavily 7 Euromoney, 1992, p.3.
8 The Financial Times, April 1 1, 1990.
9 Nankani (1988), p.18.
Contested in the political arena of the developing country concerned. A reduction of
public expenditure combined with the elimnination of subsidies on basic goods and services
affected predominant6y th, lower income groups who are disproportionately dependent on
the provision of subsidized public services. Large price incre.asts on staple goods and essential services such at transportation effectively meant a Lurther rdjuction in living standards in an environrne't of economic decline and rising unemployment. rhe "medtiling" with the public sector as the last economic stronghold for a large poltion of
the population proved to be a potential social explosive, rendering the implementation of
public sector reforms politically dangerous. Thus, attempts to establish extensive privatization piograms all too often tot bogged down in drawn-out political debates, resulting in a iather slow take-off of .ivatizations until the late 1980s.
However, despite these political problems, quite a substantial number . f SOEs were
already privatized during the period 1980-87. In a recent Worid Bank study analyzing the techniques of SoE privatizationsl 1, Candoy-Sekse compiled information on privatization transactions worldwide for this time period. While the provided information is very detailed for the 83 countries included, some essential data are unfortunately missing. In particul^r, information on the date of the transaction as well as its size in terms of the sale amount is usually not provided. Thus, it is impossible to determine the privatization volume and to track its development over time, only allowing for a comparison of countries based on the aggregate number of transactions. This, of course, carries the danger that individual countries are misrepresented if compared by the number of
transactions, given that the importance of each privatization program relative to the size of
the economy cannot be eetermined. Furthermore, Candoy-Sekse herself points out "that
the information provided is uneven" 12, depending on the availability of data from
government sources or World Bank reports.
But despite these caveats, some interesting inferences can be made regarding the extent of
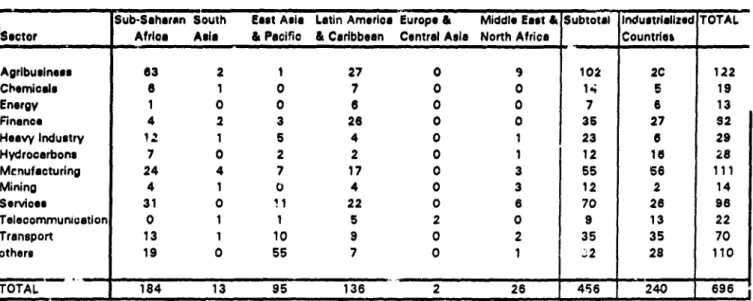
privatizations during 1980-87. The study lists a total of 696 completed privatiz. +;on
transactions, 456 of which were carried out in the 64 developing countries included. According to these data, Sub-Saharan Afiica and Latin America and the Caribbean, two regions with a stro,.g record of government involvement in economic activity, were the most intensive privatizers during the period. Europe and Central Asia had practically no privatizations due to the fact that Eastern Europe at that time still had a centrally planned economic system. ;he la;gest privatizers in Sub-Saharan Africa ware Guinea with 40 transactions, follow-d by Cote d'Ivoire with 36, Togo with 17, and Niger with 14. In
Latin America, Chiz. .eads the list with 40 individual privatizations, followed by Jamaica
with 34, Brazil with 29, and Mexico with 10.
With respect to the sectoral distribution of privatization transactions, agribusiness clearly
dominates with over 100 transactions, followed by services with 70 transactions and
manufacturing with another 55. It is interesting to note that these three sectors account
for a total of 50 percent of the total number of transactions, while energy, finance,
II Candoy-Sekse (1988).
12ibid., p.vii
transport, and hydrocarbons, which accounted! for 90 percent of the SO1 stock of debt in 1986, had a combined share of only 21 percent of all completed privatization projects during the period 1980-87. It thus seems that during thJs period most countries had not yet managed to rid themselves from the most prevalent pressure stemming from the public enterprise sector but rather engaged in privatizing other, relatively minor government-owned assets, possibly as the first timid steps toward extensive and economically
meaningful privatization programs.
Table 1: GLOBAL PRIVATIZATION 'RANSACTIONS, 1980-1987 by number of transactiort
Sub-Saharan South East Asia Latin Amerioa Europe & Middle East & Subtotal Industrialized TOTAL Sector Atrica Asia & Paclfio & Caribbean Central Asla North Africa Countries
Agribusineas 63 2 1 27 0 9 102 2C 122 Chemicals 6 1 0 7 0 0 14 5 19 Energy 1 0 0 6 0 0 7 6 13 Finance 4 2 3 26 0 0 35 27 32 Heavy Industry '1 1 5 4 0 1 23 6 29 Hydrocarbons 7 0 2 2 0 1 12 1 6 28 Menufacturing 24 4 7 17 0 3 55 56 111 Mining 4 1 0 4 0 3 12 2 14 Services 31 0 ' 1 22 0 6 70 26 96 Telecommunication 0 1 1 5 2 0 9 13 22 Transport 13 1 10 9 0 2 35 35 70 others 19 0 55 7 0 1 S`2 28 110 ITOTAL 184 13 95 136 2 26 456 240 696
S.wce: R.hcca Candoy-Se*a.. rchnhcuss of Prvetizfton of Srats-Owned Enterprise.s Vo/l/, Woed Bank Trchnkei Arpew N. 9', Washkinton. D.C. ISI
Note: others' of 6G for Enst Asia & Pacific rewts from Privatuation4 in the Philippines, which were only cted in the aggregate.
However, as already indicated, this comparison of countries based on the number of privatization transactior.s alone is misleading, not reflecting the size and irrortance of
individual transactions for each country and in comparison among countries. The fact that
Sub-Saharan Africa turns out to be the region with the strongest privatization efforts
during this period appears counterintuitive given the observation in recent years, as will be
seen in the following section. Taking into account that the vast majority of concluded privatization projects occurred in agribusiness indicates that the information includes a substantial number of small-scale privatizations with assets of very low absolute value. Thus, while the privatization effort in certain countries might look impressive in terms of the actual number of transactions completed, it is very likely that the actual economic
mH. The Recent Wave of Privatizations. 1988-1992 11.1 The Datn
In order to evaluate the magnitude of privatizations in recent years, a database was
compiled at a micro-level for the period 1988-1992, which is presented in the Appendix in
Tables A-1 and A-2. In general, the data are based on publicly available information from numerous sources ranging from newspaper and joumal articles to direct information from privatization agencies and m.nistries as well as country operations, regional support
groups, and resident missions within the World Bank. 13
For the purpose of this study, privatizations are defined as the transfer of productive assets from the public to the private sector involving some type of sale agreement. This includes all direct sales of public assets to private investors in the form of public offers or private sales. It also includes the contracting out of government services through concessions or licensing agreements. Any divestitures of SOEs in the form of simply shutting down
operations and mothballing assets, on the other hand, are not included. This should not be
interpreted as implying that such mothballing are considered unimportant. In fact, the benefits of shutting down inefficient enterprises can be substantial in the long-run through
the elimination of sectoral distortions as well as through the alleviation of budget pressures
resulting fro.n subsidy and transfer payments for the purpose of covering losses. Typically, however, this strategy is restricted to relatively minor operations with small
asset value, thus not contributing significantly to the evaluation of privatization programs
when measured in monetary units. In addition, data on this type of divestitures are not easy to come by and, even if available, are far from comprehensive.
Some warnings regarding the interpretation of these data are necessary. First of all, despite the already extensive list of individual transactions, any claims regarding completeness of this data set cannot possibly be made. For one, it can be expected that
many small-scale privatizations have been carried out by governments which are not listed
here, because individual transaction information is plain not available. For the sake of consistency, projects with a sales value of less than $50,000 were excluded, even if information was available. In addition, some countries might not appear in the list, despite having carried out privatization projects, simply having escaped the author's attention. This might be true in particular for some Sub-Saharan African countries, whose privatization programs are in terms of monetary units so small in comparison to other countries, that the, are usually not mentioned in standard sources. With respect to individual transaction information, great care has been taken to verify and update all data. However, for many projects certain pieces of information could not be obtained. In some cases, it was also impossible to distinguish between sales price and committed investments. Especially in the case of Eastern Europe, privatization contracts are often written such that the buyer commits to a certain amount of future investments besides the actual cash transfer for the purchased asset itself This makes it difficult to determine the
13 For more information on data sources and details on data compilation and estimation refer to the
Appendix.
actual sale price as well as the timing of the actual inflow of cash revenue. While
additional informnation could be obtained in the cases of Hungary and Poland to, at least
partially, correct for this problem, no better information was as of yet available for the former Czechoslovakia.
m.2 Global Trends in Privatizations
Over the period 1988-1992, the number of annua! privatizations worldwide grew rapidly
from 62 in 1988 to almost 480 in 1992, generating a total cash revenue for the public sector of almost $185 billion in a total of slightly over 1,100 transactions. Not included
here are privatizations in the former East Germany. According to the Treuhandanstalt, the
German state agency responsible for privatizations, a total of 11,043 entities were sold between 1990 and end-1992 for about $25 billion with an additional $106 billion in investment comnmitments.
The expansion in the number of privatization transactions carried out clearly stems from the developing world, where various sizable privatization programs began to take off during this time. Revenues also increased steadily, and by 1992, the public sectors of the developing world had earned $61.6 billion in about 870 privatizations. For industrialized countries, on the other hand, the list of completed privatization projects grew at a far slower pace, reaching 67 recorded transactions in 1992. One oh-ious reason for this is
that the number of entities in public hands is far smaller in industrialized countries. Their
asset value, however, is on average significantly larger: a total of around 250 projects
generated a total revenu^- of about $123 billion, resulting in an average revenue per project
of almost $600 million, compared to less than $85 million in the developing world.'4 In
1992, however, the total snies volume in developing economies of $23.2 billion was, for the first time, larger than the revenues generated by privatizations in industrialized countries ($17.3 billion).
But revenues in industrialized countries are generally quite erratic over time, being to a
large extent dependent on the size of the relatively small number of individual projects
carried out by industrialized countries each year. Thus, revenues are extraordinarily high
in 1988 for the simple reason that the Japaniese government decided to sell 9.6 percent of
Nippon Telegraph and Telephone for $22.8 billion, accounting for over half of total privatization revenues in the world that year. In 1991, the United Kingdom privatized
British Telecommunications for almost $10 billion as well as four major power utilities for
an additional $9 billion, generating another boom in privatization revenues.
The U.K. also is still the strongest privatizer in the industrialized world, having privatized
62 entities during the period with a strong focus on power and water utilities, which accounted for over 56 percent of the total $48 billion generated in revenue. Other
particularly strong privatizers in the industrialized world are Canada with 25 transactions
14 For the purpose of this calculation, only transactions were taken into account for which information about the sales price was available.
for $5.7 billion, Italy with 17 projects for $6.6 billion, New Zealand also with 17 projects for $6.3 billion, and Australia with 15 transactions for $6.2 billion.
Figure I GLOBAL PRIVATLZATIONS, 1988-1992
By Number of Transactions 500-450 i Developing Countnes 400 S 350 - 0 Industnalized Countries 300 - 250-200 . . ... 150 - -100- _ 50 0 1988 1989 1990 1991 1992
US Billion By Amount of Revenue
6ri Developing Countries ] 50-M Industrialized Countnles|rm 40... 30-20 -10 " - ~ " ' 0 1988 1989 1990 1991 1992
PvFi2zao h Xu fmw, ESa Owmw by m TmuANl wan exc&ed
ITI.2 Trends in Developing Country Privatizations
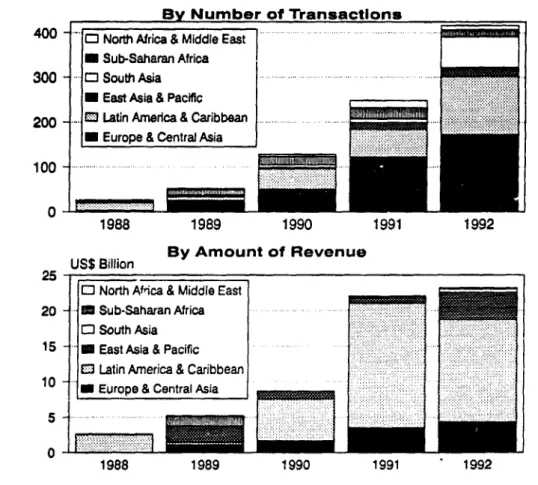
In developing countries, privatizations increased drastically over the last five years, both in
terms of the number of transaction'q as well as in revenue. The number of transactions
rose from a meager 26 in 1988 to 416 in 1992, and, over the same time period, privatization revenues increased from $2.6 billion to $23.2 billion, implying an average
nomninal growth rate of about 73 percent per year
While privatization programs are generally becoming more popular and expand rapidly,
the developments differ quite substantially across regions. In the region Middle East and
Northern Africa, only Tunisia showed any substantial privatization activity, Sub-Saharan
Africa has generally not to any major extent participated in the recent wave of privatizations and progress has been very slow. While some countries engaged in not
insubstantial privatization programs in terms of number of transactions, the asset value of
the SOEs involved is overall only marginal with the exception of two sales in South Africa during 1989. Over the period as a whole, 76 transactions could be recorded for a total volume of about $240 million or only a meager 0.4 percent of total sales revenues in the
developing world. 5 For East Asia and the Pacific, no transactions could be found for
15 Excluding South Africa with two transactions worth US$1.4 billion in 1989.
1988, but the number of completed privatizations infreased, reaching 20 in 1992 for $3.8 billion. While the number oa' transactions was not particularly large, the average asset
value of the individual projects was quite large, resulting in a total revenue of $7.8 billion
over the period as a whole. In comparison, 1992 was the year for privatizations in South Asia. While only a small number of SOEs were sold in the previous years, 1992 saw an explosive growth in privatization transactions because of strong activity in Pakistan and
Sri Lanka, reaching 69 privatizations. Most of the companies sold were, however, only of
small value, resulting in a total revenue of not more than $0.6 billion. But the strongest growth in privatization transactions was, not surprisingly, found in Eastern Europe and
Central Asia. In 1992, 173 SOEs were sold for a total revenue of $4.3 billion.16
Privatization programs in Latin America and the Caribbean expanded steadil ' .r the
last years and are certainly the most successful in the developing world in terms # enue
generated, with a peak of $17.9 billion in 1991. In 1992, the sales voiur,- a.Jine.i slightly, but was still substantial with about $14.6 billion.
Figure 2 PRIVATIZATIONS IN THE DEVELOPING WORLD
by geographic region, 1988-1992
By Number of Transactions 4__ -. O North Africa & Middle East
* Sub-Saharan Africa
300 - . South Asia - ..-....
* East Asia & Pacific 200 - Latn America & Caribbean
* Europe & Central Asia
100-0
1988 1989 1990 1991 1992
US$ Billion By Amount of Revenue 25
-C] North Africa & Middle East 20 - . Sub-Saharan Africa
Q South Asia ...
15 - U East Asia & Pacific
El Latin America & Caribbean
lo
10* Europe & Central Asia
1988 1989 1990 1991 1992
16 Note that small-scale mass pnvatizations, in particular for the case of the former Czechoslovakia, are not included here because disaggregated data were simply not available. Government sources indicate, however, that the government received slightly less than $300 million through the voucher scheme for the privatization of 1491 small enterprises. But she also argues that this scheme was irrelevant from a budgetary point of view, with the proceeds being used to cover the expenses of running the scheme.
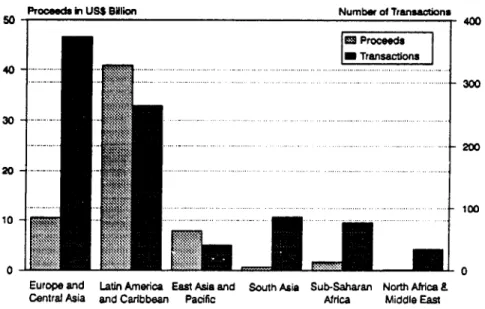
A comparison of the regions over the last five years points to some interesting differences.
The massive privatizations in Eastern Europe resulted in a total number of transaction of
373 for Europe and Central Asia, but only $10.6 billion in revenue were generated. 17 In
general, the average asset value in Eastern Europe is significantly smaller relative to other
middle income countries, rendering these privatization programs far less attractive from a budgetary perspective. But, of course, revenue generation only plays a secondary role in the effort to restructure the economic system as a whole. Privatizations in these countries primarily served as a mechanism to support the transfornation process by rapidly expanding private ownership, even if at the expense of government revenues. Latin America, on the other hand, privatized a total of 266 entities for $40.9 billion during the period, providing the governments concerned with substantial amounts of additional income.
Figure 3 PRIVATIZATIONS IN THE DEVELOPING WORLD, 1988-1992
Aggregated by Geographic Region
Prooeeds hi USS Bilion Number of Transactions
50 - 400 10- Transactions| 4 0 -, .. .... .. .. .. ... . .. .. ... ' I I... ... ... . _- ... - 1300 -... ~~~~~~~~~~~~~~200 20 -100 10 - . .. . . 0 ~~~~~~~~~~~~~~~~~~~~~0
Europe and Latin America East Asia and South Asia Sub-Saharan North Africa £ Central Asia and Caribbean Pacific Africa Middle East
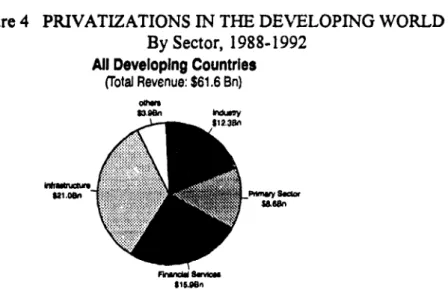
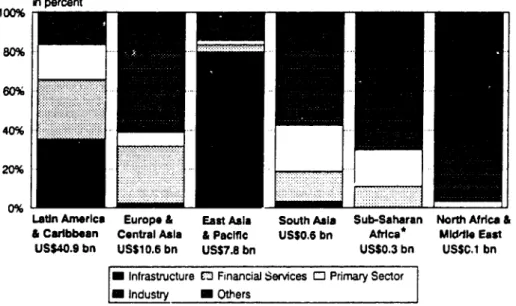
In terms of econonic sectors, privatizations in infrastructure, which includes electric and
water utilities, transportation, and telecommunications, are clearly dominating, accounting
for 34 percent of total revenues for the developing world as a whole. Industrial production, comprising chemical production, heavy industry, and manufacturing is the second most important sector. having generated a fifth of total revenues. Privetizations of financial institutions was also very strong during the period, accounting for almost 26 percent, resulting primarily from the re-privatization of commercial banks that were nationalized in many countries during the early stages of the debt crisis. With respect to the primary sector, privatizations were relatively strong in petroleum-related activities.
The number of mining transactions was relatively minor, and while a not insignificant
17 Excluding Portugal and Turkey, the only non-Eastern European countries in the group, 294 entities were privatized for a total of only $5.7 billion.
number of agribusinesses were sold by developing country governments, they were typically small in terms of asset value.
Figure 4 PRIVATIZATIONS IN THE DEVELOPING WORLD
By Sector, 1988-1992
All Developing Countries
(Total Revenue: $61.6 Bn)
Umh WU
815.0ne
k*iucUa incAudk pow, wwoonmuicoor, bmwnpoil, wnd waw Pnmny Sector ndudas agrobufIb, hdrocarboon, an mng;
InduWy hckdm dchja, hu wutry, "nd mamAactumV; odwa Wmiudm imnCes and LtracbcM which coWd not be cwa.ed.
But again, these trends differ quite substantially among geographic regions. Given that
Latin America and the Caribbean represents two thirds of worldwide privatization revenues, the sectoral distribution in this region is very similar to the global one. Due to
the privatization of large telecommunication entities in Argentina, Mexico, and Venezuela,
as well as the sale of numerous utilities and transportation enterprises, particularly by the Argentine government, infrastructural privatizations amounted to 14.5 billion or 34 percent of the total. Mexico privatized the entire banking sector during 1991 and 1992 for a total of $12 billion, making privatizations in financial services particularly important, accounting for over 30 percent of total revenues. Privatizations in industry of almost $10 billion were boosted by the sale of the Brazilian Usiminas for around $1.5 billion in 1991. The quite sizable amount of revenue through sales of primary sector enterprises resulted foremost from the privatization of large stakes of petroleum- and gas-related activities in Brazil and, especially, in Argentina, as well as from the privatization of Mexicana de Cobre in 1988 for almost $1.4 billion.
Privatization revenues in East Asia and the Pacific are overwhelmingly dominated by
infrastructural projects, accounting for almost four fifth of the total sales revenue of $7.8
billion during the period. The largest projects in this area were one energy utility in South
Korea for $2.1 billion as well as several largc utility and telecommunications projects in
Malaysia for a total of $3.9 billion. Sales of manufacturing enterprises as the second most
important sector accounted for only 9 percent of total revenue.
Privatizations in South Asia are only minor in asset value, amounting to only $600 million or 7 percent of total revenues for all of Asia. But in terms of numbers of transactions, significant programs exist in Pakistan, Sri Lanka, and to a smaller extent also in India.
The sell-off of manufacturing enterprises amounted to almost half of total revenues, followed by the primary sector, which accounted for another quarter.
Eastern Europe and Central Asia differs quite significantly from other regions in the sectoral composition of its privatizations. Infrastructure projects are marginal, representing less than 3 percent of total revenues. Industry with almost 54 percent of the total is by far the strongest sector. Eastern Europe alone carried out around 150 transactions in chemical production, heavy industry, and manufacturing. In addition,
Turkey actively pursued a privatization of its cement producing industry, which generated
almost 60 percent of its total privatization revenue.
In Sub-Saharan Africa (excluding South Africa), revenues from privatization were relatively low, adding up to only $250 million over the five years. Privatization in industry and services being the most relevant transactions, amounting to 44 percent of total revenue. In comparison to the other regions it is especially noteworthy that practically no
infrastructural projects have been privatized.
Privatizations in North Africa and the Middle East are determined by the sales of the Tunisian government during the period. Two thirds of total revenues were generated through the sale of large hotel complexes, followed by another 30 percent from the sale of
various manufacturing enterprises of only minor asset value.
Figure 5 SECTORAL DISTRIBUTION OF PRIVATIZATIONS IN THE
DEVELOPING WORLD
as share of total revenue, 1988-1992 ni percent 80% 80% 40% 20% 0%
Latin America Europe & East Asia South Asia Sub-Saharan North Africa & 8 CarIbbsan Central Asia & Pacific US$0.6 bn Africa * MId'ti. East
UIS$40.9 bnl US$10.6 bn US$7.8 bn US$0.3 bnl U5SC.1 bnl
I* Infrastructure 0f Financial Services r- PriaySco *0 Industry U Oth~ers
Wrk*4Lrez nckudm poww. IlcWonmmNcabomans. vpo,L an walW, Primary Sectwr nekide agobusneu tydrocarboru ad rmnng, Inkdhtr wckncu
duffkals heaw, IndiSy, 4mand u. ,qr 011w, mkud" sunces " arcwl emaa, wkach coud rn,A be c4faSfabd
%acud.ng SoA1. Ah,A
IV. Privatizations as a Source of Foreign Exchange IV.1 Data
Foreign investors can participate in privatization transactions through foreign direct investment or portfolio equity investment. In the case of portfolio equity investment, the
foreign buyer engages in a purely financial investment with the indivi
eal
share notexceeding 10 percent. For an investment to qualify as foreign direct investment, the investor has to acquire 10 percent or more and is usually interested in having, at least,
substantial influence over the operations of the company.
Privatization transactions involving portfolio equity investments are rare, but typically quite large in volume. Henec, this information is generally well documented and easily available. In most cases, hc -ever, foreign investors tend to be more interested in direct investments, allowing them to shape the future of the enterprise bought, as independent as possible from interests of local groups, including the state. Information about the participation of foreign buyers in privatization programs including their share in the purchase is typically not readily available, especially not at a disaggregated level. Hence, in cases where no additional information could be obtained, the amount of foreign direct
investment resulting from privatizations had to be estimated based on the nationality of the
buyer. If no information was at all available regarding the buyer's identity, it was assumed that the investor was local, involving no foreign investment. In this respect, the foreign exchange values obtained are a lower bound of actual inflows. On the other hand, inflows are possibly overestimated in cases where committed investments were included in the purchasing price. Especially in Eastern European transactions, contracts are often written such that future investments are included. While adjustments could be made based on additional information in the cases of Hungary and Poland, the numbers for
Czechoslovakia have to be taken with a grain of salt due to data limitations.
IV.2 Overall Trends
The involvement of foreign investors in privatization programs is sought after by most governments despite - often strong - political opposition, fighting against the "selling out" of domestic interests. However, the participation of foreign investors is often essential, particularly for large projects, because the local capital market is too thin and needed technological and managerial expertise is not available. Furthermore, the sale of such assets promises the receipt of sizable amounts of foreign exchange, needed in a situation of limited access to foreign capital. But in order to attract foreigners, the privatizing
authorities first have to prove their political willingness and commitment to an extensive
privatization effort, characterized by a reliable and transparent system of rules and regulations. Hence, during the take-off period, most privatization programs do not show any extensive foreign participation, but over time the number of foreign buyers rises quickly, should the program prove reliable.
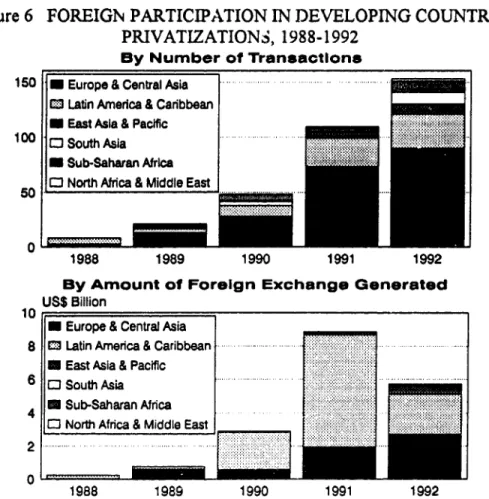
While foreign investors only participated in 8 operations in 1988, they were involved in 200 by 1992 and a total of 392 over the whole period. A total of $18.5 billion in foreign exchange was generated during this time, with a peak of $8.8 billion in 1991, representing
40 percent of the total revenue from privatizations that year.
Figure 6 FOREIGN PARTICIPATION IN DEVELOPING COUNTRY
PRIVATIZATIONS, 1988-1992
By Number of Transactions
150 . Europe & Central Asia El Latin America & Carbbean * East Asia & PacAic
100 QSouthAsia...
* Sub-Saharan Africa
sO North Aftca & Middle East . _
50
-1988 1989 1990 1991 1992
By Amount of Foreign Exchange Generated
US$ Billion
10
* Europe & Central Asia
8 E Latin America & Caribbean
1 East Asia & Pacific . .
0 O South Asia 4 Sub-Saharan Africa
O North Africa & Middle East ... l.. 2
0
1988 1989 1990 1991 1992
Due to the lack of domestic savings, Eastern Europeani countries were especially
dependent on the participation of foreign investors, who paid a total of $5.3 billion for 194
enterprises during 1988-92 which amounts to over 90 percent of the total revenues generated. 18
Latin America clearly was the region that managed to attract the largest amount of foreign exchange through its privatization effort since 1988, amounting to 64 percent of foreign exchange from privatizations in the developing world. 1991 was the peak year for the region with almost $6.8 billion in foreign exchange, primarily due to the privatization of large telecommunication units in Argentina, Mexico, and Venezuela. On average,
Is Including Portugal and Turkey, 207 companies were privatized in Europe and Central Asia with a foreign exchange content of $5.9 billion, amounting to 56 percent. Also note that the share of foreign exchange in total rcvenue in Eastern Europe is slightly exaggerated by the fact that revenues from small-scale and mass privatizations are excluded.
foreigners provided more than a quarter of the total privatization revenues during the period.
While foreign participation in East Asian privatizations rose quickly over the last two
years, overall it was not particularly strong with only 18 projects during 1988-92. Foreign
privatization investments provided only about $0.7 billion in foreign exchange, slightly more than 8 percent of total revenues.
South Asian privatizers received a total of 52 million from foreign investors in 17 transactions during the period. While the amounts involved appear rather small, it is interesting to note that 11 of these 17 sales with foreign participation occurred in 1992, showing a strong upward trend.
In absolute terms, the foreign exchange inflow into Sub-Saharan Africa was only marginal with a total of about $100 million for the whole period, in 21 transactions with foreign participation, reflecting the small average asset value of the SOEs sold. As a share of total revenues, however, foreign investors still contributed an average 37 percent (excluding South Africa).
North Africa and the Middle East had barely any foreign participation in privatizations. During the five year period, only four transactions involving foreign investors could be
recorded. Only about US$27 million were generated this way, dominated by the sale of three Tunisian hotels to a French and Swiss investor group for US$19.2 million in 1992.
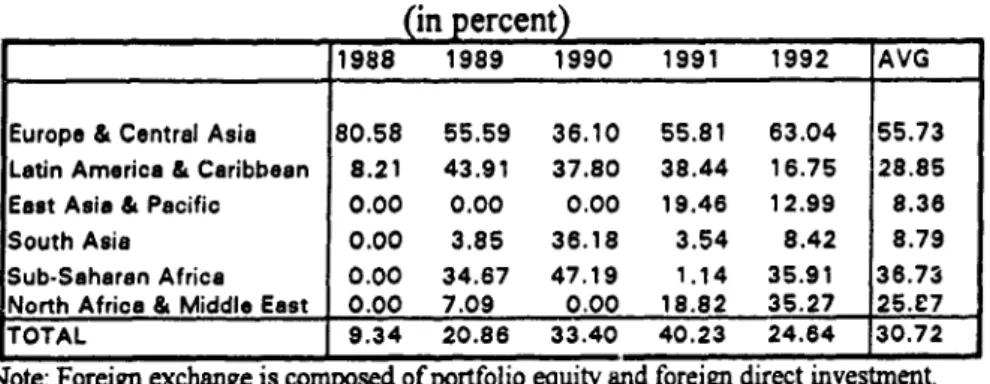
Table 2 FOREIGN EXCHANGE AS SHARE OF TOTAL REVENUE
(in
percent)1988 1989 1990 1991 1992 AVG
Europe & Central Asia 80.58 55.59 36.10 55.81 63.04 55.73 Latin America & Caribbean 8.21 43.91 37.80 38.44 16.75 28.85 East Asia & Pacific 0.00 0.00 0.00 19.46 12.99 8.36
South Asia 0.00 3.85 36.18 3.54 8.42 8.79
Sub-Saharan Africa 0.00 34.67 47.19 1.14 35.91 36.73
North Africa & Middle East 0.00 7.09 0.00 18.82 35.27 25.£7
TOTAL 9.34 20.86 33.40 40.23 24.64 30.72
Note: Foreign exchange is composed of portfolio equity and foreign direct investment.
IV.3 Portfolio Equity Investments
Financial investments in developing country companies can be made either directly by buying a small share in a company or by purchasing equity instruments, traded in
international security markets. The most commonly used instruments are so-called ADRs
(American Depository Receipts) and GDRs (Global Depository Receipts). ADRs are negotiable equity-based irstruments publicly traded in the U.S. securities markets, attracting U.S. investors who are legally limited in their capability of directly investing in foreign stock markets such as several institutional investors. GDRs function exactly like
ADRs with the additional feature that they can be traded simultaneously in different
securities exchanges all over the world. 19
With respect to privatization transactions, such instruments were used extensively in the
sale of large Latin American telecommunications companies. Chile was the first country
to use equity instruments in July of 1990 for the sale of the remaining part of Tdlefonos de
Chile. $98 Million in instruments were offered at the New York Stock Exchange and represented the first international equity offering by any Latin American country for 25
years.2 0 In 1991, Argentina was the first country to make use of GDRs in thf
privatization of Telefonica de Argentina, issuing securities for a nominal value of $364 Million. In March 1992, Argentina issued $270.3 Million in ADRs and GDRs for the sale of 30 percent in Telecom Argentina. The largest single issue of ADRs was carried out by Mexico in May 1991, when the remaining 15 percent of Telefonos de Mexico (TELMEX)
were privatized for a total of $2.4 billion. A year later, TELMEX offered another $1.2 billion in ADRs. In addition, Mexico issued GDR. worth $638 Million in 1991 in the privatization of its largtst bank Bancomer, which sold for a total of $2.5 billion. In February of 1992, Veneziela also issued GDRs worth $1 10.5 Million when it privatized
Sider4rgica Venezolana.
But securities issues in privatization transactions were not limited to Latin America. Since
end-1991, China allows foreigners to buy non-voting "B"-shares in a small number of companies, offered by the government in the stock exchanges of Shanghai and Shenzhen. Up to end-1992 such "B"-shares were offered for 11 companies, generating almost $280
million in foreign equity investments. While the termn "privatization is not officially used
by the Chinese governnent, these transactions effectively represent a transfer of partial ownership in assets from the public sector into private hands.
Direct portfolio investment, in which an investor acquires a minority share in an enterprise, is rather unusual. While good information on this type of investmcnt is difficult to obtain, three cases were recorded. The largest case was the partial privatization of TELMEX in 1990, when Southwestern Bell and France Telecom each acquired 5 percent of the stock for a total of about $860 million. In the case of the Brazilian Usiminas, one of the country's largest steel producers which was privatized in 1991, foreign investors bought a
stake of only 6 percent for approximately $90 million. When Hungary sold 56 percent of
the state-owned travel agency IBUSZ, foreign financial interests participated with 41 percent for around $13 million.
In general, 21 transactions were recorded for the period 1988-92 qualifyinf as portfolio equity investment for a total $4 billion. This amounts to 8.5 percent of total privatization
revenues for the developing world and almost 28 percent of total foreign exchange inflows
resulting from privatization transactions. Furthermore, in some cases such as TELMEX or Aerovias de Mexico, which was privatized in 1988 and issued equity securities in 1991, these newly privatized companies made use of the rapidly growing portfolio investment market by issuing additional securities. Hence, inflows in the form of equity investment9
19 see Gooptu (1993), pp.21f. 20 ibid., p.52.
can be expected to grow further in the near future, directly through additional large-scale privatizations and indirectly through follow-up equity issues by already privatized companies.
IV.4 Foreign Direct Investment
Direct investment (FDI) was clearly the most common vehicle used by foreign investors in privatization transactions, especially in sma!l- and medium-sized transactions. FDI
accounted for the remaining 371 recorded privatizations with foreign participation during
1988-1992, worth $14.5 billion. Hence, privatizations were certainly one of the reasons
underlying the rapid increase in FDI over the last five years, accounting for an average of abl,ut 11 percent of total FDI to the developing world during the period.
Europe and Central Asia received the largest share of its FDI inflows from privatizatiors, reaching an average of almost 32 percent during the period. This reflects the strong
dependence of the transforming economies in Eastern Europe on privatizations as the main
vehicle to attract foreign investors. While the available FDI information generally does
not appear very reliable for the Eastern European countries2 1, they seemed to have
received almost 85 percent of their FDI from the sale of their SOEs.
Latin American countries showed a strong growth in privatization revenues stemming
from foreign investors, in particular during 1990 and 1991, when privatizations accounted
for over a quarter of total FDI flows. Over the period as a whole, privatization FDI still accounted for over 16 percent. Especially in the cases of Argentina and Venezuela, privatization FDI was particularly strong, accounting for a share of 36 percent and 41 percent respectively over the period (see Table A-4). Mexico, on the other hand, as the strongest privatizer of the region in terms of sales volume, only showed an average share of slightly more than 5 percent, primarily because the sizable privatization of the banking sector during 1991 and 1992 was for all practical purposes limited to domestic investors, generating no FDI inflows at all.
In East Asia, South Asia, Sub-Saharan Africa and North Africa and the Middle East,
privatizations only contributed marginally to FDI inflows. For one, no indication could be
found that foreign participation in the existing privatization programs is particularly strong. This is due to the fact that in many countries strong restrictions are imposed regarding the participation of foreigners in privatizations. In East Asian countries, on the other hand, FDI flows have been very large over the last years, rendering privatization transactions marginal. In addition, the capital markets in these countries are already so
21 For HLugary, for example, the IMF does not report any FDI inflows until 1991, uhilc privatization transactions with foreign participation are recorded since 1989.
strong, that a participation of. foreign investors is not essential in order to obtain an
adequate price for SOEs.
Table 3 FOREIGN DIRECT INVESTMENT FROM PRIVATIZATIONS22
(in US$ Million and percent)
198a 1989 1990 1991 1992 1988-92
Europe & Central Asa
-fDlf rom privatizations 33.2 61 6.6 586.6 1,930.0 2,704.8 6,869.2
-as share of total FOI (%) 2.38 22.06 17.84 36.37 47.87 31.86
Latin America & Caribbean
-FDI from privatizations 213.7 157.3 2,136.3 3,299.9 2,311.8 8,119.0 -as share of total FDI (%M 2.67 2.20 27.65 26.85 16.78 16.43 Eet Asia & Pacific
-FDI from privatizations 0 0 0.0 0.0 75.0 301.7 376.7
-as share of total FDI (%) 0.00 0.00 0.00 0.58 1.95 0.68 South Asia
-FDl from privatizations 0.0 0.1 10.6 4.2 37.0 51.9
-as share ot total FDI (% 0.00 0.04 3.64 1.18 8.81 3.39 Sub-Saharan Africa (a)
-FDI from privatizations 0.0 13.8 38.1 2.8 44.0 98.5
-as share of total FOI (%) 0.00 0.56 5.70 0.15 3.44 1.37
North Africa & Middle East
-FDI from privotizations 0.0 1.0 0.0 3.2 22.5 26.7
-as share of total FDI %%) 0.00 0.06 0.00 0.45 1.09 0.38 TOTAL
-FDl from privatizations 246.9 787.8 2770.6 5314.9 5421.8 14,542.0 -as share of total FDI (%) 1.25 3.38 11.54 15.67 14.17 10.44
So,rceforPFD data: DMW, Balanc ofPayments Yearbook 1992
Note: Foreign dired invcsment data for 1992 ae World Bank and DM staff esrimate. (a) excludLng South Africa
V.
Privatization Exoeriences at the Countra LevelFor the period 1988-92, privatization transactions were recorded for a total of 72 nations, of which 47 were developing countries. Several countries, however, only show one or two transactions, therefore not indicating the existence of an extensive privatization
prograr aiong those 29 developing countries with numerous privatization transactions,
the experiences differ substantially in terms of size, sectoral focus. and foreign participation.
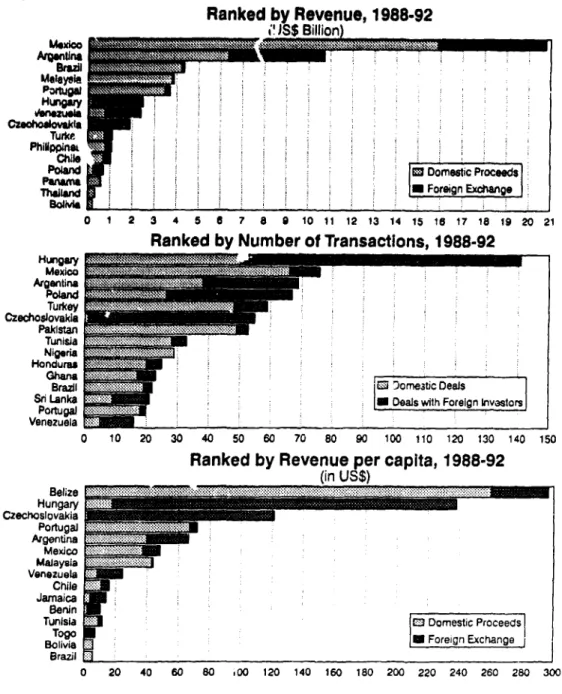
In terms of sales volume, Mexico clearly leads the developing world with a total of almost $21 billion during 1988-92, about $5 billion of which came from foreign investors. The three largest sellers, Mexico, Argentina, and Brazil, accounted for 60 percent of total privatization revenues among developing countries. With respect to numbers of
22 A country breakdown on FDI resulting from privatizations and its share in total FDI is provided in the appendix in Tables A-3 and A-4.
transactions, however, the same three were responsible for only 19 percent of all developing country privatizations. This is only marginally larger than the 141 transactions recorded for Hungary alone. In fact th. three largest privatizers in Eastern Europe, Czechoslovakia, Hungary, and Poland, accounted for 30 percent of all transactions. The degree of foreign participation is quite different among individual countries, but it is interesting to note the strong participation of foreigners in privatizations in Eastern Europe in terms of sales volume as well as number of transactions.
Figure 7 THE 15 LARGEST PRIVATIZERS IN THE DEVELOPING WORLD
Ranked by Revenue, 1988-92 ;'.JSS Billion)
Turke
Chilepna
PAnama .ii:E~ *Foreign Exchange
t0^wi E= =z .
0 1 2 3 4 5 6 7 8 9 1 0 11 12 13 1 4 15 1i 1 7 18 a1I9 20 21
Ranked by Number of Transactions, 1988-92
Hungary ' .. . Poland Turkey E ..;i .... Czechoslovakia Pakistan .... :... Tunisia Nigeria Honduras
Brazil n. ..omestic Deals
.Lanka * Exvangor. U e Foreign
Portugal Venezuela
0 10 20 30 40
e
50 0 70 80 90 100 110 120 130 140 150 Ranked by Revenue per capita, 1988-92(in US$) Belize. Hungary Czechoslovakia Portuga= Argtna Mexico Malaysia Venezuela Chile Jamaica Berin
Tunisia E3 Domestic Proceeds
TOg , Foreign Exchange
Brazil ____________________________
0 20 40 60 8 00 120 140 160 180 200 220 240 260 280 300
In order to get an understanding of the intensity of the existing privatization programs