Tough times, tough choices
Being open and honest about NHS finance
www.nhsconfed.org/finance
Also availableThe NHS Confederation
The NHS Confederation represents all organisations that commission and provide NHS services. It is the only membership body to bring together and speak on behalf of the whole of the NHS.
We help the NHS to guarantee high standards of care for patients and best value for taxpayers by representing our members and working together with our health and social care partners.
We make sense of the whole health system, influence health policy, support our members to share and implement best practice, and deliver industry-wide support functions for the NHS.
www.nhsconfed.org
Our work
In consultation with our member policy forum, we have committed to focusing on key issues in 2012/13. Our work programmes are designed to ensure we are concentrating our efforts where our members need the most support as they strive to make the required efficiency savings and maintain and improve the quality of care while implementing the biggest reorganisation of the NHS in its history. This report forms part of our work programme
on Rising to the financial challenge. To read more about our work in this area, see www.nhsconfed.org/finance
For more information on our work, please contact: The NHS Confederation 50 Broadway London SW1H 0DB Tel 020 7799 6666 Email enquiries@nhsconfed.org www.nhsconfed.org
Published by the NHS Confederation © The NHS Confederation 2013
You may copy or distribute this work, but you must give the author credit, you may not use it for commercial purposes, and you may not alter, transform or build upon this work.
Registered Charity no: 1090329 BOK60063
Executive summary 2 Introduction 3 Tough times 4 Tough choices 6 Do nothing 7 Spend more 9
Do more for less 13
Do things differently 17
Conclusion 20
Further information 20
Executive summary
The NHS faces an unprecedented financialdilemma; the supply of funding is struggling to match the growing demand for healthcare. The public is developing a greater awareness of this challenge but, although they have often been told about tough choices, there has been little attempt to explain what exactly these tough choices might require.
This report sets out options, not solutions. These choices are not pain-free and some may prove too difficult to swallow. The public will be better placed to understand and engage in a national debate, if we are open about what happens, where, and why.
Tough times
The financial pressures on the NHS are increasing due to a growth in demand – more people need more care, and want this care to be better than it has ever been before.
In recent years, cost burdens have emerged due to the effect of lifestyle choices on public health and the impact of allowing mental health and social care conditions to continue to be undiagnosed and untreated. There are few signs that great strides will be made, particularly in the short term.
Tough choices
The scope of what can be done to respond to tough financial pressures are limited and the choices will continue to narrow. These are not just choices for the NHS to consider in isolation; society as a whole will need to become involved in the debate. In this paper, we identify four tough choices.
Do nothing
The NHS may decide it can continue to treat patients in much the same way, but would run the risk of going into financial deficit. To do nothing might mean that services need to be rationed or might lead to a decline in quality.
Spend more
Increasing the level of spending would not be feasible without an impact on other public services or the British economy. The government could raise extra revenues through private spending, but this is unlikely to be easy because of widely-held sentiments that access to NHS services should be determined by need and not ability to pay.
Do more for less
The NHS is currently being asked to do more for less. Most of the pressure from this has been on reducing staff costs. Savings could also be made by improving the way NHS organisations procure goods and services or by managing capital assets in a more efficient way. However, NHS leaders are now questioning how sustainable this strategy is.
Do things differently
There is a growing consensus that services need to be transformed to improve quality, while also making them more efficient and sustainable. However, plans to change services are often controversial with the public, even when there is a good clinical case for doing so.
Introduction
The NHS is in an unprecedented financial predicament. Demand for healthcare continues to grow at a rate that current funding will struggle to match. The UK is not alone in facing such significant challenges – every health system across the developed world has similar problems. We have so far avoided the open and meaningful conversation needed with the public about how the NHS should confront these pressures and the consequences they could have on the future of health services in Britain.This report addresses this ‘missing dialogue’ by being open and honest about NHS finances and the tough choices ahead. It sets out the choices which need to be considered as part of the effort to guarantee the delivery of safe, effective and sustainable health services in the years to come.
The analysis in this report focuses on services provided in England. Decisions to be made in Wales, Scotland and Northern Ireland will be dependent on the devolved administrations and the priorities set in their jurisdictions. This report focuses primarily on healthcare services – issues for social care have previously been explored in the NHS Confederation briefing Papering over the cracks.1 It is
clear that the need to increase funding for social care services will put a greater strain on resources available for health, while unmet social care needs are likely to further increase demand for health services.
This report sets out options, not solutions. None of the options are pain-free, and some may prove too difficult to swallow. However, the public will be better placed to understand and engage in a national debate if we are open about what needs to happen, where, and why.
Tough times
The NHS is in the middle of tough financial times. The need to deliver 4 per cent savings every year until 2015 is of immediate concern. Savings of a similar amount will likely be needed after 2015.2 Many NHS leaders have
indicated that these are the worst times they have ever experienced.3 The cause is rising
costs within the NHS, driven by a number of factors:
• increased demand • innovation
• lifestyle choices
• mental health and social care needs.
Increased demand
The main driver of costs in the NHS is demand – more people needing more care and wanting it to be better than ever before. There is nothing wrong with this, and such expectations are proof of what the NHS has been able to achieve up until now. We naturally want people to live longer and are proud that a child born today can expect to live more than a decade longer than one born in 1948.4
Because of the NHS, people have been cured of diseases that might previously have been life-long, and have been able to manage conditions that may have shortened their lives. This requires the NHS to adapt to caring for the needs of an older population, who tend to stay in hospital for longer and often have more complex long-term conditions with multiple medical needs.5
Innovation
The way that the NHS treats patients today is more sophisticated than in times past. The increased use of health technology means that patients can access procedures, devices and medicines that are more effective at tackling their conditions. These innovations often require expertise and research that will make them more expensive.
The NHS should be proud that it has been able to foster such technological progress and, while it will naturally want to keep technology costs as low as possible, should strive to continue to use innovations to improve services for patients.
Lifestyle choices
The effect of lifestyle choices on public health and wellbeing has become increasingly
significant as a contributor to rising costs in the NHS. Smoking, excessive alcohol consumption and obesity are proven to increase the rates of preventable diseases. The cost to the NHS for treating these associated conditions is estimated at a cumulative £17.9 billion each year – almost a fifth of the annual NHS budget.6
The rising rate of diabetes – expected to double in the UK by 2025 – is an example of the impact of lifestyle choice. The NHS spends almost £10 billion each year on treating diabetes, of which 80 per cent is spent on managing avoidable diabetic complications.7
At any one time, patients with diabetes account for around a fifth of hospital inpatients and on average require a stay three days longer than people without diabetes.8
Mental health and social care needs
Problems associated with mental health, including medically unexplained symptoms, are estimated to cost the NHS around £13.5 billion a year in extra spending on physical health services.9 If undiagnosed and untreated, many
mental health problems will lead to poorer health outcomes for patients, including higher rates of mortality and morbidity. Studies show that when mental health conditions are better managed, acute inpatient bed use is reduced by shortening lengths of stay and reduced rates of readmission, particularly among older patients.10
The same can be said about social care which, if it continues to be unreformed, will lead to poorer health outcomes and increased costs for the NHS.
Figure 1. Spending projections in Wanless report scenarios
Managing demand
The four factors above indicate demands that are driving up costs in the NHS, but also show that if managed better the effects could be limited. In 2002, the Wanless report suggested that increases in costs in the NHS might depend on how engaged the public are in their health. It reasoned that when patients were fully engaged, health resources were used more efficiently, with improved life expectancy and health outcomes.11 Over a 20-year period, the
estimated annual cost to the NHS in failing to engage the public was around £30 billion by 2022/23 (see Figure 1).
Although there are few signs that great progress will be made in health prevention in the
short term, and NHS costs will rise as a result, success in managing the demand on the NHS could make many tough choices unnecessary, or at the very least a lot easier.
Tough choices
The scope of what can be done to respond to tough financial pressures is limited and the choices – none of which are easy – will continue to narrow. These are not just choices for the NHS to consider in isolation; society as a whole will need to become involved in the debate. In this report, we examine four choices: • do nothing• spend more • do more for less • do things differently.
While some appear more attractive than others, they are all challenging in different ways. It is also likely that none on their own could meet the scale of the financial challenge we face, so may need to be used in some combination.
The first option is to do nothing at all. The NHS may decide to continue to treat patients in the same way but within tighter financial constraints. In the 2010 spending review, the NHS budget was forecast to increase in real terms by just 0.1 per cent each year, on average, until 2015 (see Figure 2).13 So, the
NHS budget between 2011 and 2015 will effectively be the same each year, although real expenditure on health decreased in 2011.14
Financial deficit
A flat budget, together with increased costs, puts the NHS at greater risk of going into financial deficit. In 2011/12, the NHS reported an overall surplus of £2.1 billion, which indicated that many organisations had successfully achieved the difficult savings targets they had set themselves. However,
Figure 2. Growth in real terms health spending
this figure disguises worrying indications about the sustainability of some individual NHS organisations. NHS trusts, which are expected to break even each year, reported an overall surplus of £40 million. Yet without the additional financial support they received from strategic health authorities (SHAs) and primary care trusts (PCTs), they would have posted a net deficit of over £110 million.15
NHS foundation trusts reported a £444 million surplus, but their overall profitability continues to decline and their average financial risk rating continues to grow.16 In total, 31
foundation trusts and NHS trusts reported deficits that totalled £307 million.17 Had
the NHS chosen to do nothing over the last two years, i.e. not made significant savings, the financial decline would have been more apparent. Similarly, if the NHS were to do nothing from now on, the deterioration into fiscal deficits could be accelerated.
Source: Nuffield Trust, 201218
Decommissioning
Tackling financial deficits within a ‘do nothing’ approach may lead to some NHS services being withdrawn, as the delivery of services deemed not to offer sufficient clinical or cost effectiveness are reconsidered.19 The
amount of money to be saved by this is debatable and would depend largely on where NHS organisations set the threshold. It is estimated that up to £1.5 billion could be saved by decommissioning non-effective interventions, and a further £0.7 billion saved by decommissioning services of relatively limited clinical value.20
The National Institute for Health and Clinical Excellence (NICE), which makes many of these decisions, is often accused of rationing the system. In particular, there can be a public backlash to a decision not to recommend the reimbursement of a medicine. Similarly, where NICE guidance on reimbursement is not implemented uniformly across the NHS, there are accusations of a ‘postcode lottery’ for health.
Services could be rationed without withdrawing them altogether, by allowing treatment waiting lists to grow – ‘rationing by delay’.21 This would
affect patients, who would be forced to wait longer for treatment, but could also harm the Government politically. The right to be seen within maximum waiting times is enshrined in the NHS Constitution, and national average waiting times are often presented to the public as an indication of the current level of quality in the NHS.
Decline in the quality of care
A far more alarming potential consequence of doing nothing is a decline in the quality of care. Although it is difficult to quantify the link between financial and quality failure, it is clear how one could potentially lead to the other.22
NHS trusts in financial distress tend to have greater volatility in governance, with a higher turnover of executive staff and less consistent leadership. Financially challenged trusts will also be less able to make investments aimed at improving services and more likely to be under pressure to make immediate savings.
When asked how patient care had been affected by recent financial pressures, 42 per cent of NHS leaders said that the patient experience of care had worsened, with only 34 per cent saying that it had not been affected.23 Analysis of the
17 foundation trusts with the highest financial risk ratings showed that 41 per cent had at least one Care Quality Commission (CQC) standard breach outstanding, compared to just 26 per cent of the 50 foundation trusts with the lowest financial risk ratings.24
Although there are now clear standards and effective quality regulations in the NHS, major failures can still occur and variations across the system may widen. This has been highlighted – albeit not primarily due to financial factors – by the recent inquiry into Mid Staffordshire NHS Foundation Trust.
Can we do nothing?
The NHS will find it difficult to do nothing in a worsening financial environment. Patients and the public are sensitive to drops in quality, and this is never likely to be an acceptable price for dealing with fiscal challenges.
A simple solution to meeting growing demand and costs is to increase the level of spending. Indeed, most health systems in developed nations have done just this in recent years, regardless of the balance between public and private spending (see Figure 3).
Public spending
Long-term projections are that current demographic trends will drive up health spending. Forecasts are that health spending could rise from 18 per cent of government spending today to more than 32 per cent in 2060 (see Figure 4).25 If health spending
increased, between 2015 and 2022, in line with its long-term average growth of around 4 per cent, it would force a seven-year pay freeze on
other public services.26 While the Government
could, in theory, choose to spend more money on health, in practice it would not be feasible without a profound impact on other public services. The bigger the slice of the public spending ‘pie’ allocated to health, the smaller the slice for other public services.
One way that governments might attempt to mitigate this impact would be to increase the total size of the public spending pie, by increasing tax revenues or borrowing more from financial markets. Both actions could have long-term consequences for the British economy. Increasing taxes is not only unpopular, there might be a point above which the marginal tax take could start to fall. Borrowing more money can only be done until the cost of borrowing becomes punitive.
Figure 3. International health spending 1970–2010
Source: OECD Health Data, 201227
Figure 4. Composition of public spending
Private spending
If increasing public spending on health is problematic, some governments may look to raise extra revenues from private spending. The most likely source for this would be to increase the user charges that are currently applied (see Figure 5). Currently, the largest user charge in the NHS in England is the co-payment for prescribed pharmaceuticals. The government has regularly used prescription charges to raise extra revenue – the payment has increased from 20p in 1979 to £7.65 today. However, only around 10 per cent of prescribed pharmaceuticals in the NHS are subject to this charge, the remainder being exempt for a variety of reasons.29 Hence, the
extra revenue that might be raised through the charge is limited, while inflating it further could increase the risk that some patients will choose to go untreated or will purchase cheaper, unregistered medicines via the internet.30 Source: Institute for Fiscal Studies, 201228
*if health spending grows 1% p.a. over GDP
Figure 5. NHS sources of finance
Case study. Effects of introducing users charges in Germany
In 2004, the German healthcare system introduced a charge for physician visits. A ten Euro charge is applied to each physician or dentist visit in a three-month period. It is applicable to those aged over 18 and covered by statutory health insurance – around 90 per cent of the population. The charge is paid directly to the physician, who passes it on to the sickness fund, and is added to the patient’s out-of-pocket expenses, of which there is an annual limit of 2 per cent of gross annual income or 1 per cent for those with chronic conditions.
Twenty-seven per cent of patients surveyed said they delayed a physician visit, while 18 per cent avoided a visit altogether.33 Younger people were more likely to have avoided or delayed a visit, which might be reasonable considering they are usually healthier. However, patients in lower income groups were more likely to delay or avoid a physician visit, even those patients with chronic conditions.
Other health systems have introduced user charges that go beyond those currently employed in the NHS – for example, user charges for physician visits in France and Germany.32 Such charges in the NHS might
have the same limitations as prescription charges, where patients may be deterred from accessing health services. Studies following the introduction of the German charge in 2004 suggest that patients, particularly younger patients and those on lower incomes, avoided or delayed visiting a physician (see case study below).
The NHS might raise private income by introducing or extending other charges applied to patients while in hospital – for example, for access to food or television. However, the amount that might be raised from these charges, above the costs for providing the service, is probably not significant. Applying any charges in the UK is difficult, given the commitments from political parties of all colours to maintain the NHS as free at the point of need.
The Health and Social Care Act 2012 has loosened some controls on the ability of NHS foundation trusts to raise revenue by accepting more private patients. Foundation trusts will be permitted to attract up to 49 per cent of their income through private business. While it is not expected that many foundation trusts will actually reach levels near this cap, it is likely that private income will increase above previous levels that were usually set at around 2 per cent of income.
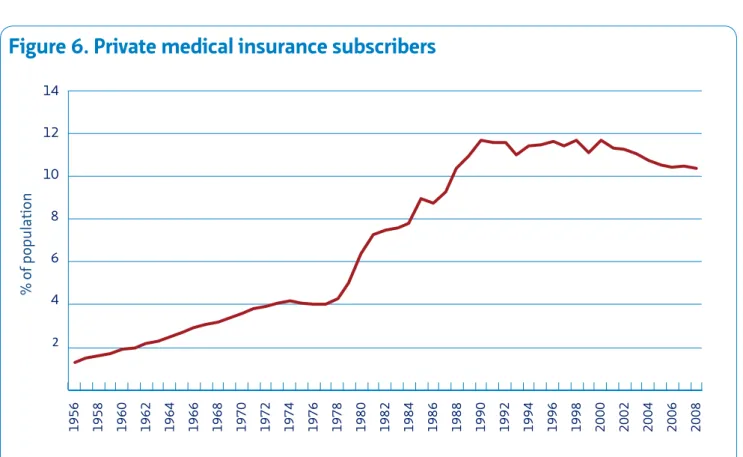
Any profits made through private work should, in theory, be recycled into NHS care and it could enable some providers to be less reliant on public income. However, this approach is limited by the UK public’s appetite for private health insurance which, while rising, is still relatively low (see Figure 6). This is linked to a widely-held sentiment that access to NHS services should be determined by need and not ability to pay. While raising the private patient income cap should not in itself undermine this principle, there is a potential risk that dedicating too large a percentage of services to treating private patients could give the appearance of NHS hospitals that are two-tiered.
Can we spend more?
As appealing and simple a prospect as it may seem, spending more on health is fraught with all kinds of potential drawbacks. Although the public appear to want health spending to increase, it is difficult to assess what this should be at the expense of.
2 4 6 8 10 12 14 1956 1958 1960 1962 1964 1966 1968 1970 1972 1974 1976 1978 1980 1982 1984 1986 1988 1990 1992 1994 1996 1998 2000 2002 2004 2006 2008
Figure 6. Private medical insurance subscribers
‘Efficiency’ is maximising resources in a way that extracts the greatest social benefit from them. In 2010 the Department of Health introduced QIPP – Quality, Innovation,
Productivity and Prevention – a programme to improve the quality of care the NHS delivers, while making up to £20 billion of efficiency savings. These savings are crucial given that public spending on health will remain flat in real terms until at least 2015. As a result, the NHS needs to find a way to meet the costs of growing demand – estimated at 2.2 per cent each year – while improving services, with the same money, year on year. QIPP is intended to support the NHS in doing more for less.35
Workforce costs
The biggest single cost to the NHS is its staff – over one million full-time equivalents (see Figure 7).36 The total NHS pay bill is around
£43 billion and employment costs account for almost 70 per cent of spending by provider trusts. Clearly, the NHS cannot exist without a team of doctors, nurses, managers and other staff, but in the context of finding efficiencies, it is important that workforce costs are
reassessed.
Savings linked to staff costs account for just under one third of the total savings achieved
Figure 7. Full-time equivalents employed in NHS hospitals and
community services
Source: Office of Health Economics, 201237
to date through QIPP.38 Many of these savings
have been made by a modest reduction in staff numbers, for example through vacancy control, or by limiting the amount spent on agency staff. Despite a two-year pay freeze, introduced in 2010, pay costs are not falling as fast as they might have done, due largely to the incremental salary growth linked to length of service – this is estimated to add around 2 per cent to the total annual NHS pay bill.39 The Government
is now recommending that pay increases for non-medical staff be limited to 1 per cent on average for the next two years, although it is estimated that this will still add between £400 and £500 million to NHS expenditure annually.40 Recent negotiations on pay, which
are agreed nationally by trade unions and employers, have approved linking incremental pay progression to performance.
Savings in staff costs could be achieved by tackling variations in sickness absence rates across the NHS. Sickness absence in the NHS is on average 10.7 days a year, compared to
9.7 days in the public sector as a whole and 6.4 days in the private sector.41 Evidence suggests
that trusts with better engaged staff enjoy lower rates of absenteeism (see case study below). An estimated £160 million has been saved so far through reduced levels of staff sickness, representing just over 2.5 per cent of the total QIPP savings to date.42
Procurement
The NHS buys goods and services in large volumes but, as individual organisations tend to procure services separately, it is almost certainly not maximising its collective purchasing power. Recent studies have shown variations in the price paid for around 66,000 products in the NHS.43 For example,
the amount paid for the same box of medical forceps ranged from £13 to £23, while the amount paid for an identical box of blankets ranged from £47 to £120.44 Increasingly, NHS
Case study. Staff engagement and absenteeism
Research by the Aston Business School studied the relationship between staff engagement and a number of key patient outcomes. Overall, the study found that trusts with higher staff engagement scored more positively for outcomes measures on patient satisfaction, financial governance and staff absenteeism.
High engagement trusts scored:
• on average, 80.86 per cent patient satisfaction (compared to 76.78 per cent for low engagement trusts)
• an average 3.18 CQC rating, out of 4, on financial management (compared to 2.86 for low engagement trusts)
• an average staff absenteeism rate of 4.04 per cent (compared to 4.68 per cent for low engagement trusts.
On staff absenteeism rates alone, higher staff engagement for a trust employing 3,000 full-time staff could equate to around £235,000 saved in salary costs each year.45
providers are collaborating to standardise their specifications in order to drive down prices from suppliers, and the Department of Health is developing a barcode system to help hospitals negotiate better prices.
In total, NHS procurement has been asked for around £1.3 billion of the £20 billion QIPP target.46 The National Audit Office has made
recommendations for saving £500 million – 10 per cent of total NHS consumables expenditure – through better procurement practices. It calculates that in some areas up to 30 per cent could be saved.47 Other
estimates suggest that between £2.3 billion and £3.7 billion could be saved recurrently through improved supply chain management and procurement.48 However, extending
the opportunity for greater savings will require a more widespread move towards standardisation – something that is difficult to achieve in a devolved NHS system.
Capital expenses
Capital expenses – a key cost factor for the acute sector in particular – might also be reduced. The NHS owns more than 25 million square metres of property and spends more than £6 billion on estates and ‘hotel’ services each year.49 Private finance initiative (PFI)
schemes, which established public–private partnerships to fund new public infrastructure projects, have sparked considerable debate. By 2010, there were 103 PFI schemes in place across England. Annual payment costs were over £1.2 billion in 2011/12, and are expected to rise to £2.3 billion per year by 2030 (see Figure 8).50 Attempts are being made to reduce
these costs, with ‘hit squads’ examining PFI contracts to identify savings. The likelihood, however, of PFI contracts being renegotiated in favour of NHS providers is limited, particularly given that the contracts are underwritten by the Treasury and so there is little incentive for
Figure 8. Estimated payments on current PFI projects
investors to make concessions in recouping their investment.52
Recently, the Treasury proposed a new finance scheme to replace PFI, called PF2, which is designed to be more transparent and would see the public sector act as a minority shareholder in future projects.53 The Department of Health
has also established a new company, NHS Property Services, that will own and manage large parts of the NHS estate in the primary care sector, estimated to be worth around £5 billion. Through this company, it is hoped that organisations will be able to drive greater efficiencies in managing their estates.
Can we do more for less?
There is certainly scope for the NHS to do more for less, and the last few years have shown that savings can be made by tackling inefficiencies. Unfortunately, NHS leaders are now questioning how sustainable this strategy is, with many suggesting that the early savings have been achieved by picking off easy targets.
The scope for ensuring sustainability appears limited when considered within the context of current service delivery. There is a growing consensus that services need to be transformed in a way that improves patient care, while also making them more efficient. Change is always difficult to implement, yet the current outlook indicates that change may be inevitable and redesigning services now to adapt to these pressures seems a better approach than having the changes imposed upon us.
Early intervention
The consequences of delaying change are already evidenced by a number of notable failures within the NHS. For example, South London Healthcare became the first NHS trust to enter administration and become subject to a new failure regime.54 Previously, the trust
was consistently struggling to provide services
within budget and had no approved plan to fix its problems in the long term.55 Lessons from
South London suggest that it is in the interest of patients that problems are dealt with as early as possible, and that there should be consideration of how the entire local health economy is served, not just those impacted by the provider in distress.56
Safe and secure
Ensuring services are safe for patients is the primary driver for change. Variations in quality are not just harmful for patients, they can also prove expensive if patients are not treated effectively. Many of the variations of quality that are apparent in the NHS can be attributed to poor system design. Changing the way that services are delivered might provide an opportunity to eliminate some of these differences (see case study below).57
Figure 9. Quality variation indicators in England, 2012
Quality indicator Highest rate Lowest rate
Avoidable hospital stays (by region) 31% 26%
Hospital standardised mortality ratio (by hospital) 121 70
Summary hospital-level mortality indicator (by hospital) 125 71
Seven-day readmission rate (by trust) 4.5% 2.2%
Short-stay admissions without a diagnosis (by trust) 21.6% 6.5%
Scheduled operations not performed (by trust) 5.7% 1.3%
Procedures of limited clinical effectiveness (by trust) 13% 1.7%
Excess bed day rate (by trust) 23% 4%
Use of day case surgery (by trust) 96% 78%
Outpatient appointments not kept (by trust) 15.6% 4.5%
Rate of PCI treatment for over-75s (by trust) 65% 0%
Ten common procedures performed at weekends (by trust) 16% 0.06%
Source: Dr Foster Intelligence, 201258
Publications such as the NHS atlas of variation
and the Dr Foster hospital guide59 highlight how
much service quality can vary within the NHS (see Figure 9).These variations are significant, particularly if a patient’s provider depends more on locality than on choice, as is often the case. Similarly, there is a considerable discrepancy between the quality of care in the NHS during the week and at weekends. The mortality rate for emergency treatment for certain vascular conditions is as much as 10 per cent higher for those admitted at weekends, and several medical teams have indicated that the most senior medical cover at night is a junior doctor in their first two years of training.60 A number of reports have also
argued that the standards necessary to ensure consistent and high-quality care throughout the week are not possible within current configurations, and that centralising services onto fewer sites will be needed.61
Effective and efficient
Services may need to be redesigned to ensure they remain effective and efficient, with reconfigurations or improved service delivery accounting for 20 per cent of planned QIPP savings.62 Some parts of the NHS indicate
that they are over-supplying their local population, while other providers are close to maximum capacity.63 If some services could
be rationalised, a local health economy might reach a more optimal level of supply across a larger geographic area. This is particularly the case for more expensive specialist services that benefit from being delivered more regularly at a central location.64
Traditional economic theory suggests that this could make services more productive, based on economies of scale and scope. Economies of scale suggest services are more efficient as output increases, while economies of scope
Case study. Successful service redesign – London stroke services
The UK is among the worst performers on treating strokes in Europe. Patients are almost twice as likely to die from stroke in the UK compared to France.67 To deal with these concerns in London, the number of units treating stroke was reduced, in the first instance from 32 hospital units to four major trauma centres and five hyper-acute stroke units (HASUs).68 These new units are staffed by specialists with rapid access to high-quality equipment, 24 hours a day, seven days a week.69 Smaller stroke units are used to support specialist treatment and provide intensive rehabilitation after patients have spent 72 hours in an HASU.
Clinical evidence shows that it is better to travel further to an HASU than to be stabilised by a local A&E and then transferred to a specialist unit. Early findings in London show some impressive improvements in stroke care, with an increase in the use of thrombolysis to a rate higher than any other major centre in the world.70
suggest they could be more efficient when a range of services are provided together. If applied to healthcare, this theory suggests that centralising some services could achieve efficiencies within an optimally-sized hospital. The evidence for achieving such economies in health services is not particularly strong, although a recent report commissioned by Monitor found at least some evidence to support it in some services.65
Modern and appropriate
Finally, changing the way services are delivered could help achieve the long-held NHS aims of delivering modern and appropriate services for patients. The needs of patients have changed considerably over the last 65 years, yet the way health services are delivered remains broadly the same. Consequently, the NHS appears most effective at dealing with episodic needs and finds it harder to treat patients with the long-term conditions which tend now to be more widespread today.
Many care pathways are currently designed in a way that can often be unnecessarily expensive and inconvenient – for example, fragmenting services. In the acute sector, nearly a third of hospital beds are taken by patients who might not have needed them if their care was
better managed.66 Successive governments
have continued to implement reforms to allow patients to be treated closer to their home and yet there still seems to be an over-reliance on large NHS hospitals, of the type described as ‘pyramids’ in the 1960s. Redesigning services in a way that better integrates the divide between primary and secondary care could focus services much more around the needs of patients, rather than buildings.
This could also deliver against another enduring objective – to better integrate technology into the way services are delivered. Innovations such as telecare have the potential to transform the way patients are treated in the NHS, while advancements in ‘e-health’ could allow patients to interact better with their health services and empower them more.
Can we do things differently?
Regardless of the rationale, plans to change services are often controversial with the public. Moves to amalgamate units have been, in some cases, negatively received and local loyalties to local services have tended to have a strong impact. As a result, it can be difficult to communicate the case for change in local services, even when there is a good clinical case for doing so.
Conclusion
Further information
All health systems across the developed worldface increasing demand and cost pressures. Ideally, we would prefer to manage these demands by encouraging a healthier society that has less immediate need to access healthcare. Doing so might mitigate the pressures imposed on the health system by demographics and the rising costs of developing and delivering modern healthcare services. However, the most foreseeable scenario for the NHS is one of tough times. Over the last decade, pressures on the NHS have commonly been met with increases in government spending. This is no longer an easy option. Instead, it is one of a number of tough choices that the NHS must consider for the future. So far, it has been generally accepted that doing nothing is not an option, and that the most appropriate response is to focus on achieving efficiency savings. However, this
The NHS Confederation’s work programme on Rising to the financial challenge:
www.nhsconfed.org/finance
NHS Confederation briefing issue 259: Tough times, tough choices: being open and honest about NHS finance.
choice is already developing into a progressively difficult challenge.
There is mounting evidence to support the need for redesigning services to unlock more sustainable efficiencies, while remodelling services around the needs of patients. This would make it possible to reduce the need for patients to be treated in the acute sector and allow them to be more appropriately cared for in their own communities. Making this choice and delivering this vision will not be easy and will not be achieved without public support, which has proved difficult to win.
None of the choices facing the NHS are without challenges or consequences, and all will need a serious and sensible public deliberation. This paper is intended to stimulate just such a debate.
For more information on the issues covered in this paper, contact paul.healy@nhsconfed.org
NHS Confederation factsheet: Tough times, tough choices: an overview of NHS finances. NHS Confederation factsheet: Tough times, tough choices: how does the NHS’ financial situation compare?
1. NHS Confederation (2012) Papering over the cracks: the impact of social care funding on the NHS.
2. “No let-up expected in NHS savings drive”,
Financial Times, 27 March 2012
3. NHS Confederation member survey 2012
4. Royal College of Physicians (2012)
Hospitals on the edge?
5. Commission on Dignity in Care for Older People (2012) Delivering dignity.
6. The Health and Social Care Information Centre (2012) Statistics on alcohol: England
and Statistics on smoking: England;
Government Office for Science (2012)
Tackling obesities: future choices.
7. Public Accounts Committee (2012)
Department of Health: The management of adult diabetes services in the NHS.
8. Diabetes UK (2012) State of the nation.
9. Mental Health Network (2012) Liaison psychiatry – the way ahead.
10. ibid.
11. Department of Health (2002) Securing our future health: taking a long-term view – the Wanless Report.
12. Department of Health (2004) Securing good health for the whole population.
13. HM Treasury (2010) Spending review 2010.
14. UK Statistical Authority (2012)
Correspondence from Andrew Dilnot to Rt Hon Andy Burnham MP.
15. National Audit Office (2012) Securing the future financial sustainability of the NHS.
16. Monitor (2012) NHS foundation trusts: review of three months to 30 June 2012.
17. National Audit Office (2012) Progress in making NHS efficiency savings.
18. Nuffield Trust (2012) NHS and social care funding: the outlook to 2021/22.
19. NHS Confederation (2010) Clinical responses to the downturn.
20. NHS Confederation (2010) Dealing with the downturn: using the evidence.
21. The King’s Fund (2012) Thinking about rationing.
22. Department of Health (2012) Market oversight in adult social care.
23. NHS Confederation member survey 2012
24. Monitor (2012) FT directory; Care Quality Commission (2012) CQC checks.
25. Institute for Fiscal Studies (2011) The changing composition of public spending.
26. Nuffield Trust (2012) NHS and social care funding: the outlook to 2021/22.
27. OECD Health Data 2012: Total expenditure on health, % GDP.
28. Institute For Fiscal Studies (2012) Paul Johnson presentation to Reform ‘Rising to the Nicholson Challenge’ conference.
29. The Health and Social Care Information Centre (2012) Number of prescription items.
30. Prescription Charges Coalition (2009)
Written evidence to Professor Ian Gilmore’s Prescription Charges Review.
31. Office of Health Economics (2012) NHS sources of finance, 1949–2009.
32. Thomson et al (2010) Can user charges make health care more efficient?
33. Rückert et al (2008) Are German patients burdened by the practice charge for physician visits (‘Praxisgebuehr’)?
34. Office of Health Economics (2012) NHS sources of finance, 1949–2009.
35. Office for Budget Responsibility (2012)
Fiscal sustainability report.
36. NHS Information Centre (2012) NHS Staff 2001–2011 overview.
37. Office of Health Economics (2012) Number of full-time equivalent staff employed in NHS hospitals and community services.
38. Health Select Committee (2012) Uncorrected transcript of oral evidence (13/11/12).
39. NHS Employers (2012) Submission to the NHS Pay Review Body.
40. King’s Fund (2012) How is the NHS performing? Quarterly monitoring report.
41. NHS Employers (2011) Generating savings by improving health and wellbeing:
experiences in NHS trusts.
42. Health Select Committee (2012) Uncorrected transcript of oral evidence (13/11/12).
43. National Audit Office (2011) The
procurement of consumables by NHS acute and foundation trusts.
44. ‘Consultants warn care hit by poor deals on supplies’, BBC News, 19 December 2012
45. Department of Health (2010) Staff engagement: making a difference within your organisation.
46. Public Accounts Committee (2011) The procurement of consumables by NHS acute and foundation trusts.
47. ibid.
48. McKinsey (2009) Achieving world class productivity in the NHS 2009/10–2013/14: detailing the sizing of the opportunity.
49. ‘Solutions from new sources’, Health Service Journal, 27 October 2011
50. Deposited Paper DEP210-1307, House of Commons Library.
51. UK Treasury (2012) PFI data, taken from
Guardian Datablog ‘PFI contracts: the full list’ 5 July 2012.
52. Public Accounts Committee (2012) Minutes of Evidence (18/09/12).
53. HM Treasury (2012) Autumn Statement 2012.
54. The King’s Fund (2012) Dealing with financially unsustainable providers.
55. Office of Trust Special Administrator (2012)
Securing sustainable NHS services.
56. NHS Confederation (2012) All systems go.
57. NHS Confederation (2004) Variation in healthcare.
58. Dr Foster Intelligence (2012) Dr Foster Hospital Guide 2012.
59. Dr Foster Intelligence (2012) Dr Foster hospital guide 2012; NHS Right Care (2011)
NHS atlas of variation 2011.
60. Dr Foster Intelligence (2012) Deaths on weekends significantly higher for vascular conditions; Royal College of Physicians (2012) Hospitals on the edge? The time for action.
61. Academy of Medical Royal Colleges (2012)
Seven day consultant present care; Royal College of Paediatrics and Child Health (2011) Facing the future; Royal College of Surgeons (2013) Reshaping surgical services: principles for change.
62. Health Select Committee (2012) Uncorrected transcript of oral evidence (13/11/12).
63. ‘The NHS has too many hospitals – something’s got to give’, Health Service Journal, 30 September 2010.
64. ‘Standards suffer when children’s services are fragmented’, Health Service Journal, 16 November 2012.
65. Monitor (2012) Economies of scale and scope in healthcare markets.
66. Dr Foster Intelligence (2012) Dr Foster hospital guide 2012.
67. Healthcare for London (2009) The shape of things to come.
68. The Royal College of Surgeons of England (2013) Reshaping surgical services.
69. The King’s Fund (2011) Improving health and healthcare in London.
70. The Royal College of Surgeons of England (2013) Reshaping surgical services.
The NHS is in an unprecedented financial
predicament. Demand for healthcare continues to grow at a rate that current funding will struggle to match. We have so far avoided the conversation needed with the public about how the NHS should confront these pressures.
This report addresses this ‘missing dialogue’ by being open and honest about NHS finances and the tough choices ahead. It sets out the choices which need to be considered as part of the effort to guarantee the delivery of safe, effective and sustainable health services in the years to come.
Alternative formats can be requested from:
Tel 0870 444 5841 Email publications@nhsconfed.org or visit www.nhsconfed.org/publications
© The NHS Confederation 2013. You may copy or distribute this work, but you must give the author credit, you may not use it for commercial purposes, and you may not alter, transform or build upon this work.
Registered Charity no: 1090329
Stock code: BOK60063
The NHS Confederation
50 Broadway London SW1H 0DB Tel 020 7799 6666
Email enquiries@nhsconfed.org www.nhsconfed.org
Follow the NHS Confederation on Twitter: @nhsconfed