County of Los Angeles Chief Executive Office Service Integration Branch
Project 50:
The Cost Effectiveness of the Permanent Supportive Housing Model
in the Skid Row Section of Los Angeles County
Research and Evaluation Services
Halil Toros Max Stevens Manuel Moreno Principal Investigator June 2012
i
Preface
A growing body of research literature demonstrates that the provision of housing to chronically homeless populations provides a critical foundation from which to address problems in the areas of physical health, mental health and substance abuse. A consensus is also emerging among researchers to the effect that the permanent supportive housing model – in which chronically homeless individuals are provided with housing as well as services and intensive case management – is not only humane but also fiscally prudent insofar as it tends to be considerably less expensive than what takes place when homeless persons are left on the streets and forced to address their health and substance abuse problems through emergency systems of care, and in a fragmented fashion. The present report evaluates Project 50, a Board of Supervisors demonstration project that provides housing and integrated services to some of the most vulnerable, chronically homeless adults living in the Skid Row section of Los Angeles. The program offers policymakers a test case of the viability of the permanent supportive housing model in Los Angeles County. The bulk of this report looks at Project 50 from the standpoint of a cost avoidance analysis and shows that, between 2008 and 2010, the program not only saved the County money but actually yielded a surplus. While $3.045 million was invested in Project 50, the program yielded cost savings of $3.284 million over the two-year observation period, a surplus of $238,700, or $4,774 per occupied housing unit over two years (an occupied housing unit refers to one housing unit occupied by one person). Mental health and substance abuse treatment costs increased for the program’s participants, primarily because acute problems in these areas had remained largely unaddressed prior to the admission of participants to Project 50, but these increases were more than offset by savings in the areas of incarceration and medical services. In an effort to add qualitative information to the cost savings results and gain a better understanding of Project 50’s functionality and the effectiveness of its homelessness prevention methods, this report additionally features the results of focus group interviews conducted with participants and program staff. The qualitative results highlight the practices that have enabled the program to generate such dramatic cost savings results, showing that Project 50 is proactive and responsive in creating the basic conditions necessary for persons with severe barriers and long histories of life on the streets to begin to achieve greater self-sufficiency and stability. Taken together, the cost savings and qualitative results paint a picture of an efficient and effective approach to the problem of homelessness, one that is well worth replicating in other parts of Los Angeles County.
Manuel H. Moreno, Ph.D. Director of Research,
Research and Evaluation Services
ii
Acknowledgements
First and foremost, the Board of Supervisors must be acknowledged for their support in this critical demonstration project, especially Supervisor Yaroslavsky and his Homelessness and Mental Health Deputy Flora Gil Krisiloff. This project would not have happened, but for Supervisor Yaroslavsky’s determination to reduce barriers and to house the most vulnerable chronically homeless individuals.
The following agencies have been vital partners in the establishment and/or continued implementation of Project 50:
Los Angeles County Board of Supervisors
Los Angeles County Department of Mental Health Los Angeles County Department of Health Services Los Angeles County Department of Public Health
Los Angeles County Substance Abuse Prevention and Control Los Angeles County Department of Public Social Services Los Angeles County Sheriff’s Department
Los Angeles County Probation Department Los Angeles County Public Defender
Los Angeles County Community Development Commission Los Angeles Homeless Services Authority
Los Angeles County Chief Executive Office Housing Authority City of Los Angeles Los Angeles Police Department Common Ground
Veterans Administration of Greater Los Angeles Health Care System Skid Row Housing Trust
JWCH Institute, Inc. Didi Hirsch
Public Counsel
Los Angeles County Counsel Office of the City Attorney Volunteers of America
City of Los Angeles Mayor’s Office Courts
The following individuals must be commended for their past and current dedication and leadership of Project 50:
Flora Gil Krisiloff Alisa Belinkoff Katz Mary Marx
Al Ballesteros Mike Alvidrez Itohan Oyamendan
iii Shannon Parker
Paul Gregerson Ruth Ann Markusen Vicki Nagata LaCheryl Porter Libby Boyce Kathy House Lari Sheehan Connie Sullivan Carrie Bach John Snibbe Cheri Todoroff Tony Hill Joo Yoon Teri Long Molly Rysman Carlos VanNatter Judith Lillard Jeanette Rowe Rodney Sexton Paul Sacco Tony Beliz Julie Rivas-Castaneda
The following past and current staff have kept Project 50 operating with compassion, integrity and conviction:
Anh Tran Current staff Wendy Roberts Keiko Kondo Jed Schipper Martin Vuong Erica Tumbaga Rachel Karman Maria Euceda Francisco Tellez Carole Hughes Shirley Williams David Roberti Marlene Licardie Elia Hernandez Richard Newson Vimal Singh
iv Alma Juan Past staff Lisa LaRose Chris Tower Cathy Sammons Don Hashima Gilbert Mascorro John Dennem Viviana Ponce YoungAi Lee Meggan Gibson Adrienne Gee Sharon Kidd Meri L. Harrison Derek Hsieh Virginia Payes Doris Starling Melanie Dixon Sonny Ervin
Research and Evaluation Services would like to thank Dennis Culhane, Ph.D., of the University of Pennsylvania for his invaluable counsel and guidance on this report, in addition to John Horton, Ph.D., University of California, Los Angeles and Linda Shaw, Ph.D., University of California, San Marcos, for their work on this report.
v
Table of Contents
Preface ... i Acknowledgements ... ii Table of Contents ... v Key Findings ... 1 Introduction ... 2The Fiscal Significance of Los Angeles County’s Homeless Crisis ... 2
Housing the 50 Most Vulnerable Homeless People on Skid Row ... 2
A Homeless Registry and the Common Ground Vulnerability Index ... 3
Recruitment, Staffing, and the Provision of Integrated Supportive Services ... 3
The Permanent Supportive Housing Model ... 5
Evaluating Project 50 ... 5
Project 50 and Cost Avoidance ... 5
Data and Methodology ... 6
Study Populations ... 6
Data... 7
Methodology and Study Time ... 7
Qualitative Findings on Program Effectiveness ... 8
Before-and-After Comparison of the Program Group ... 9
Incarceration Costs ... 9
Medical Costs ... 10
Mental Health Treatment Costs ... 10
Alcohol and Drug Abuse Treatment Costs ... 11
Average Costs per Occupied Housing Unit for all Services ... 11
Before-and-After Comparison of the Program and Comparison Groups ... 12
Comparison of Incarceration Costs ... 12
Comparison of Medical Costs ... 13
Comparison of Mental Health Treatment Costs ... 15
Comparison of Substance Abuse Treatment Costs ... 16
Overall Cost Offsets ... 17
vi
Total Cost Offsets ... 20
Qualitative Findings ... 21
Consistent and Comprehensive Services ... 21
Effective Treatment of Health Problems ... 22
Improved Self-Esteem and Integration into Society ... 23
Project 50: A Program that Yields a Surplus while also Preventing Homelessness ... 24
Tables and Figures Table 1. Total Costs for 50 Occupied Housing Units for all Services ... 11
Figure 1. Average Costs per Occupied Housing Unit by Service for the Program Group over Four Years ... 9
Figure 2. Average Annual Incarceration Costs per Occupied Unit for Program and Comparison Groups between Pre- and Post-Program Years ... 13
Figure 3. Average Annual Medical Costs per Occupied Unit for Program and Comparison Groups between Pre- and Post-Program Years... 14
Figure 4. Average Annual Mental Health Treatment Costs per Occupied Unit for Program and Comparison Groups between Pre- and Post-Program Years ... 16
Figure 5. Average Annual Substance Abuse Treatment Costs per Occupied Unit for Program and Comparison Groups between Pre- and Post-Program Years ... 17
Figure 6. Average Annual Service Costs and Cost Savings per Occupied Unit for Program and Comparison Groups between Pre- and Post-Program Years ... 18
Figure 7. Annual Cost Savings per Occupied Unit for All Services in Project 50 during the first Program Year ... 19
Figure 8. Total Cost Savings for 50 Occupied Unit for All Services in Project 50 during the two Post- Program Years ... 21
1
Key Findings Presented in this Report
Over this report’s two-year study period, Project 50 yielded total cost offsets of $3.284 million, which is 108 percent of the money the program actually spent ($3.045 million) in providing its participants with services and housing. Project 50 therefore returned to the County more than the amount invested in the program, generating a surplus of $4,774 per occupied unit over two years (an occupied housing unit refers to one housing unit occupied by one person).
A comparison of incarceration costs for Project 50’s participants with those of a demographically similar group of homeless adults who did not participate in the program reveals that, while incarceration costs declined by 28 percent for those in Project 50 after their first year in the program, costs increased by 42 percent over the same period for the group of non-participants. Put differently, the comparison group tended to cost more over time while incarcerated, whereas Project 50 participants reduced their incarceration episodes significantly.
Medical costs for both the Project 50 group and the comparison group declined over the two-year period over which they were observed. However, these costs declined much more steeply for the Project 50 group. Medical costs over this period declined by 68 percent for Project 50 participants, versus a decline of only 37 percent for the comparison group.
Mental health treatment costs for Project 50 participants increased by 367 percent over the two-year period in which they were observed in relation to the comparison group. Mental health treatment costs for the comparison group increased by 200 percent over the observation period. The larger increase for the Project 50 group may indicate that prior to entry in the program, Project 50 participants had unaddressed mental health issues and after entry in the program they had greater access to mental health treatment.
Substance abuse treatment costs increased for the Project 50 group over the first year of program participation relative to the year prior to participation, but these rising costs were less than the substance abuse service cost increases for the comparison group over the same period. While these costs increased by 60 percent for the Project 50 group, costs almost doubled for the comparison group, from $1,997 to $3,961 per occupied housing unit between the pre- and post-program years. As is the case with mental health treatment costs, the rising costs of substance abuse treatment for Project 50 participants was likely a function of problems that were unaddressed prior to their admission to the program.
Cost increases in the areas of mental health and substance abuse treatment for the Project 50 group were more than offset by savings in the areas of incarceration and medical services. These offsets yielded a total surplus for the program of $238,700 over the two-year observation period, which translates into a $4,774 surplus per occupied housing unit.2
Introduction
The Fiscal Significance of Los Angeles County’s Homeless Crisis
The purpose of this report is to provide the Los Angeles County Board of Supervisors with information on the cost effectiveness of Project 50, a program created by action of the Board and funded by the County’s Homeless Prevention Initiative (HPI). Project 50 provides housing and integrated supportive services to the most vulnerable homeless adults previously living on the streets of Skid Row in downtown Los Angeles. While the goals of the program are first and foremost humanitarian, its development and implementation in Los Angeles County also signals the Board’s recognition that homelessness has become a serious fiscal problem insofar as homeless individuals tend to be heavy users of County services, cycling in and out of emergency rooms, substance abuse clinics, mental health facilities and jails, often receiving duplicative care in the process, and drawing on public resources each time they utilize the services these institutions and agencies provide. A key policy question that must be addressed, particularly given the fiscal challenges currently facing Los Angeles County, is the extent to which participation in Project 50 offsets the utilization of expensive public services. Put differently, does investment in Project 50 yield an avoidance of larger service costs? The present report provides the Board with an evidence-based picture of the fiscal return the County has received from its investment in Project 50, and shows that the program yielded cost offsets of about $3.284 million over two years. This is money that would have been spent on services if the program were not in place. Project 50 therefore returns to the County more than the amount invested in the program, yielding 108 percent of the costs that would have been needed to provide its participants with emergency non-stabilizing services. The program accomplished this while also providing the participants with housing and needed supportive services. Moreover, the service utilization patterns of Project 50 participants suggest that the cost savings in the following years would be larger.
Project 50 originated in a conference on regional homelessness convened by Supervisor Yaroslavsky (Third District) in October, 2007, and attended by, among others, national experts on homelessness, staff and administrators working on homelessness issues within County departments, representatives of the City of Los Angeles, and representatives from the United Way of Greater Los Angeles. Following on discussions at the conference, Supervisor Yaroslavsky authored a motion which was approved unanimously by the Board of Supervisors on November 20, 2007 directing the Chief Executive Office (CEO) to coordinate the implementation of Project 50, a two-year demonstration project with a total budget of $3.6 million.1
Housing the 50 Most Vulnerable Homeless People on Skid Row
In a November 21, 2007 letter to the directors of the principal departments participating in Project 50, the County’s CEO described the program as one that would seek to,
1
The actual expenditures on the project over two years are estimated to be slightly over $3 million. This will be discussed in Section VI of this report.
3
“identify, engage, house and provide supportive services to the 50 most vulnerable, long-term chronically homeless adults living on the streets of Skid Row.” 2 Conceptually, Project 50’s strategy of prioritizing persons living on the streets the longest and who have the most debilitating physical and mental health issues is borrowed from Common Ground of New York’s innovative Street to Home Project, which has enjoyed measurable success since the 1990s, both in terms of a reduction in homelessness within specifically demarcated areas of New York City, and in terms of cost savings yielded through a reduction in public service utilization for those who have been provided with housing and targeted supportive services.3
A Homeless Registry and the Common Ground Vulnerability Index
Project 50 initially relied on the “Common Ground Vulnerability Index” in its selection of the 50 most vulnerable homeless persons who would be offered housing and services through the program. After receiving training from experts from Common Ground of New York, an outreach team of workers from the Departments of Health Services (DHS), Mental Health (DMH), Public Health (DPH), and Public Social Services (DPSS) fanned out over the streets of Skid Row between the hours of 4:00 am and 6:00 am during the course of 12 days starting in December 2007. The outreach team developed an initial count that was to be used for the creation of a registry of homeless persons living on Skid Row. The persons counted for the registry were photographed and interviewed using the Common Ground Vulnerability Index instrument, which featured a series of variables designed to enable staff to quantify the degree of an individual’s physical and mental vulnerability, and to determine those who are most at risk of serious injury, illness, and death. The November 21, 2007 memo from the CEO explains that the index scores “give weight to the length of homelessness, time spent on the streets of Skid Row, and health and mental health status in the selection of Project 50 participants.”
Recruitment, Staffing, and the Provision of Integrated Supportive Services
Once the registry was created and the vulnerability scores generated, the outreach team returned to Skid Row to invite the 50 persons with the highest vulnerability scores to participate in Project 50. Finding and housing these individuals was frequently less than a straight-forward process as many homeless persons cycle in and out of clinics, jails, and shelters, while others are simply itinerant, meaning that there is no guarantee they will be found in the same location on the streets where they were initially identified and counted.
2
Los Angeles County, letter to Bruce Chernof, Director, DHS; Marvin Southard, Director, DMH; Jonathan Fielding, Director, DPH; Philip Browning, Director, DPSS; from William T Fujioka, Chief Executive Officer. “Project 50: Skid Row Demonstration Project for Chronic Homeless.” November 21, 2007.
3
Details of results Common Ground has achieved through its Street to Home Project can be found in press releases and reports available at:
4
Adding to the challenges involved in recruiting participants, there was typically a large volume of procedural work required in advance of providing housing and services to a population composed largely of people whose officially recorded lives needed to be reconstructed, often from scratch. Each Project 50 participant was required to provide signed consent, and then they were asked, with the help of the outreach team, to complete intake checklists that included obtaining birth certificates and Social Security cards, as well as completing lengthy housing applications, health and substance abuse assessments, and probation and veteran status reports. Providing this information usually involved multiple appointments with various agencies and offices. In summarizing the status of Project 50 after 90 days for the Board of Supervisors, the CEO explained that, “Many of the necessary documents can take a long time to obtain, especially if they are ordered from out of state (e.g. birth certificates), lengthening the average time to house a client to 22 days.” 4 For these reasons, it took approximately one year for Project 50 to be fully subscribed. However, after 18 months the program had housed a total of 59 people, 51 of which remained housed, a retention rate of more than 86 percent.5
Project 50 has involved the work of 24 partnering agencies and organizations. In January 2008, the Board of Supervisors approved the appointment of a Project 50 Director and administrative staff, as well as an outreach and advocacy team and an integrated supportive services team. The outreach and advocacy team, composed of staff from DMH, DPSS, the Los Angeles Homeless Services Authority (LAHSA), and the Regional Veterans Administration, is responsible for engaging participants in needed services, transporting them to appointments, assisting with the completion of documentation, and placement of participants into housing.6 The integrated services team consists of employees from County departments as well as contracted staff, counselors and clinicians from community housing, health and mental health clinics. The department employees are from DHS, DMH, DPSS and the contracted staff are from the Skid Row Housing Trust, Didi Hirsch and the John Wesley Community Health (JWCH) Institute. The integrated services staff is charged with the provision of case management, maintenance of housing, benefit counseling, and the provision of physical, mental health, and substance abuse services.7
4
Los Angeles County, letter to the Board of Supervisors from William T Fujioka, Chief Executive Officer. “Ninety-Day Report Regarding Implementation of Project 50.” May 27, 2008.
5
Los Angeles County, letter to the Board of Supervisors from William T Fujioka, Chief Executive Officer. “Los Angeles County Homeless Prevention Initiative Status Report.” April 29, 2010.
6
The January 8, 2008 Board Letter on the implementation of Project 50 from the CEO states that, “The role of the Outreach and housing Advocates Team is to build relationships with the Project 50 Anchors [participant leaders] and work to connect them with benefits they qualify for including health, mental health, and substance abuse treatment services while also convincing the Anchors of the benefits of leaving the streets and entering permanent housing.”
7
The January 8, 2008 Board Letter on the implementation of Project 50 from the CEO states that, “The role of the Integrated Support Services Team is to ensure that the Project 50 Anchors receive ongoing supportive services, including health, mental health, substance abuse, and related life support services and benefits.”
5
The Permanent Supportive Housing Model
This report covers the period from 2008 through 2010. For the bulk of this time, Project 50 participants were housed in four single room occupancy hotels located in the Skid Row area and owned and managed by the Skid Row Housing Trust. Three of the hotels - the Sanborn, the Pershing, and the Senator - are located on South Main Street. The fourth hotel, the Weldon, is located on Maple Avenue. The program has adopted a permanent supportive housing model in integrating the provision of housing and services to its target population. In terms of on-the-ground practice, this means that participants are housed as the first step. Once housed, they are provided with services for mental health, physical health, and substance abuse. The Housing First model is premised on the theory that housing provides an initial foundation and source of basic stability without which efforts at recovery and rehabilitation cannot be enduringly successful.
Evaluating Project 50
This report looks at the patterns and frequency of service utilization among Project 50 participants and the cost savings yielded through their participation in the program. Additionally, the quantitative analyses offered in the sections that follow are complemented in the conclusion to this report by qualitative findings on the program’s effectiveness based on interviews with Project 50 participants and the program staff serving them.
Project 50 and Cost Avoidance
Project 50 offers permanent supportive housing to homeless adults, most of whom have been heavy users of public services in the past, repeatedly cycling in and out of emergency rooms, health facilities, shelters, jails, and clinics for physical and mental health problems and substance abuse issues. Many of these services are provided through County agencies, which incur substantial costs in providing homeless individuals with the care they require. Alongside Project 50’s humanitarian goals of improving the lives of some of the most vulnerable homeless adults living in Skid Row are the program’s fiscal goals of offering supportive housing (including integrated supportive services) as a means of avoiding the larger costs resulting from the fragmented and costly emergency utilization of County services when these individuals are attempting to survive on the streets. A number of researchers have demonstrated the cost offsets and service efficiencies that can be yielded with the proper integrated deployment of housing, supportive services, and intensive case management for homeless adults suffering with varied combinations of physical health problems, substance abuse issues, and mental illness. The Economic Roundtable estimates, for example, that supportive housing yields cost savings of 79 percent in housing homeless
6
persons in Los Angeles when compared to what these persons cost in public expenditure if these persons are not housed.8
This study specifically assesses the extent to which Project 50 has yielded cost savings for the County of Los Angeles by comparing the service utilization patterns of the program’s participants with the patterns of a similar group of adults who did not participate in the program. Put differently, the study addresses the issue of whether and to what degree the program enabled the County to provide the same necessary care in a more appropriate manner, using fewer resources than is the case when individuals cycle in and out of emergency systems of care. The answer to this question takes on critical importance within the current budgetary and economic environment. The results of the cost avoidance analysis, along with the qualitative results summarized in the conclusion of this report, will give the Board of Supervisors and policymakers a sense of the success of the Project 50 model as a cost avoidance strategy and of its effectiveness in providing housing and care to vulnerable and chronically homeless adults.
Data and Methodology
Study Populations
The Research and Evaluation Services (RES) unit evaluated the efficiencies and cost savings attributable to Project 50 through analyses of two groups of homeless adults. The first group, which can also be referred to as the ‘program group,’ consists of the 50 Program participants (a) who moved into Project 50 housing during 2008 and 2009, (b) for whom RES was able to gather adequate identifying information to match against the datasets of various County agencies, and (c) who did not die during their time in the program.9
The second group, which is referred to here as the ‘comparison group,’ consists of the 46 adults (a) who were surveyed and assigned a vulnerability index score during December 2007, (b) for whom RES was able to gather adequate identifying information to match them against at least one other agency dataset during the study period, and
8
Flaming, Daniel, et al. Where We Sleep: Costs When Homeless and Housed in Los Angeles. Economic Roundtable. 2009. 23. Also see: Culhane, Dennis P. “The Cost of Homelessness.” European Journal of Homelessness, 2.1. 2008. 97-114; Culhane, Dennis P. and Stephen Metraux. “Rearranging the Deck Chairs or Reallocating the Lifeboats? Homelessness Assistance and its Alternatives.” Journal of the American Planning Association.74.1. 2008.111-121; Culhane, Dennis P., Stephen Metraux and Trevor Hadley. “Public Service Reductions Associated with Placement of Homeless Persons with Severe Mental Illness in Supportive Housing.” Housing Policy Debates. 13.1, 2002. 107-163; Gilmer, Todd P., Wilard G. Manning, Susan L. Ettner. “A Cost Analysis of San Diego County’s REACH Program for Homeless Persons.” Psychiatric Services. 60.4. 2009.445-450; Marinez, Tia E. and Martha Burt. “Impact of Permanent Supportive Housing on the Use of Acute Care Health Services by Homeless Adults.”
Psychiatric Services. 57.7, 2006, 992-999; Sadowski et al. “Effect of a Housing and Case Management Program on Emergency Department Visits and Hospitalizations Among Chronically Ill Homeless Adults: A Randomized Trial.” Journal of the American Medical Association.301.17, 2009. 1771-1778.
9
7
(c) who did not participate in Project 50. Some of these adults refused to participate and some could not be re-tracked later to be included in the calculations, while half were not in the first round of selected Project 50 participants. The comparison group of adults have a similar age and gender distribution as the program group but on average had lower vulnerability scores as measured by the vulnerability index referenced above, which explains why many of them did not get selected in the first round of Project 50 participants. The groups are also similar in terms of their histories of County service utilization in general.
Data
The data used in this study come from administrative databases maintained at four different agencies that are heavily used by homeless adults in Los Angeles County. These databases are collected in computerized management information systems and track service utilization over time. Administrative data from DHS, DMH, DPH, and the Sheriff’s Department are used to assess the aggregate level of service use prior to and after program participation for the study and comparison groups. These databases were accessed using de-identified linkage keys of common identifiers: first and last names, sex, dates of birth, and Social Security number.10 Cost data for these departments were either included in the datasets or average annual cost figures provided by the departments were used.
DHS costs cover all inpatient stays and outpatient and emergency visits made by the two study groups at County hospitals and clinics, as well as outpatient visits to Public-Private-Partnership (PPP) Program clinics. DMH costs almost exclusively include outpatient visits. The most common mental health treatment services are targeted case management, case consultation, acute general hospital, crisis stabilization in emergency rooms, rehab services, psychological diagnosis services, individual and group therapies, and brief medical visits. DPH costs for substance abuse treatment covers detox, residential, outpatient and day care services. Finally, incarceration costs include booking, daily maintenance, and medical services, which include both physical and mental health treatment.
Methodology and Study Time
This report addresses cost savings questions in two ways. First, the analysis compares the service utilization patterns and costs for the program group before and after participation in the program. Two years of data before and two years after moving into Project 50’s permanent supportive housing (PSH) were measured and compared. Since eleven participants stayed in Project 50 for one year, post-program average costs
10
RES conducted the data linkages for this study using its Adult Linkages Project data integration and matching technology and methodology.
8
are adjusted to reflect average costs per occupied housing unit, per year (an occupied housing unit refers to one housing unit occupied by one person).11
However, limiting the analysis to Project 50 participants cannot answer the main question of what the frequency and intensity of service utilization would have been in the absence of the program. Would the individuals in the program group have used services with more or less frequency if they did not participate in the program? Addressing this question requires an analysis of a comparison group consisting of individuals similar to those in the program group who did not participate in the program. Additional analysis was therefore conducted using a design in which pre- and post-program service costs for the post-program group were compared with service utilization costs for a comparison group of demographically similar homeless individuals who did not participate in Project 50 over the study period. Cost savings were estimated by comparing the pre-program and post-program costs for the two groups.
The comparison of the program and comparison groups covers four years. Starting from the move-in date, the next two years are referred to as post-program years one and two.12 The pre-program/post-program analysis of the comparison group covers only two years, one pre-program and one post-program year, since the data for the comparison group is not available for the second year.13
All average cost figures reflect average service costs per occupied housing unit, and per year. Total cost savings reflect the total savings for 50 occupied housing units.
Qualitative Findings on Program Effectiveness
The conclusion to this report includes a brief discussion of additional qualitative findings on Project 50’s integrated combination of housing, case management and supportive services. The human impact of the program on its participants could not be told by reference to numbers and administrative data alone. Therefore, in addition to summarizing the results of the cost avoidance analysis, the conclusion to this report presents the results of ethnographic observation and interviews conducted with participants, program staff and administrators between February 2009 and August 2010.
11
Using the occupied housing unit as the unit of analysis (‘per occupied housing unit’) enables cost calculations to be annualized and standardized in a way that would not be possible if the participant were used as the unit of analysis because participants exit the program at varied points in time and are replaced by new participants. An analysis of cost offsets per occupied housing unit shows the savings yielded by the housed unit.
12
Since the move-in dates are different for all participants, the pre- and post-program years reflect different periods of time for the program group. For the comparison group, the program year starts in January 2008, which is just after the original vulnerability survey was made.
13
Due to the high level of attrition among members of the comparison group over time, the study was not designed for a two-year, pre-post comparative analysis. For this reason, the second post-program year service utilization data was not collected for the comparison group.
9
Before-and-After Comparison of the Program Group
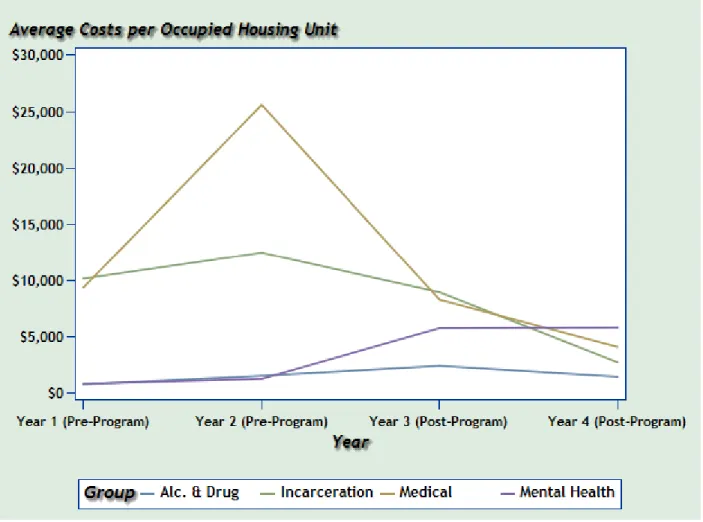
In this section, changes in the patterns and costs of service utilization are observed and analyzed for the program group over a period of four years (two pre-program and two post-program years). Figure 1 summarizes the average service costs per occupied housing unit, per year, over four years for the program group participants. Different patterns of service utilization are observed in Figure 1 as elaborated below. While incarceration and hospital services dropped drastically after participation in Project 50, mental health treatment costs increased.
Figure 1. Average Costs per Occupied Housing Unit by Service for the Program Group over Four Years
Incarceration Costs
The data indicate that the program group’s average incarceration costs were slightly over $10,000 two years before participants entered the program (year 1) and continued to increase to over $12,000 during the year before entry (year 2). During the first
10
post-program year (year 3), average incarceration costs dropped below $9,000, and by the second post-program year (year 4) the average costs fell to below $3,000. Average incarceration costs dropped significantly because the number of incarcerated program group participants fell from 24 to 5 over two years. The yearly average days of incarceration per participant also dropped from 31 days to 9 days.
Medical Costs
The data show that average medical costs for the program group were over $9,000 two years prior to entry into Project 50 (year 1) and then almost tripled, exceeding $25,000 during the year prior to entry (year 2). This dramatic increase indicates that the health conditions of these participants were generally very poor before they joined Project 50 and this likely contributed to their selection by the Vulnerability Index. However, over the first year after entry into the program (year 3), average health costs dropped significantly to just over $8,200, and by the second post-program year (year 4) the average costs decreased by more than half to $4,000.
Medical costs include the costs of services received not only from DHS hospital facilities but also through the PPP Program, where private, community-based partners provide outpatient health services. The share of costs incurred through JWCH (which was the PPP clinic providing medical services for Project 50) was negligible before program participation. However, during the first year of the program, Project 50 participants used these clinics heavily, with the number of visits increasing, from 99 to 474. PPP visits dropped to 84 during the second year of the program. When both hospital and clinic service utilizations are included in the calculations, the number of program participants receiving health services did not change between the period before and the period after program participation.14
The significant drop in hospital costs is due to a substantial decrease in hospital admissions after participants entered into Project 50. In addition, JWCH replaced high-cost medical services provided through hospitals with less costly care provided through clinics on an outpatient basis. This finding underscores the cost saving advantages in engaging participants with PPP services as rapidly as possible.
Mental Health Treatment Costs
The data show that average mental health treatment costs were very low – around $1,200 per occupied unit – prior to program participation. However, during the first year after entry into Project 50 (year 3), the program group engaged in intense mental health treatment that continued into the second post-program year (year 4). For this reason, the average annual mental health services costs per occupied unit increased drastically and almost reached $6,000 during the first post-program year (year three), and stayed at the same level in the second year of participation (year 4). The number of program participants who received mental health services rose from 25 to 40 after their
14
The number of participants receiving health services actually increased slightly from 28 to 32 during year 3 and then dropped to 15 in year 4.
11
engagement with the program. This result could be due to a lack of appropriate and needed mental health treatment prior to admittance into Project 50.
Alcohol and Drug Abuse Treatment Costs
The data indicate that the program group’s average annual alcohol and drug abuse treatment costs per occupied unit doubled from over $700 to more than $1,400 during the two pre-program years (year 1 and year 2). During the first post-program year (year 3), average costs rose to over $2,300, and by the second post-program year these costs fell back to $1,400 per occupied unit. The numbers therefore show that, in joining the program, participants were engaged in alcohol and drug abuse treatment at a higher rate than was the case during the period prior to program participation. However, substance abuse treatment services dropped by the second post-program year (year 4). The number of program participants who received alcohol and drug abuse treatment services increased from 25 to 40 and then dropped back to 25 over two years of program participation. The annual average days in alcohol and drug abuse treatment increased from 10 to 18 days and then declined to 9 days in the same period.
Average Costs per Occupied Housing Unit for all Services
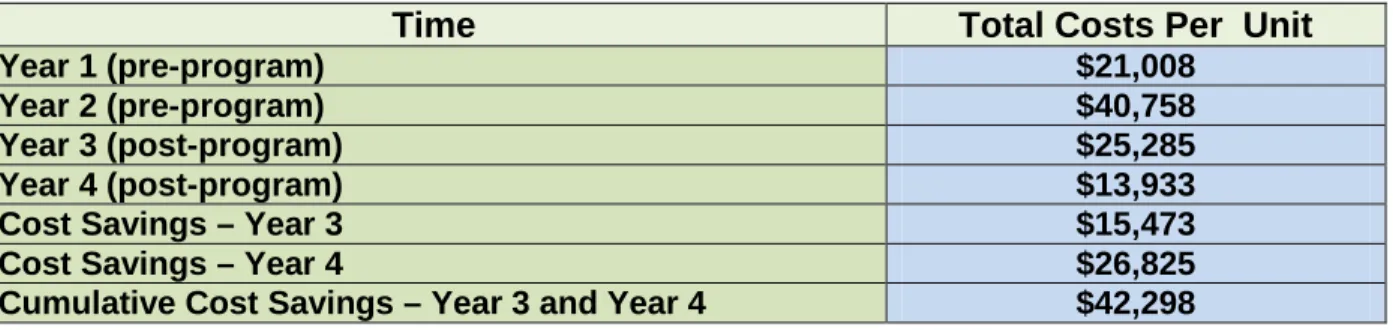
Table 1 illustrates the average costs per occupied housing unit for all services over four years for program group participants. The data show that, the average costs per unit dropped from $40,758 during the second pre-program year (year 2) to $25,285 during the first post-program year (year 3), and declined to below $13,933 during the second post-program year (year 4). The pre-post comparison therefore indicates that the service cost savings yielded through participation in Project 50 are $15,473 per occupied unit during the first year of the program (year 3). These savings are estimated to increase by almost three times, exceeding $42,000 by the end of the second year in the program (year 4). During the second year of the program, cost savings increased by 73.37 percent, from $15,473 to $26,825, and this rate is applied in the next section while estimating net cost offsets of the program for the second year.
Table 1. Total Costs for 50 Occupied Housing Units for all Services
Time Total Costs Per Unit
Year 1 (pre-program) $21,008
Year 2 (pre-program) $40,758
Year 3 (post-program) $25,285
Year 4 (post-program) $13,933
Cost Savings – Year 3 $15,473
Cost Savings – Year 4 $26,825
12
Before-and-After Comparison of the Program and Comparison
Groups
In this section, a comparison group is added to the analysis to provide a more robust estimation of cost savings. The impact of the program is assessed using the difference-in-differences (DID) method, which first assesses the difference between program and comparison groups during the year prior to entry into Project 50 (year 2), and then measures differences during the first year after entry into the program (year 3).15 The net impact of the program is measured by calculating the difference between the two differences.16
Comparison of Incarceration Costs
Figure 2 compares the average annual incarceration costs per occupied housing unit for the program and comparison groups between the pre- and post-program years. The data show that for the Project 50 program group, the annual average cost per occupied housing unit was $12,444 during the pre-program year, and then fell to $8,900 during the post-program year, a decline of 28 percent. Project 50 participants reduced their incarceration episodes significantly. The average annual incarceration cost per occupied housing unit increased for the comparison group by 42 percent, from $17,733 to $25,229. The number of incarcerated persons in the program group dropped from 24 in the pre-program year to 16 in the post-program year. Over the same period, the number of incarcerated persons in the comparison group increased from 26 to 28. Additionally, the average annual number of days of incarceration dropped from 30 to 19 days for the program group but stayed at approximately 40 days for the comparison group between the pre-program and post-program years.
15
Due to data limitations, the analysis can only analyze one year before and one year after entry into the program. However, the year prior to entry and the year after entry continue to be called years 2 and 3 respectively so as to retain continuity with the previous section that looked only at the program group two years before and two years after entry.
16
The DID method is a commonly used quasi-experimental technique in pre-post test comparison group designs in evaluation research literature. The mean difference between the “after” (post-program) and “before” (pre-program) values of the outcome indicators for each of the program and comparison groups is calculated followed by the difference between these two mean differences. The second difference (that is, the difference in difference) is the estimate of the impact of the program. This compares program and comparison groups in terms of outcome changes over time relative to the outcomes observed for a pre-program baseline.
13
Figure 2. Average Annual Incarceration Costs per Occupied Unit for Program and Comparison Groups between Pre- and Post-Program Years
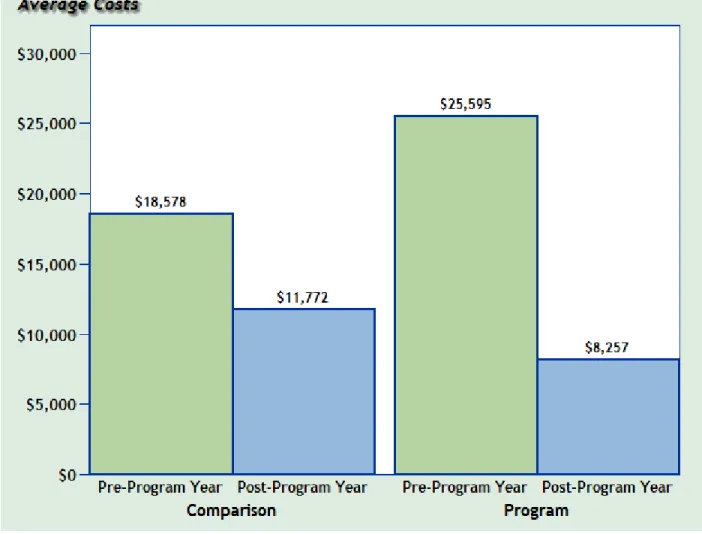
Comparison of Medical Costs
Figure 3 compares the average annual medical costs per occupied housing unit for the program and comparison groups between the pre- and post-program years. For the Project 50 group, the annual average medical cost per occupied housing unit was $25,595 during the pre-program year, and then fell sharply to $8,257 during the post-program year, a decline of 68 percent. For the comparison group, the average annual medical cost per occupied housing unit also showed a downward trend between the pre-program and post-program years from $18,578 to $11,772, a decline of roughly 37 percent. 17
17
Please note that the considerably higher medical costs for the Project 50 group in the pre-program year reflect their higher level of vulnerability, which is why they were selected for the program as opposed to the individuals in the comparison group. However, their costs in the post-program year were lower than the costs for the comparison group in the post-program year.
14
While the average medical costs for the comparison group decreased, costs for the program group were reduced much more significantly. Medical services shifted for the program group from higher-cost emergency and inpatient services to low-cost outpatient services provided through clinics. While the number of Project 50 participants who received health services increased from 28 to 32 between the pre-program and post-program years, their average annual days in high-cost inpatient and emergency services declined from 14 to 7 days, and their average annual outpatient days increased from 2 to 9 days. The average days in inpatient and emergency services also declined for the comparison group, from 10 to 8, and the number of hospitalized comparison group persons dropped from 29 to 24. The comparatively favorable results for the program group are likely due to the engagement of services on site at Project 50, which results in better management of participant service needs.
Figure 3. Average Annual Medical Costs per Occupied Unit for Program and Comparison Groups between Pre- and Post-Program Years
15
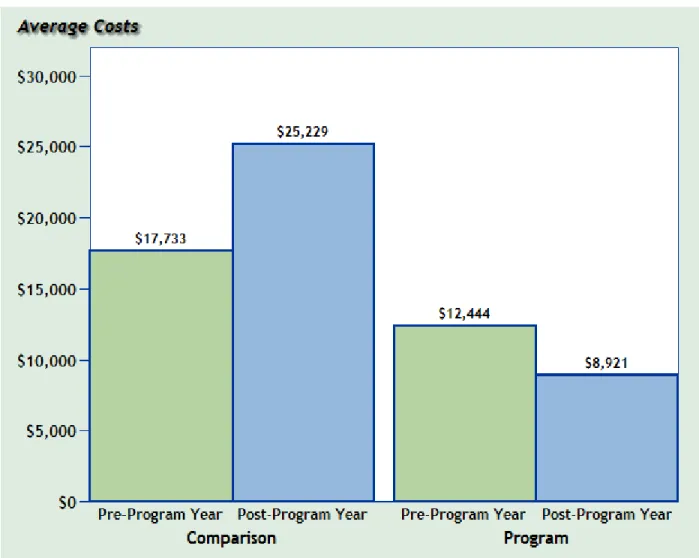
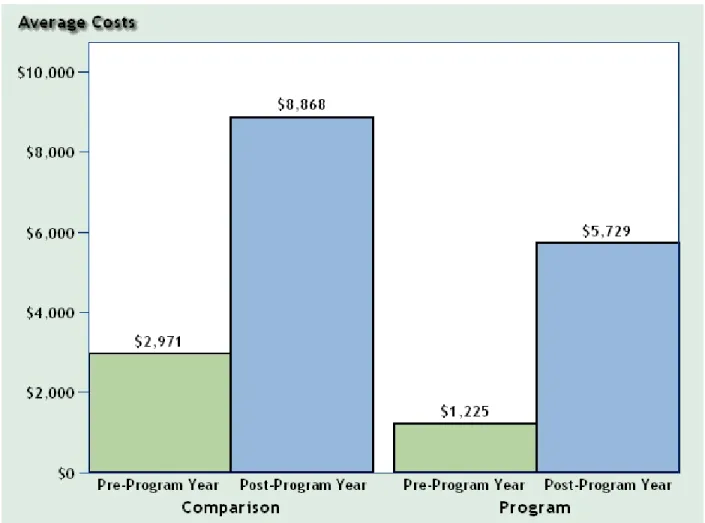
Comparison of Mental Health Treatment Costs
Figure 4 compares the average annual mental health treatment costs per occupied housing unit for the program and comparison groups between pre- and post-program years. The data show that average annual mental health costs per occupied housing unit in the program group was $1,225 during the pre-program year, but then increased to $5,729 during the post-program year, an increase of 368 percent. The average annual per-person mental health cost also rose for the comparison group from just under $2,971 to $8,868 between pre- and post-program years, an increase of almost 200 percent.
While, in absolute terms, mental health costs for the comparison group were higher after the post-program year than they were for the program group, the rate of increase in mental health costs for the program group over the period of observation was considerably higher than the rate of increase for the comparison group over the same period. As noted earlier, the large increases in mental health treatment costs for the program group are largely a function of Project 50 participants’ mental health problems having been untreated during the year prior to their engagement with the program. Although the program group’s rate of increase represents a substantial commitment of funds, it also indicates that Project 50 connects its participants with acutely needed mental health services.
The annual number of persons receiving mental health services increased similarly for both the program and comparison groups over the period of observation, from 25 to 40. The average annual number of days of mental health treatment over this period increased much more significantly for the program group, from 9 to 66 days, versus an increase from 17 to 29 days for the comparison group. However, the change in costs between the pre-program and post-program years was higher for the comparison group because these individuals used more acute mental health services. While Project 50 participants most commonly utilized outpatient mental health services, the comparison group participants utilized more hospital services and crisis stabilization in emergency rooms.
16
Figure 4. Average Annual Mental Health Treatment Costs per Occupied Unit for Program and Comparison Groups between Pre- and Post-Program Years
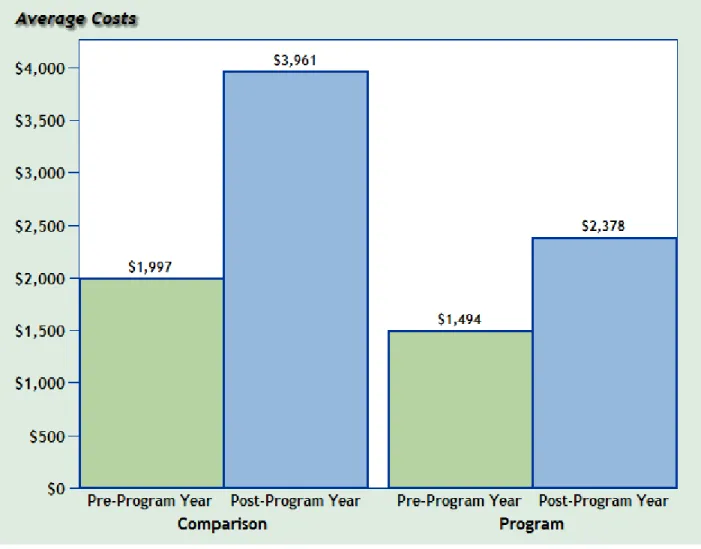
Comparison of Substance Abuse Treatment Costs
Figure 5 compares the average per-person annual alcohol and drug abuse treatment costs for the program and comparison groups between pre- and post-program years. The data show that for the program group, average annual substance abuse treatment costs per occupied housing unit rose from $1,494 during the pre-program year to $2,378 during the post-program year, an increase of almost 60 percent. For the comparison group, average annual substance abuse treatment costs per person almost doubled from $1,997 to $3,961 between pre- and post-program years. While the increase for the comparison group is almost exclusively the result of long-term residential treatment (10 individuals receiving lengthy residential services), the increase in the case of the program group is mostly the result of detox and outpatient services. Most significantly, however, although both groups increased their utilization of alcohol and drug abuse treatment services after their pre-program year, costs for the comparison group rose at a higher rate due to the higher costs of residential services.
17
The annual number of persons receiving alcohol and substance abuse services increased similarly for both the program and comparison groups, from 25 persons during the pre-program year to 40 persons during the post-program year. However, the average annual days of alcohol and substance abuse treatment increased from 10 to 18 days for the program group over this period, versus an increase from 25 to 40 days for the comparison group.
Figure 5. Average Annual Substance Abuse Treatment Costs per Occupied Unit for Program and Comparison Groups between Pre- and Post-Program Years
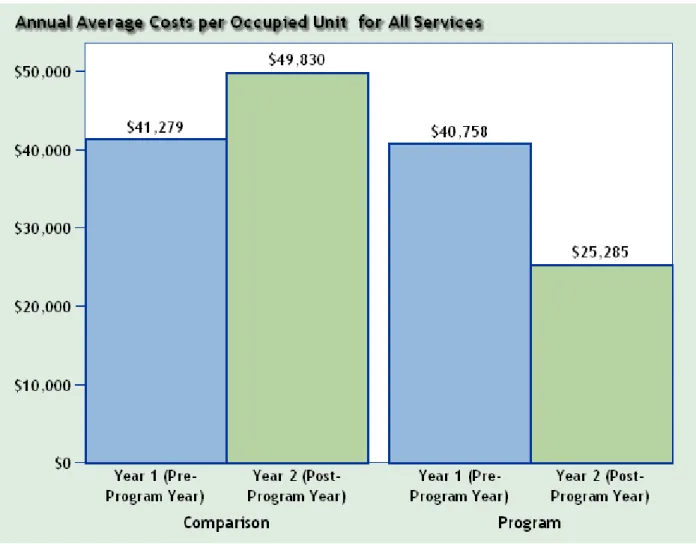
Overall Cost Offsets
Figure 6 and Figure 7 show the total cost offsets per-occupied unit yielded through participation in Project 50, both by service type and for all service types combined, based on the numbers provided in Figures 2 through 5. Figure 6 shows that average annual costs for all services were fairly comparable for both groups during their pre-program years ($41,279 for the comparison group and $40,758 for the program group). However, during the post-program year, average costs increased to $49,830 for
18
the comparison group while they decreased to $25,285 for the program group. Taken together, the results show that participation in Project 50 generated average annual service cost offsets of $24,024 per occupied housing unit during the first year of program participation. 18
Figure 6. Average Annual Service Costs and Cost Savings per Occupied Unit for Program and Comparison Groups between Pre- and Post-Program Years
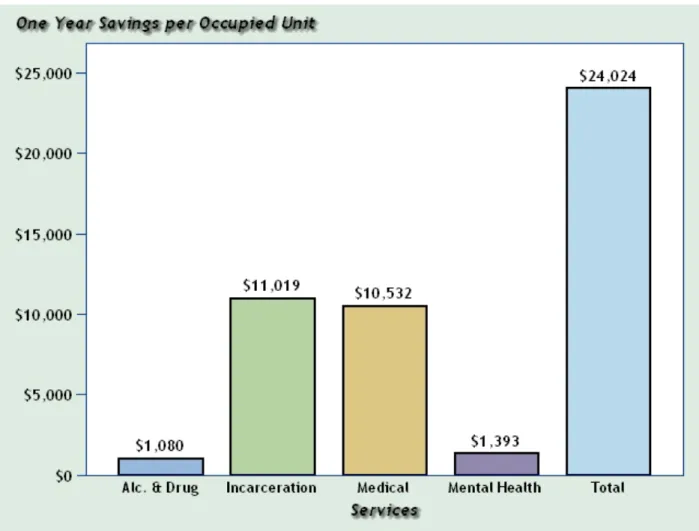
Figure 7 shows the distribution of cost savings per occupied unit during the first program year by each service type. The total cost savings per occupied unit was $24,024 as can be extrapolated from Figure 6. The average annual costs for the program group dropped from $40,758 during the pre-program year to $25,285 during the post-program year. One of the main reasons behind the decreasing costs is the significant decline in incarceration costs for the program group due to both a smaller number of incarcerated participants after their engagement with the program and a decline in their average
18
This is the difference between the post-program year difference ($49,830-$25,285=$24,545) and the pre-program year difference ($41,279-$40,758=$521). ($24,545 - $521 = $24,024).
19
number of days of incarceration. Another reason for the program group’s falling costs is the sharp decline in medical costs due to switching services from high-cost inpatient and emergency services to low-cost outpatient services, even though the number of participants treated stayed the same. Moreover, while the average mental health and alcohol and substance abuse treatment costs rose for the program group over the study period due to an increase in the number of persons treated, these growing costs were offset by the savings yielded from declines in incarceration and medical services utilization.
Figure 7. Annual Cost Savings per Occupied Unit for All Services in Project 50 during the first Program Year
20
Conclusion
Total Cost Offsets
The primary purpose of this study was to examine the extent to which reductions in service usage attributable to participation in Project 50 offset the costs of the program. To compare the costs of Project 50 with the service cost offsets the program yielded, both sets of costs must be computed in comparable terms. This requires that the estimated two-year cost offsets be compared against Project 50’s two-year expenditures, which were $3,045,000.
First-year cost offsets yielded by Project 50 were, as noted, $24,024 per occupied housing unit. Since there are no reliable data for the comparison group beyond one year, the cost savings for the second year were estimated based on the numbers provided in Table 1 for the program group. As confirmed in Figure 1, the drastic declines in incarceration, medical, and substance abuse treatment costs during the second year of program participation suggest that higher cost offsets can be expected for the program group as compared to the comparison group as Project 50 participants continue to more intensively engage with the program and their well-being improves. The pre-post comparison for the program group indicates that the cost offsets yielded through participation in Project 50 increased by 73.37 percent during the second post-program year, from $15,473 to $26,825. 19 Applying this rate of increase to the adjusted cost savings shown in Figure 7 ($24,024), the second year cost savings are estimated to reach $41,650, meaning that the combined savings over two years of participation in the program are $65,674 per occupied housing unit.
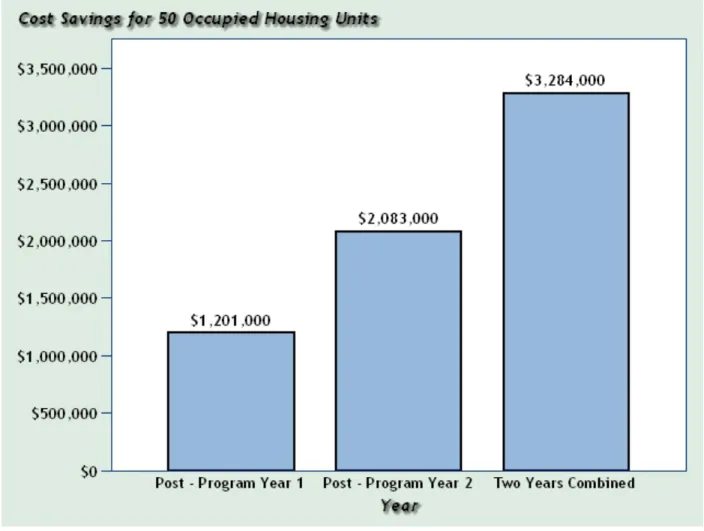
Figure 8 shows that, when we apply average cost savings per occupied housing unit to the project total of 50 units, estimated cost savings increase from $1.201 Million to $2.083 Million between the first and second program years. The total estimated cost savings is $3.284 Million.
Although the two-year budget for Project 50 was almost $3.6 million, expenditure data collected from departments administering the project reveal the actual expenditures to have been approximately $770,000 lower than budgeted. Following a report published by the Auditor-Controller, which was submitted to the Board of Supervisors on April 23, 2010, an additional amount of $221,000 was added to the actual expenditures reflecting incremental and non-incremental costs not included by the program.20
19
Cost savings for the second year were estimated from Table 1 as follows: First year savings is $15,473 computed as the difference between year 2 (pre-program year=$40,758) and year 3 (first post-program year=$25,285). Second year savings is $26,825 computed as the difference between year 2 (pre-program year=$40,758) and year 4 (second post-program year=$13,933).
Consequently, the final expenditures were estimated to be $3,045,000. The data
20
The report conducted a cost analysis of Project 50 for fiscal years 2007-2008 and 2008-2009, but did not include the costs of the third fiscal year because such figures were not available at the time the report was written.
21
therefore shows that reductions in the four service types reviewed in this study offset the costs of the project by 108 percent over two years. In other words, over the study period Project 50 offset more than the total outlays invested in the program.
Figure 8. Total Cost Savings for 50 Occupied Unit for All Services in Project 50 during the two Post- Program Years
Qualitative Findings
Consistent and Comprehensive Services
Project 50 moves participants away from street life by providing easily accessible, comprehensive, ongoing and integrated supportive services that respond to their needs for housing, medical care, mental health services, and social support. Focus group and one-on-one interviews conducted with Project 50 staff and participants between February 2009 and August 2010 offer insight into why this model of service provision has been able to yield such significant cost savings. Interviews with participants revealed that the program offered the majority of them the only consistent and comprehensive services they had ever experienced and the only care that seemed to
22
have a long-term positive impact on their lives. The overwhelming majority of participants interviewed had only high praise for these services.
As participants talked about Project 50 services, it became clear that it is not just the availability of housing and services that make the program effective, but also the way that services are delivered that distinguishes Project 50 from whatever services they had received prior to their engagement with the program. Unlike some social service agencies in which the amount, kind, and duration of services are limited and standardized, Project 50 is not a one-size-fits-all program. Rather, it tailors its services to the needs of the individual, regardless of what these needs are or how long the services are needed. Beyond just the services, interviewed participants appreciated the personal attention and respect they felt from staff. It is the quality of service provision that builds trust and incentives for participants to stay and succeed in the program. Interviews with staff and participants also revealed that staff is proactive in determining what participants need, especially in the area of health care, and in doing whatever it takes to deliver the kind of consistent care that will lead to improved health outcomes. For example, in interview after interview, participants reported that members of the Project 50 staff seek out those who are frail or who have serious medical conditions for ongoing monitoring and delivery of care, as opposed to having services delivered in a clinical setting that has rigid requirements and regulations.
One of the basic keys to Project 50’s effectiveness is a personalized and flexible model of care and service provision that is also comprehensive, covering physical and mental health services, as well as services that assist participants in recovering from substance abuse. This model of service provision has been critical in affecting a transition from poor health and the high public costs of police, jails, and emergency rooms, to better health and reduced use of costly County services. Yet interviews with participants suggested that having a key to their own home and access to caring staff were equally significant. These basic improvements led to increased self-esteem, and a feeling that they were no longer living in the shadows but rather were functioning members of society.
Effective Treatment of Health Problems
Among the health conditions faced by the Project 50 participants interviewed for this report were heart disease, cancer, and AIDS. The most immediate and dramatic impact of program services – one that was repeatedly echoed in interviews with participants – was the belief that not only had their health improved since coming to Project 50, but in several cases, the belief that they would not be alive were it not for the program’s housing and services. Moreover, while often not thought of directly as a health issue, a number of participants talked about the physical dangers of living on the streets and the constant worries they had about getting robbed and losing their possessions. They also talked about the relief they felt to now be living safely in Project 50 apartments.
The participants interviewed for this study often did not experience their many health problems in isolation. Rather, their stories reveal that multiple problems – often
23
including substance abuse – contributed to their vulnerability and were issues that Project 50 helped them address. The program did so directly through ongoing and regular contact, support groups and referrals to more intensive drug and alcohol treatment programs. Interviews with program participants revealed many stories about recovery. One collateral effect of improvements in participants’ overall health and improved quality of life was a desire to live free of dependence on drugs and alcohol. Interviews with Project 50 participants also revealed that the program provides access to effective treatment for mental health issues. It is important to note here that mental health services are one area where costs increase after engagement with Project 50. There are two overlapping reasons for this. Firstly, the program’s participants tended to receive very little in the way of mental health treatment prior to their entry into the program. Costs inevitably increased after entry because a significant portion of the participants came to the program with untreated mental health conditions and were provided direct access to services to treat them. Secondly, proper diagnosis, treatment and stabilization require ongoing services, as compared to the pre-program period where participants received little, if any, in the way of treatment for their mental health problems. That mental health costs increase after engagement is therefore a byproduct of Project 50’s effectiveness in providing mental health services. Moreover, mental health costs for the program group increased at a considerably lower rate than mental health costs for the comparison group, so that while Project 50 provides more effective mental health treatment, the program also does so in less acute and less costly ways.
Improved Self-Esteem and Integration into Society
Interviewed participants were keenly aware that people on Skid Row have no identity in the eyes of mainstream society. But many participants said that the access to housing and the help in obtaining ID cards and Social Security numbers provided acknowledgement of their worth, which helped them feel more comfortable with reintegrating into mainstream society, vital improvements that made them feel more a part of society and raised their self-esteem. Project 50 participants talked about the toll life on the streets has taken on their bodies and how relieved they were to finally have freedom from the constant fear of losing their possessions after moving into Project 50 housing. Something as seemingly simple as having a key to their own rooms made participants feel that they had moved forward in some way. This sense of control and progress in their lives leads a number of those we spoke with to feel a new confidence in themselves and to believe that they can set goals and take the next step, whether it be going to school, getting a room of their own with a kitchen and a private bathroom, volunteering, or getting a job. But even when goals for schooling, careers, and independent living may seem unrealistic or unachievable, and smaller steps are much more likely, the program nonetheless fosters hope for something beyond just survival on the street. The interviews with participants revealed that for people who have lived on the streets for many years, being stably housed changes not only the concrete condition of their lives but also instills pride in what they have accomplished and belief in the future.
24
Project 50: A Program that Yields a Surplus while also Preventing Homelessness
The analysis of Project 50’s cost effectiveness presented in this report shows that the program has yielded significant cost offsets through its method of providing housing and services to some of the most vulnerable homeless adults living on Skid Row. This is consistent with the general state of scholarly knowledge on permanent supportive housing. The total service cost savings generated by Project 50 over two years was $3.284 million. Since the total cost of the program was $3.045 million, another way to frame Project 50’s cost effectiveness is that the program’s surplus was $238,700 over the break-even point. Project 50 therefore returns to the County more than the amount invested in the program, yielding 108 percent of the costs that would have been needed to provide its participants with services, which translates into a net surplus over the two year study period of $4,774 per occupied unit. Moreover, Project 50 accomplished this surplus while also providing its participants with housing.
The qualitative findings presented in this study complement the analysis of cost avoidance, suggesting that the services and care provided through Project 50 not only enabled the County to avoid larger service costs but also have been effective in helping participants rebuild their lives and become reintegrated into society. Taken together, the quantitative and qualitative analyses of the program indicate that Project 50’s deployment of permanent supportive housing – i.e. housing plus integrated services and intensive case management – amounts to a homelessness prevention strategy that is both humane and fiscally prudent.