January 2005 (revised)
Characteristics of Registered Nurses
in Rural vs. Urban Areas:
Implications for Strategies to Alleviate
Nursing Shortages in the United States
Working Paper #91
by
Susan M. Skillman, MS
Lorella Palazzo, PhC
David Keepnews, RN, JD, PhD
L. Gary Hart, PhD
This project was funded by the U.S. Department of Health and Human Services, Health Resources and Services Administration, Bureau of Health Professions, National Center for Health Workforce Analysis, Grant No. 6 U79 HP 00003-05. The authors want to acknowledge the assistance of Steve Tise (HRSA BHPr) for coordinating access to survey data, and to Holly Andrilla, Eric Larson and Beth Jackson (University of Washington, Department of Family Medicine) for analytic and statistical help.
ABOUT THE
WORKFORCE CENTER
The WWAMI Center for Health Workforce Studies at the University of Washington Department of Family Medicine is one of six regional centers funded by the National Center for Health Workforce Analysis (NCHWA) of the federal Bureau of Health Professions (BHPr), Health Resources and Services Administration (HRSA). Major goals are to conduct high-quality health workforce research in collaboration with the BHPr and state agencies in Washington, Wyoming, Alaska, Montana, and Idaho (WWAMI); to provide methodological expertise to local, state, regional, and national policy makers; to build an accessible knowledge base on workforce methodology, issues, and findings; and to provide wide dissemination of project results in easily understood and practical form to facilitate appropriate state and federal workforce policies.
The Center brings together researchers from medicine, nursing, dentistry, public health, the allied health professions, pharmacy, and social work to perform applied research on the distribution, supply, and requirements of health care providers, with emphasis on state workforce issues in underserved rural and urban areas of the WWAMI region. Workforce issues related to provider and patient diversity, provider clinical care and competence, and the cost and effectiveness of practice in the rapidly changing managed care environment are emphasized.
ABOUT THE AUTHORS
SUSAN M. SKILLMAN, MS, is the Deputy Director of the WWAMI Center for Health Workforce Studies, Department of Family Medicine, University of Washington School of Medicine.
LORELLA PALAZZO, PhC, is a Graduate Research Assistant in the Department of Family Medicine, University of Washington School of Medicine, and a candidate for a doctorate in sociology.
DAVID KEEPNEWS, RN, JD, PhD, is an Assistant Professor in the Department of Biobehavioral Nursing and Health Systems, University of Washington School of Nursing.
L. GARY HART, PhD, is Director of the WWAMI Center for Health Workforce Studies and Professor in the Department of Family Medicine, University of Washington School of Medicine.
The WWAMI Rural Health and Health Workforce Research Center Working Paper Series is a means of distributing prepublication articles and other working papers to colleagues in the field. Your comments on these papers are welcome and should be addressed directly to the authors. Questions about the WWAMI Center for Health Workforce Studies should be addressed to:
L. Gary Hart, PhD, Director and Principal Investigator Susan Skillman, MS, Deputy Director
Roger Rosenblatt, MD, MPH, Co-Investigator Laura-Mae Baldwin, MD, MPH, Co-Investigator Denise Lishner, MSW, Center Research Coordinator Eric Larson, PhD, Senior Researcher
Heather Deacon, Program Coordinator
Martha Reeves, Working Paper Layout and Production University of Washington
Department of Family Medicine Box 354982
Seattle, WA 98195-4982 Phone: (206) 685-6679 Fax: (206) 616-4768
E-mail: deac@fammed.washington.edu Web Site: http://www.fammed.washington.edu/ CHWS/
The WWAMI Center for Health Workforce Studies is supported by the Bureau of Health Professions’ National Center for Health Workforce Information and Analysis. Grant No. 1U76-MB-10006-03; $250,000; 100%.
Characteristics of Registered Nurses
in Rural vs. Urban Areas:
Implications for Strategies to Alleviate
Nursing Shortages in the United States
SUSAN M. SKILLMAN, MS LORELLA PALAZZO, PhC DAVID KEEPNEWS, RN, JD, PhD L. GARY HART, PhD
ABSTRACT
This study compares characteristics of rural and urban registered nurses (RNs) in the United States using national survey data. Rural and urban RNs are similar in age and gender; nonwhites and Hispanics are underrepresented in both groups. Rural RNs have less nursing education, are less likely to work in hospitals, and are more likely to work full-time and in public/community health than urban RNs. The more rural an RN’s
residence, the more likely he or she commutes to another area for work and the lower salary he or she receives. Strategies to reduce nurse shortages require understanding of rural RNs’ work, education, and commuting patterns.
All areas of the country are experiencing registered nurse (RN) shortages, and many strategies are being designed to alleviate the problem. Trends contributing to the shortage are declining interest in and satisfaction with nursing as an occupation, aging of the RN
workforce, increased employer demand (driven in part by the rising number of elderly), and the need for more intensive nursing care by sicker patients (Aiken et al., 2002; Buerhaus et al., 2000). Interventions to alleviate shortages include increasing educational capacity, marketing nursing careers to more and a greater diversity of potential candidates, improving
employment conditions to retain RNs, and increasing RN wages (Buerhaus et al., 2002; Chiha & Link, 2003; Sochalski, 2002; Spetz & Given, 2003). This study examines whether certain characteristics of rural RNs should be factored into strategies to alleviate the shortage.
While little attention has been paid to the characteristics of the rural RN workforce, such understanding is needed to determine strategies and interventions that address the needs and problems of rural vs. urban populations, health care workers, and employers. Ratios of health providers to population are routinely lower in rural areas than in urban ones (Larson et al., 2003; Movassaghi et al., 1992), and small communities struggle to recruit and retain health care providers. A greater proportion of rural than urban residents are elderly, driving more demand for services such as long-term care (Ricketts et al., 1999). Poverty rates are higher in rural areas, making small rural hospitals more vulnerable to shifts in Medicare and Medicaid reimbursement (Mueller et al., 1999; Ricketts, 2001; Slifkin & Casey, 1999). Lower population densities force rural residents to drive long distances for many types of services (including health care) that urban residents can more conveniently
access. Rural areas are not all alike, however. They range from large towns adjacent to metropolitan areas to small communities isolated from even small towns (Morrill et al., 1999; Rosenblatt, 2001). Generalizing across this spectrum of communities often presents confused results (Larson et al., 2003).
To examine the characteristics of RNs while making some order of the heterogeneity of rural communities, this study analyzes national survey data using a rural-urban classification system that is based on population demographics and work commuting patterns.
METHODS
DATA SOURCES
The data for this study come from the 2000 National Sample Survey of Registered Nurses (NSSRN), a nationally representative sample of RNs drawn from records of active licenses in all 50 states and the District of Columbia. The survey employs a stratified, nested design that oversamples minority RNs and RNs from low-population states and accounts for the possibility of RNs being licensed in more than one state. The final 2000 sample contains 35,579 unweighted and 2,714,671 weighted cases,
corresponding to a 72 percent overall survey response rate (Spratley et al., 2001). General population data were drawn from the 1998 edition of CLARITAS, a proprietary database comprising demographic estimates derived from the 1990 U.S. Census.
GEOGRAPHIC MEASURES
This study assigned rural or urban status to sample RNs by linking their individual ZIP codes (reported in the survey) with categories derived from the Rural-Urban Commuting Area (RUCA) classification. The RUCA taxonomy combines Census tract information and the standard Bureau of Census urban area and place definitions with commuting information to characterize all of the nation’s Census tracts as to their rural and urban status and functional relationships. Thirty RUCA codes were designed to be aggregated into groups to fit various needs (Morrill et al., 1999; WWAMI Rural Health Research Center, 2003). This study used a ZIP-code version of the RUCAs and analyzed data using four aggregated RUCA groups or area types: Urban (RUCA codes: 1.0, 1.1, 2.0, 2.1, 2.2, 3.0, 4.1, 5.1, 7.1, 8.1, and 10.1); large rural (RUCA codes: 4.0, 5.0, and 6.0); small rural (RUCA codes 7.0, 7.2, 7.3, 7.4, 8.0, 8.2, 8.3, 8.4, 9.0, 9.1, and 9.2); and isolated small rural (RUCA codes 10.0, 10.2, 10.3, 10.4, and 10.5). For some analyses, the RUCAs were collapsed further into two groups: urban and a single combined rural category, “all rural.”
Except where noted otherwise, the rural-urban status of RNs in this study refers to their place of residence. Of the five possible ZIP codes available from the survey for each RN (current residence, current job, past residence, past job, and survey mailing) the current residence ZIP code was chosen as each
individual’s base geographic link to the RUCA system.
STUDY POPULATION
The study population was limited to RNs in the NSSRN who resided in the continental United States and were employed in nursing (outside of the military) at survey time. This excluded RNs with missing, invalid, or foreign current-residence ZIP codes, RNs residing in any of the U.S. possessions and territories, and RNs in the military or not employed in a nursing position. The result is the final working respondent sample for this project of 29,435 (weighted to represent 2,204,491 RNs).
ANALYSIS
SPSS software was used to obtain descriptive statistics, and SUDAAN (version 7.5) to test the significance of differences in the point estimates while correcting for the complex sample design (Shah et al., 1997). Estimates were placed within 95 percent confidence intervals. Finally, cases that lacked data for any of the variables of interest were excluded from the analyses (only 1% of cases were missing data for 20% or more of the key variables).
RESULTS
DEMOGRAPHICS AND DISTRIBUTION
As shown in Exhibit 1, 20.8 percent (454,189) of U.S. RNs reside in rural areas. Among the rural RNs, 201,397 reside in large rural, 145,795 in small rural, and 106,997 in isolated small rural areas. The urban/ rural distribution of RNs by residence is
approximately consistent with the distribution of the share of the population ages 18-74 years (the age range of most RNs); 79 percent of RNs reside in urban areas, and 21 percent reside in rural ones, compared with 78 percent of the general population ages 18-74 residing in urban and 22 percent in rural ones. The allocation of RNs across different types of rural areas is also approximately consistent with the general population ages 18-74: 9 percent in large rural, 7 percent in small rural, and 5 percent in isolated small rural areas.
In most parts of the country, rural RNs appear to be roughly the same age as their urban counterparts, with mean ages of 43.4 years for urban and 43.1 years for all rural RNs (Table 1). Analyses by Census divisions showed no overall difference in the proportion of
urban versus rural RNs ages 45 and older, except in New England, where a significantly higher proportion (57.6%) of rural RNs are 45 or older than are urban RNs (49.3%). There are few males among the nation’s RN population, with the proportion
smallest in the most isolated rural areas (see Table 1). Males comprise 6.0 percent of RNs in urban and 6.2 percent of RNs in large rural places but only 4.4 percent and 4.1 percent of all nurses in small rural and isolated small rural areas, respectively. Nonwhites and Hispanics are underrepresented among both urban and rural RNs (see Table 1). They are underrepresented at similar rates among rural and urban areas, and this is true in every part of the country.
EDUCATION
RNs in all types of rural areas were significantly more likely than urban RNs to hold a diploma or an associate degree as their sole nursing education credential (see Figure 1). While nearly half
(46.6%) of urban RNs have obtained baccalaureate or higher nursing degrees, a significantly smaller share (35.3% in large rural, 30.7% in small rural, and 30.6% in isolated small rural areas) of rural RNs have obtained these degrees. There is no significant difference in the graduation age of rural and urban RNs from their basic nursing program: 26.5 years for urban RNs and 27.79 years for rural RNs. Fewer rural RNs have advanced degrees than do urban RNs (8.4% in urban, 6.4% in large rural, 5.4% in small rural, and 5.2% in isolated small rural areas).
EMPLOYMENT AND WORK
LOCATION
Nearly three-fourths of all RNs work full-time in their main nursing position, but the proportion is significantly higher
Table 1: Geographic Distribution and Demographic
Characteristics of Rural and Urban RNs in the U.S.
(2000 National Sample Survey of Registered Nurses
53.4% 46.6% 64.7% 35.3% 69.3% 30.7% 69.4% 30.6% 0% 20% 40% 60% 80% 100% Urban Large Rural Small Rural Isolated Small Rural
Highest RN Degree
Diploma or Associate Degree Baccalaureate or Higher Statistically significant: p=0.000 53.4% 64.7% 69.3% 69.4% 46.6% 35.3% 30.7% 30.6% 0% 10% 20% 30% 40% 50% 60% 70% 80% 90% 100%
Urban
Large
Rural
Small
Rural
Isolated
Small Rural
Diploma or Associate Degree Baccalaureate or HigherConfidence intervals for the exhibit are as follows (from left to right): Baccalaureate degree or higher: 45.7-47.5; 33.2-37.5; 28.5-33.0, 28.4-32.7. Diploma or associate degree: 52.5-54.3, 62.5-66.8, 67.1-71.5, 67.3-71.6. Number of RN respondents: 21,758 urban, 3,322 large rural, 2,289 small rural, 1,818 isolated small rural.
Figure 1: Highest RN Degree Attained by Rural
and Urban Nurses in the U.S. (2000 National
Sample Survey of Registered Nurses)
Rural Area Types Urban All Rural Large Rural Small Rural
Isolated Small Rural RNs by residence 1,734,910 (79.3%) 454,189 (20.8%) 201,397 (9.2%) 145,795 (6.7%) 106,997 (4.9%) RNs by work location 1,753,284 (81.0%) 410,317 (19.0%) 212,182 (9.8%) 136,997 (6.3%) 61,138 (2.8%) U.S. population ages 18-74 by residence 143,615,488 (78.2%) 40,108,717 (21.8%) 17,031,461 (9.3%) 13,298,513 (7.2%) 9,778,743 (5.3%) Mean RN age 43.4 43.1 42.8 43.2 43.5 Male RNs 104,639 (6.0%) 23,335 (5.1%) 12,551 (6.2%) 6,400 (4.4%) 4,385 (4.1%) Nonwhite and/or Hispanic RNs 222,998 (13.2%) 23,487 (5.3%) 12,586 (6.4%) 6,942 (4.8%) 3,959 (3.8%) Nonwhite and/or Hispanic U.S. population ages 18-74 26,439,611 (18.4%) 4,480,144 (11.2%) 1,963,727 (11.5%) 1,561,245 (11.7%) 953,427 (9.8%)
Confidence intervals for the exhibit are as follows (from left to right):
RNs by residence (%): 78.62-79.88; 20.12-21.38; 8.73-9.67; 6.35-7.05; 4.68-5.12. RNs by work location (%): 80.35-81.65; 18.35-19.65; 9.31-10.29; 6.01-6.59; 2.62-2.98. Mean RN age: 43.17-43.53; 42.73-43.43; 42.34-43.28.
Male RNs (%): 5.7-6.4; 4.5-5.8; 5.2-7.3; 3.4-5.4; 3.1-5.1.
Nonwhite and/or Hispanic RNs (%): 11.31-15.03; 4.61-5.91; 5.26-7.46; 3.77-5.89; 2.54-5.00. Confidence intervals for population proportions are within three decimal points of the estimate.
Approximate number of RN respondents: 21,797 urban, 7,441 all rural, 3,327 large rural, 2,292 small rural, 1,822 isolated small rural.
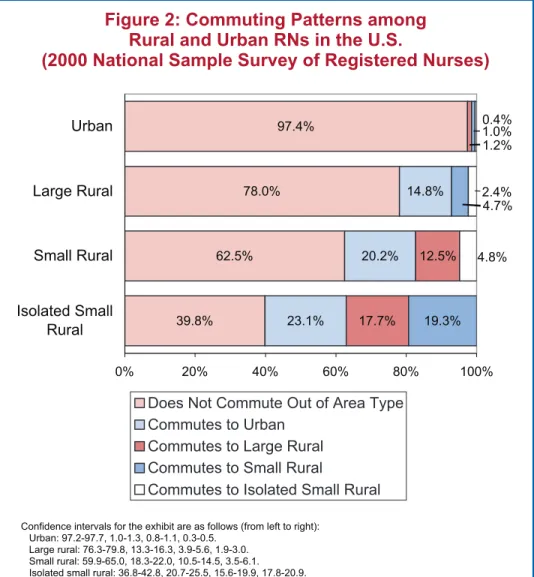
Figure 2: Commuting Patterns among
Rural and Urban RNs in the U.S.
(2000 National Sample Survey of Registered Nurses)
for rural (74.6%) than for urban RNs (70.8%). Among RNs in the three rural area types, the percent working full-time is the same (urban is 70.8%, all rural is 74.6%, large rural is 74.6%, small rural is 75.2%, and isolated small rural is 73.5%).
The majority of urban RNs (97.4%) work and reside within the same geographic RUCA type, but there is a tendency to travel to different area types for work increases as RN residence becomes more rural and isolated. The
proportion of RNs living in large rural areas who commute to other area types is 22.0 percent, while 37.5 percent of RNs living in small rural areas and 60.2 percent of RNs living in isolated small rural areas commute to other area types (see Figure 2).
The greatest proportion of rural RNs who commute to a different RUCA type go to urban jobs. Small rural and isolated small rural RNs are the most likely groups to commute to urban areas. There are also “rural-to-rural” commuting streams, of which the
proportionately most substantial group is of RNs living in isolated small rural places who work in either small rural areas (19.3%) or large rural areas (17.7%). Rural RNs commute to different area types more than urban RNs, both proportionately and in absolute numbers; 160,625 rural RNs in the United States commute to other rural or urban area types for work, compared with 43,755 urban RNs who commute to rural work locations.
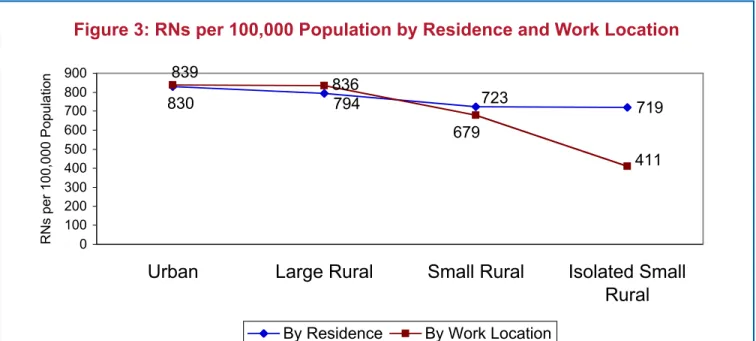
Another way to examine this trend is by measuring the ratio of RNs to population. The number of RNs in residence per 100,000 overall population is similar between urban and large rural areas (830 and 794, respectively) but declines significantly in small rural and isolated small rural areas (723 and 719,
respectively). But the number of RNs per 100,000 overall population declines even more dramatically if RN work location is considered instead of residence: 839 in urban, 836 in large rural, 679 in small rural, and 411 in isolated small rural areas (see Figure 3).
INCOME
Urban RNs working full-time in their primary nursing position earn $49,627 on average, compared with RNs living and working in the same rural area types who earn from $42,689 to $40,516 (see Table 2). Salaries are higher for RNs who commute to work in larger rural or urban areas than where they live, but full-time salaries for these commuters still lag behind the noncommuting RNs who work in those areas. Lower salaries are associated with having less than a baccalaureate RN degree in both urban and rural settings. But RNs residing in rural areas who have baccalaureate or higher degrees earn the same or lower salaries than urban RNs with only associate degrees or diplomas. Full-time RNs with associate degrees or diplomas earn on average $46,592, compared with $40,998, $37,792, and $39,690 for RNs living in large rural, small rural, and isolated small rural areas, respectively. Full-time urban RNs with at least a baccalaureate nursing degree earn on average $52,763, compared with $45,972, $46,812, and $45,683 for RNs living in large rural, small rural, and isolated small rural areas, respectively.
39.8% 62.5% 78.0% 97.4% 23.1% 20.2% 14.8% 12.5% 17.7% 1.2% 4.7% 1.0% 19.3% 4.8% 2.4% 0.4% 0% 20% 40% 60% 80% 100% Isolated Small Rural Small Rural Large Rural Urban
Does Not Commute Out of Area Type Commutes to Urban
Commutes to Large Rural Commutes to Small Rural
Commutes to Isolated Small Rural Confidence intervals for the exhibit are as follows (from left to right):
Urban: 97.2-97.7, 1.0-1.3, 0.8-1.1, 0.3-0.5. Large rural: 76.3-79.8, 13.3-16.3, 3.9-5.6, 1.9-3.0. Small rural: 59.9-65.0, 18.3-22.0, 10.5-14.5, 3.5-6.1. Isolated small rural: 36.8-42.8, 20.7-25.5, 15.6-19.9, 17.8-20.9.
Figure 3: RNs per 100,000 Population by Residence and Work Location
RN Residence Work Location Area Type Urban Large Rural Small Rural
Isolated Small Rural
Urban $ 49,627 $ 43,767 $ 43,621 $ 43,201 Large rural $ 47,170 $ 42,689 $ 42,509 $ 41,205 Small rural $ 46,446 $ 41,805 $ 41,252 $ 41,024 Isolated small rural $ 49,226 $ 42,822 $ 41,367 $ 40,516
* Wages are summed from all nursing positions.
Confidence intervals for the exhibit are as follows (from left to right):
Urban: $49,309-$49,945; $42,354-$45,180; $41,573-$45,669; $41,387-$45,015. Large rural: $44,954-$49,387; $41,927-$43,451; $40,533-$44,484; $38,861-$43,550. Small rural: $44,198-$48,695; $36,143-$47,468; $40,247-$42,258; $38,808-$43,240. Isolated small rural: $40,707-$57,746; $38,121-$47,523; $39,110-$43,625; $39,160-$41,872. Number of RN respondents (each row from left to right):
Urban work location: 13,816, 247, 228, 237. Large rural work location: 173, 1,850, 186, 206. Small rural work location: 142, 93, 1,069, 217. Isolated small rural work location: 62, 54, 77, 510.
Table 2: Mean Full-Time Salaries* of RNs in the
U.S. by Residence and Work Location (2000
National Sample Survey of Registered Nurses)
WORK SETTING
Proportionally fewer rural RNs work in hospitals than do urban RNs (57.5%, 54.6%, and 50.1% for large rural, small rural, and isolated small rural areas, respectively, compared with 60.4% for urban) (see Table 3). Second to hospitals, public/community health settings employ the largest proportion of rural RNs, followed by nursing homes/extended care facilities and then ambulatory care settings. The proportion of rural RNs working in public/community health, nursing homes/extended care, and ambulatory care settings is higher than for urban RNs.
DISCUSSION
This study reveals both common characteristics and differences between urban and rural RNs that should be factored into strategies to relieve the shortages in the nation’s nursing
workforce. Among the similarities are that men and racial/ethnic minorities are underrepresented, and the RN workforce is aging. Recruitment efforts should continue to address both trends.
This study found a significant difference in the level of educational attainment of urban and rural nurses, with rural RNs less likely to pursue baccalaureate or higher degrees in nursing (although rural and urban RNs obtain their initial nursing education at similar ages). The more isolated the rural RN, the less likely s/he is to have a baccalaureate degree. This may be a result of more education opportunities in urban areas or lack of incentives in rural areas for higher-level RN education. Pan and Straub (1997) found that RNs with baccalaureate degrees were rewarded less for their additional education if they practiced in rural areas.
Compared with urban RNs, rural RNs are more likely to work full-time. This may be because rural
employers pay less than urban employers, because fewer rural employers offer part-time opportunities for RNs, or because pressure to work longer hours is greater in small facilities. Rural RNs are also less likely to work in hospitals and more likely to be employed in public/community health, long-term care, and ambulatory care. This may reflect structural
719 794 830 723 836 839 679 411 0 100 200 300 400 500 600 700 800 900
Urban
Large Rural
Small Rural
Isolated Small
Rural
RNs per 100,000 Population
RN Residence Primary Work Location Urban Large Rural Small Rural
Isolated Small Rural
Hospital 60.4% 57.5% 54.6% 50.1%
Public or community health 11.9% 15.3% 17.0% 18.1% Nursing home/extended care facility 6.0% 8.3% 10.7% 15.1%
Ambulatory care 9.8% 9.2% 8.1% 8.4% Student health 3.9% 3.8% 3.3% 3.3% Nursing education 2.1% 2.7% 2.0% 1.3% Occupational health 1.8% 1.2% 1.2% 1.2% Insurance claims/benefits 2.8% 0.6% 1.0% 0.7% Planning/licensing agency 0.6% 0.2% 0.2% 0.3% Other 0.6% 1.3% 1.9% 1.4%
Confidence intervals for the exhibit are as follows (from left to right): Hospital: 59.5-61.3;55.7-59.3; 52.5-56.7; 47.2-53.0.
Public or community health: 11.5-12.3; 13.9-16.6; 15.2-18.7;16.3-19.8. Nursing home/extended care facility: 5.5-6.5; 6.9-9.8; 9.6-11.8;13.2-17.1. Ambulatory care: 9.5-10.2; 8.3-10.0; 6.7-9.5; 6.9-10.0. Student health: 3.5-4.3; 3.1-4.5; 2.5-4.1; 2.2-4.3. Nursing education: 1.9-2.3; 2.2-3.3; 1.4-2.7; 0.8-1.8. Occupational health: 1.6-2.0; 0.7-1.7; 0.7-1.8; 0.5-1.9. Insurance claims/benefits: 2.5-3.0; 0.3-0.9; 0.6-1.4; 0.3-1.1. Planning/licensing agency: 0.4-0.8; 0.1-0.4; 0.0-0.3; 0.0-0.6. Other: 0.5-0.8; 0.9-1.6; 1.2-2.7; 0.7-2.2.
Number of RN respondents: 21,701 urban, 3,321 large rural, 2,287 small rural, and 1,816 isolated small rural.
Table 3: Primary Work Location of
RNs in the U.S. by Residence
(2000 National Sample Survey of Registered Nurses)
differences in rural health care, where there are fewer and smaller hospitals than in urban areas.
More than three and a half times as many rural RNs commute to a different geographic area type to work than do urban RNs, and the more rural the residence of an RN, the more likely s/he is to commute to another area type to work.1 This finding may be important evidence that rural RNs are less likely to find attractive jobs in the type of areas in which they reside. For example, there are only 411 RNs working in isolated small rural areas of the United States for every 100,000 residents in those areas, and yet 719 RNs reside in isolated small rural areas for every 100,000 residents.
This study found that the more isolated the residence of rural RNs, the lower salary they receive. Lower costs of living in the more isolated areas may reduce or eliminate the impact of these
differences. But low costs of living may not be sufficient to override the attraction of higher salaries and/or professional stimulation of jobs in less isolated and more urban areas, causing large numbers of rural RNs to commute out of their residence area type.
Additional research is needed to understand the motivation of these rural commuters. A major challenge to strategies for addressing the nursing shortage is the unintended consequence of increasing the supply of nurses in urban areas while exacerbating the shortage in rural areas. If higher wages attract and retain more nurses, and urban employers are in general better positioned (by virtue of size, resources, or payer mix) than rural employers to raise wages, this policy could draw larger numbers of RNs from rural to urban settings. As health care employers, educators, researchers and policymakers consider strategies for addressing the nursing shortage and ensuring an adequate supply of RNs, it should be clear that a “one size fits all” approach will not be sufficient. Characteristics of rural RNs must be better understood and taken into account if the health care needs of the U.S. population—rural and urban—are to be met.
_________________________
1 This is not a measure that can be used definitively to say that rural RNs commute farther distances to work than do urban RNs because it does not capture individuals who travel to work in a different area but within the same area type.
REFERENCES
Aiken, L. H., Clarke, S. P., Sloane, D. M., Sochalski, J., Silber, J. H. (2002). Hospital nurse staffing and patient mortality, nurse burnout, and job
dissatisfaction. JAMA, 288(16), 1987-1993.
Buerhaus, P. I., Needleman, J., Mattke, S., Stewart, M. (2002). Strengthening hospital nursing. Health Affairs, 21(5), 123-132.
Buerhaus, P. I., Staiger, D. O., Auerbach, D. I. (2000). Implications of an aging registered nurse workforce. JAMA, 283(22), 2948-2954.
Chiha, Y. A., Link, C. R. (2003). The shortage of registered nurses and some new estimates of the effects of wages on registered nurses labor supply: a look at the past and a preview of the 21st century. Health Policy, 64(3), 349-375.
Larson, E. H., Johnson, K. E., Norris, T. E., Lishner, D. M., Rosenblatt, R. A., Hart, L. G. (2003). State of the health workforce in rural America: profiles and comparisons. Seattle, WA: WWAMI Rural Health Research Center, University of Washington. Morrill, R., Cromartie, J., Hart, L. G. (1999). Metropolitan, urban, and rural commuting areas: toward a better depiction of the U.S. settlement system. Urban Geography, 20(8), 727-748.
Movassaghi, H., Kindig, D. A., Juhl, N., Geller, J. M. (1992). Nursing supply and characteristics in the nonmetropolitan areas of the United States: findings from the 1988 National Sample Survey of Registered Nurses. Journal of Rural Health, 8(4), 276-282. Mueller, C. D., Schoenman, J. A., Dorosh, E. (1999). The Medicare Program in rural areas. In T. C. Ricketts, III (Ed.), Rural health in the United States. (pp. 70-83). New York: Oxford University Press.
Pan, S., Straub, L. (1997). Returns to nursing education: rural and nonrural practice. Journal of Rural Health, 13(1), 78-85.
Ricketts, T. C. (2001). The rural patient. In J. P. Geyman, T. E. Norris, L. G. Hart (Eds.), Textbook of rural medicine. (pp. 15-26). New York: McGraw-Hill. Ricketts, T. C., III, Johnson-Webb, K. D., Randolph, R. K. (1999). Populations and places in rural America. In T. C. Ricketts, III (Ed.), Rural health in the United States. (pp. 7-24). New York: Oxford University Press. Rosenblatt, R. A. (2001). The health of rural people and the communities and environments in which they live. In J. P. Geyman, T. E. Norris, L. G. Hart (Eds.), Textbook of rural medicine. (pp. 3-14). New York: McGraw-Hill.
Shah, B. V., Barnwell, B. G., Bieler, G. S. (1997). SUDAAN user’s manual, release 7.5. Research Triangle Park, NC: Research Triangle Institute. Slifkin, R. T., Casey, M. M. (1999). Medicaid managed care in rural areas. In T. C. Ricketts, III (Ed.), Rural health in the United States. (pp. 95-100). New York: Oxford University Press.
Sochalski, J. (2002). Nursing shortage redux: turning the corner on an enduring problem. Health Affairs, 21(5), 157-164.
Spetz, J., Given, R. (2003). The future of the nurse shortage: will wage increases close the gap? Health Affairs, 22(6), 199-206.
Spratley, E., Hohnson, A., Sochalski, J., Fritz, M., Spencer, W. (2001). The registered nurse population March 2000: findings from the National Sample Survey of Registered Nurses. Rockville, MD: Division of Nursing, Bureau of Health Professions, Health Resources and Services Administration, U.S. Department of Health and Human Services. WWAMI Rural Health Research Center (2003). Retrieved January 14, 2004, from http:// www.fammed.washington.edu/wwamirhrc/.
RELATED RESOURCES
FROM THE WWAMI
CENTER FOR HEALTH
WORKFORCE STUDIES AND
THE RURAL HEALTH
RESEARCH CENTER
PUBLISHED ARTICLES
Benedetti, T. J., Baldwin, L. M., Andrilla, C. H., Hart, L. G. (2004). The productivity of Washington State’s obstetrician-gynecologist workforce: does gender make a difference? Obstetrics and Gynecology, 103(3), 499-505.
Grumbach, K., Hart, L. G., Mertz, E., Coffman, J., Palazzo, L. (2003). Who is caring for the underserved? A comparison of primary care physicians and
nonphysician clinicians. Annals of Family Medicine, 1(2), 97-104.
Larson, E. H., Hart, L. G., Ballweg, R. (2001). National estimates of physician assistant productivity. Journal of Allied Health, 30(3), 146-152.
Larson, E. H., Palazzo, L., Berkowitz, B., Pirani, M. J., Hart, L. G. (2003). The contribution of nurse practitioners and physician assistants to generalist care in Washington State. Health Services Research, 38(4), 1033-1050.
WORKING PAPERS
Baldwin, L.-M., Fay, M. M., Larson, E. H., Lishner, D. M., Mauksch, L. B., Katon, W. J., Walker, E., Hart, L. G. (2003). Modeling the mental health workforce in Washington State: using state licensing data to examine provider supply in rural and urban areas. Working Paper #80. Seattle, WA: WWAMI Center for Health Workforce Studies, University of Washington. Benedetti, T. J., Baldwin, L.-M., Andrilla, C. H. A., Hart, L. G. (2003). The productivity of Washington State’s obstetrician-gynecologist workforce: does gender make a difference? Working Paper #82. Seattle, WA: WWAMI Center for Health Workforce Studies, University of Washington.
Larson, E. H., Hart, L. G., Muus, K., Geller, J. (1999). Content of physician assistant practice: results from a national survey. Working Paper #55. Seattle, WA: WWAMI Rural Health Research Center, University of Washington.
Larson, E. H., Palazzo, L., Berkowitz, B., Pirani, M. J., Hart, L. G. (2001). The contribution of nurse practitioners and physician assistants to generalist care in underserved areas of Washington State. Working Paper #64. Seattle, WA: WWAMI Rural Health Research Center, University of Washington.
Patterson, D., Skillman, S. M. (2002). Health
professions education in Washington State: 1996-2000 program completion statistics. Working Paper #73. Seattle, WA: WWAMI Center for Health Workforce Studies, University of Washington.
Patterson, D. G., Skillman, S. M., Hart, L. G. (2004). Washington State’s pharmacist workforce through 2020: influential factors and available data. Working Paper #90. Seattle, WA: WWAMI Center for Health Workforce Studies, University of Washington. Patterson, D. G., Skillman, S. M., Hart, L. G. (2004). Washington State’s radiographer workforce through 2020: influential factors and available data. Working Paper #89. Seattle, WA: WWAMI Center for Health Workforce Studies, University of Washington. Palazzo, L., Hart, L. G., Skillman, S. M. (2002). The impact of the changing scope of practice of physician assistants, nurse practitioners, and certified nurse-midwives on the supply of practitioners and access to care: Oregon case study. Working Paper #70. Seattle, WA: WWAMI Center for Health Workforce Studies, University of Washington.
Skillman, S. M., Hutson, T., Andrilla, C. H. A. (2003). Washington State hospitals: results of 2002 workforce survey. Working Paper #79. Seattle, WA: WWAMI Center for Health Workforce Studies, University of Washington.
Skillman, S. M., Hutson, T., Andrilla, C. H. A., Berkowitz, B., Hart, L. G. (2002). How are Washington State hospitals affected by the nursing shortage? Results of a 2001 survey. Working Paper #68. Seattle, WA: WWAMI Center for Health Workforce Studies, University of Washington. Wright, G. E., Paschane, D. M., Baldwin, L. M., Domoto, P., Cantrell, D., Hart, L. G. (2001). Distribution of the dental workforce in Washington State: patterns and consequences. Working Paper #60. Seattle, WA: WWAMI Center for Health Workforce Studies, University of Washington.
For a complete list of publications by the Center for Health Workforce Studies, visit