Abstract
___________________________________________________________________________
Instituto Complutense de Estudios Internacionales, Universidad Complutense de Madrid. Campus de Somosaguas, Finca Mas Ferré. 28223, Pozuelo de Alarcón, Madrid, Spain.© Fernando Fernández-Rodríguez and Simón Sosvilla-Rivero
Fernando Fernández-Rodríguez: Department of Quantitative Methods in Econom-ics, Universidad de Las Palmas de Gran Canaria, 35017 Las Palmas de Gran Canaria, Spain. [email protected]
Simón Sosvilla-Rivero: Complutense Institute for International Studies, Universidad Com-plutense de Madrid. 28223 Madrid, Spain. [email protected]
ISSN: 2530-0849
Acknowledgements: The authors thank Manish K. Singh for his excellent research assistance. This paper is based upon work supported by the Banco de España through a grant from Programa de Ayudas a la Investigación 2016–2017 en Macroeconomía, Economía Monetaria, Financiera y Bancaria e Historia Económica. Simón Sosvilla-Rivero thanks the hospitality provided by the
Department of Economics during a research visit at the University of Bath financed by the Spanish
Ministry of Education, Culture and Sport through a grant from Programa Estatal de Promoción del Talento y su Empleabilidad en I+D+i (Subprograma Estatal de Movilidad, del Plan Estatal de
Investigación Científica y Técnica y de Innovación 2013- 2016). Responsibility for any remaining
errors rests with the authors.
El ICEI no comparte necesariamente las opiniones expresadas en este trabajo, que son de exclusi-va responsabilidad de sus autores.
This paper empirically investigates volatility transmission among stock and foreign exchange markets in seven major world economies during the period July 1988 to January 2015. To this
end, we first perform a static and dynamic analysis to measure the total volatility connectedness in the entire period (the system-wide approach) using a framework recently proposed by Diebold and Yılmaz (2014). Second, we make use of a dynamic analysis to evaluate the net directional
connectedness for each market. To gain further insights, we examine the time-varying behaviour
of net pair-wise directional connectedness during the financial turmoil periods experienced in the
sample period Our results suggest that slightly more than half of the total variance of the forecast errors is explained by shocks across markets rather than by idiosyncratic shocks. Furthermore,
we find that volatility connectedness varies over time, with a surge during periods of increasing economic and financial instability.
Keywords: Stock markets, Exchange rates, Market Linkages, Vector Autoregression, Variance Decomposition.
Index
1.
Introduction
7
2. Connected analysis
8
2.1
Econometric
methodology
8
2.2.
Data
9
2.3. Static (full-sample, unconditional) analysis
10
2.4 Dynamic (rolling, conditional) analysis
10
2.4.1.
Total
connectedness
10
3. Net directional connectedness
13
4. Net pair-wise directional connectedness
16
5.
Concluding
remarks.
18
7
1. Introduction
Economic and financial globalization generates
intense co-movement across countries. As
Chinn (1989) argued, the greater integration
of equity markets, that has led to a greater link between these markets and to substantial
international financial flows, means that equity markets have an increasing influence on exchange rate. This influence can help to
explain some excess variability in foreign exchange markets, since equity markets have
a tendency to develop significant pricing errors [see, e. g., Shiller (1981) and Campbell and Shiller (1987)]. In fact, Sarantis (1987) expanded Branson (1976, 1977)´s
portfolio-balance model of exchange rate determination by introducing equity assets into the portfolio of investors obtaining better results than
the original specification.
The interdependence of stock price returns and exchange rate changes has been extensively examined in the empirical literature with
mixed findings on the directional causality (see
Adler and Dumas, 1984; Booth and Rotenberg, 1990; Jorion, 1990; Sercu and Vanhulle, 1992; Smith 1992; Bodnar and Gentry, 1993; Amihud, 1994 and Inci and Lee, 2014; among
others). Likewise, empirical evidence on the
dynamic linkage between stock and currency
market volatilities also provides conflicting findings. Early studies, such as Jorion (1990), suggested that exchange rate fluctuations
do not affect stock return volatility, while others (see, for example, Dumas and Solnik,
1995; Roll, 1992) identified the existence of a strong linkage. More recently, Kanas (2000)
has analysed volatility transmission between stock and currency markets in the USA, the UK, Japan, Germany, France and Canada
finding evidence of spillovers between stock returns and exchange rate changes for five
of the six countries analysed (with Germany
being the exception). Yang and Doong (2004)
investigated volatility spillovers between stock prices and exchange rates for the G-7
countries finding that stock markets play a
relatively more important role than foreign
exchange markets in the second moment interactions and spillovers. Wang et al. (2013)
use a dependence-switching copula model to describe the dependence structure between the stock and foreign exchange markets s for six major industrial countries (Canada, France,
Germany, Italy, Japan and the United Kingdom)
over the 1990–2010 period concluding that the dependence and tail dependence among the above four market statuses are asymmetric for most countries in the negative correlation regime, but symmetric in the positive correlation.
In this study we will focus on the volatility interconnection between the stock and currency markets of seven major world economies making use of Diebold and Yilmaz’s
(2014) measures of connectedness1. Diebold
and Yilmaz’s (2014) connectedness framework
is closely linked with both modern network theory (see Glover and Richards-Shubik,
2014) and modern measures of systemic risk
(see Ang and Longstaff, 2013 or Acemoglu et
al., 2015) and has been used by Diebold and
Yilmaz (2015) for defining, measuring, and monitoring connectedness in financial and
related macroeconomic environments
(cross-firm, cross-asset, cross-market, cross-country, etc.). The degree of connectedness, on the
other hand, measures the contribution of individual units to systemic network events, in a fashion very similar to the conditional value
at risk (CoVaR) of this unit (see, e. g., Adrian and Brunnermeier, 2008).
Our study extends and complements the existing literature by providing a novel
1 The connectedness methodology has several
advantages over the alternative approach of focusing on contemporaneous correlations (corrected
or not for volatility). First, while correlation is
a symmetrical measure, connectedness is an asymmetrical one, so the procedure provides information on the direction and magnitude of the
volatility transmission (from country A to country
B, from country B to country A, or both). Second,
by investigating dynamic connectedness through a rolling window, we can evaluate how the strength of the connectedness evolves over time, allowing us to detect episodes of sudden and temporary increases in volatility transmission.
perspective on the interdependence of stock markets and exchange-rate markets. Although a substantial amount of literature has used different extensions of Diebold and Yilmaz’s
(2012) previous methodology to examine
spillovers and transmission effects in different
financial markets2, to the best of our knowledge
it has not been applied to explore volatility transmission between the stock and currency markets of seven major world economies.
Since volatility reflects the extent to which the
market evaluates and assimilates the arrival of new information, the analysis of its transmission pattern might provide useful insights into the characteristics and dynamics of exchange-rate and stock markets. So, since the information gathered would provide a barometer for the vulnerability of these markets, we consider that to empirically examine volatility spillovers is a novel and relevant issue. Moreover, during crises, markets’ volatilities tend to increase
rapidly, and financial analysts seem to believe
that volatility shocks in one market can easily have an impact on the other markets, being the connectedness analysis ideal for testing net directional spillovers, identifying when and where they started in a given market and how subsequently spread to the rest of markets. The rest of the paper is organized as follows.
Section 2 presents Diebold and Yılmaz (2014)’s
methodology for assessing connectedness in
financial market volatility, and the empirical results (both static and dynamic) obtained for
2Awartania et al. (2013), Lee and Chang (2013),
Chau and Deesomsak (2014) and Cronin (2014)
apply this methodology to examine spillovers in
the United States’ markets; Yilmaz (2010), Zhou
et al. (2012) or Narayan et al. (2014) focus on
Asian countries; Apostolakisa and Papadopoulos
(2014) and Tsai (2014) examine G-7 economies, Duncan and Kabundi (2013) centre their analysis
on South African markets, Antonakakisa and Floros
(2016): study dynamic interdependencies among
the housing market and stock market in the United
Kingdom, Grosche and Heckele (2016) investigate
volatility spillovers between agricultural, crude
oil, real estate, and other financial markets
and Fernández-Rodríguez et al. (2016) use
connectedness analysis to assess financial stress
transmission in EMU sovereign bond market volatility.
our sample of seven major world economies
(a system-wide measure of connectedness).
Section 3 presents the empirical results regarding the evolution of net directional connectedness in each market. In Section 4 we examine the time-varying behaviour of net pair-wise directional connectedness during
the financial turmoil periods experienced
during in the sample period. Finally, Section
5 summarizes the findings and offers some
concluding remarks.
2. Connectedness analysis
2.1. Econometric methodology
The main tool for measuring the amount of connectedness is based on a decomposition of the forecast error variance, which we will now
briefly describe.
Given a multivariate empirical time series, the forecast error variance decomposition results from the following steps:
1. Fit a standard vector autoregressive (VAR)
model to the series.
2. Using series data up to and including time t, establish an H period-ahead forecast (up to time t + H).
3. Decompose the error variance of the forecast for each component with respect to shocks from the same or other components at time t.
Diebold and Yilmaz (2014) propose several
connectedness measures built from pieces of variance decompositions in which the forecast error variance of variable i is decomposed into parts attributed to the various variables in the system. This section provides a summary of their connectedness index methodology. Let us denote by dH
ij the ij-th H-step variance decomposition component (i.e., the fraction of variable i’s H-step forecast error variance due to shocks in variable j). The connectedness
measures are based on the “non-own”, or “cross”, variance decompositions, dH
Consider an N-dimensional
covariance-stationary data-generating process (DGP)
with orthogonal shocks:
x
t=
Θ
(
L
)
u
t,
...,
)
(
2 2 1 0+
Θ
+
Θ
+
Θ
=
Θ
L
L
L
E
(
u
t,
u
t′
)
=
I
.
Note that
Θ
0need not be diagonal. All aspectsof connectedness are contained in this very general representation. Contemporaneous aspects of connectedness are summarized in
Θ
0and dynamic aspects in{
Θ
1,
Θ
2,...}.
Transformation of
{
Θ
1,
Θ
2,...}
via variancedecompositions is needed to reveal and compactly summarize connectedness. Diebold
and Yilmaz (2014) propose a connectedness
table such as Table 1 to understand the various connectedness measures and their relationships. Its main upper-left NxN block, which contains the variance decompositions, is called the “variance decomposition matrix,” and is denoted by DH =[dij]. The connectedness table increases
D
H with a rightmost column containing row sums, a bottom row containing column sums, and a bottom-right element containing the grand average, in all cases for i ≠ j.Since in general
C
iH←j≠
C
Hj←i,
the netpair-wise directional connectedness from j to i, can
be defined as:
.
H j i H i j H ijC
C
C
=
←−
←As for the off-diagonal row sums in Table 1, they give the share of the H-step forecast-error variance of variable xi coming from shocks arising in other variables (all others,
as opposed to a single other), while the
off-diagonal column sums provide the share of the H-step forecast-error variance of variable xi going to shocks arising in other variables. Hence, the off-diagonal row and column sums, labelled “from” and “to” in the connectedness table, offer the total directional connectedness measures. In particular, total directional connectedness from others to i is defined as
, 1
∑
≠ = • ← = N i j j H ij H i d Cand total directional connectedness to others from i is defined as . 1
∑
≠ = •← = N i j j H ji H i d CWe can also define net total directional
connectedness as
.
• ← •←−
=
H i H i H iC
C
C
Table 1: Schematic connectedness table
x1 x2 ... xN Connectedness from others x1 H
d
11d
12H … H Nd
1,
1
1 1≠
∑
=d
j
N j H j x2 Hd
21d
22H … H Nd
2,
2
1 2≠
∑
=d
j
N j H j . . . . . . . . . . . . xN H Nd
1d
NH2 … H NNd
Nd
j
N
j H Nj≠
∑
=1,
Connectedness to others∑
= N i H i d 1 1 1 ≠ i∑
= N i H i d 1 2 2 ≠ i …∑
= N i H iN d 1 N i ≠∑
= N j i H iN d N , 1 1 N i≠The off-diagonal entries of
D
Hare the parts of the N forecast-error variance decompositions of relevance from a connectedness perspective. In particular, the gross pair-wise directional connectedness from j to i is defined as follows:.
H ij H j id
C
←=
Finally, the grand total of the off-diagonal entries in DH (equivalently, the sum of the
“from” column or “to” row) measures total
connectedness: . 1 1 ,
∑
≠= = N i jj i H ij H d N CFor the case of non-orthogonal shocks, the variance decompositions are not as easily calculated as before, because the variance of a weighted sum is not an appropriate sum of variances; in this case, methodologies for providing orthogonal innovations like
traditional Cholesky-factor identification
may be sensitive to ordering. So, following
Diebold and Yilmaz (2014), a generalized VAR decomposition (GVD), invariant to ordering,
proposed by Koop et al. (1996) and Pesaran
and Shin (1998) will be used. The H-step
generalized variance decomposition matrix is
defined as
D
gH=
d
ijgH
, where(
)
(
)
1 2 1 0 1 0´
´
´
H jj i h j gH h ij H i h h j he
e
d
e
e
σ
− − = − =Θ Σ
=
Θ ΣΘ
∑
∑
In this case,
e
j is a vector with jth element unityand zeros elsewhere,
Θ
h is the coefficientmatrix in the infinite moving-average
representation from VAR,
Σ
is the covariance matrix of the shock vector in the non-orthogonalized-VAR,σ
jj being its jth diagonalelement. In this GVD framework, the lack of orthogonality means that the rows of
d
ijgH donot have sum unity and, in order to obtain a generalized connectedness index
D
g=
d
ijg, the following normalization is necessary: 1 g ij g ij N g ij j
d
d
d
==
∑
, where by construction 11
N g ij jd
==
∑
and , 1 N g ij i jd
N
==
∑
The matrix
D
g=
d
ijg permits us to definesimilar concepts as defined before for the
orthogonal case, that is, total directional
connectedness, net total directional connectedness, and total connectedness.
2.2. Data
The data consist of daily closing stock prices denominated in local currency for the US (Standard & Poor’s 500 composite index,
S&P500), the Euro Area (Eurostoxx 50 Index), Japan (Nikkei 225 index), the UK (Financial Times Stock Exchange 100 Index, FTSE100), Australia (All Ordinaries Index, AOI), Switzerland (Swiss Market Index, SMI) and
Canada (Toronto Stock Exchange Composite
Index, TSX). The exchange rate series for each
country is a trade-weighted exchange rate, to account for each country’s diverse investment positions in foreign equities. In particular, we examine the following effective exchange rates:
US Dollar (USD), Euro (EUR), Australian dollar (AUD), Swiss franc (CHF), Canadian dollar (CAD), British pound (GBP) and Japanese yen (JPY). The stock price data has been extracted
from Datastream. The exchange rate series are the Bank of England trade-weighted exchange rates. Note that focusing on these seven major world economies, we cover 174.9% of global foreign exchange market turnover3.
Weekly data is used to partially overcome the potential problem of nonsynchronous data, which may arise because there are instants in which markets are closed in one country and
open in another (Burns and Engle (1998) and Lo and MacKinlay (1990) study the effects of this problem). The returns are computed as log
differences using Wednesday to Wednesday closing index prices to avoid any potential
day of the week biases (see Brailsford (1995) and Griffin et al. (2007) among others). If a
particular Wednesday happens to be a non-trading day, then closing values are recorded
on the previous trading day. Our final sample
covers the period 6 July 1988 to 21 January
3 Average of currency distribution of global foreign
exchange market turnover over 2001, 2004, 2007, 2010, 2013 and 2016 Bank for International
Settlements (2016). Because two currencies
are involved in each transaction, the sum of the percentage shares of individual currencies totals 200% instead of 100%.
2015 (i.e., a total of 1,386 observations), spanning several important financial market episodes in addition to the global financial
crisis of 2007-2008 – in particular, the tequila crisis in 1994, the Asian crisis in 1997-1998, the rubble crisis in 1998, the dotcom crash in 2001 and the euro area sovereign debt crisis from 2009 onwards.
2.3. Static (full-sample, unconditional)
analysis
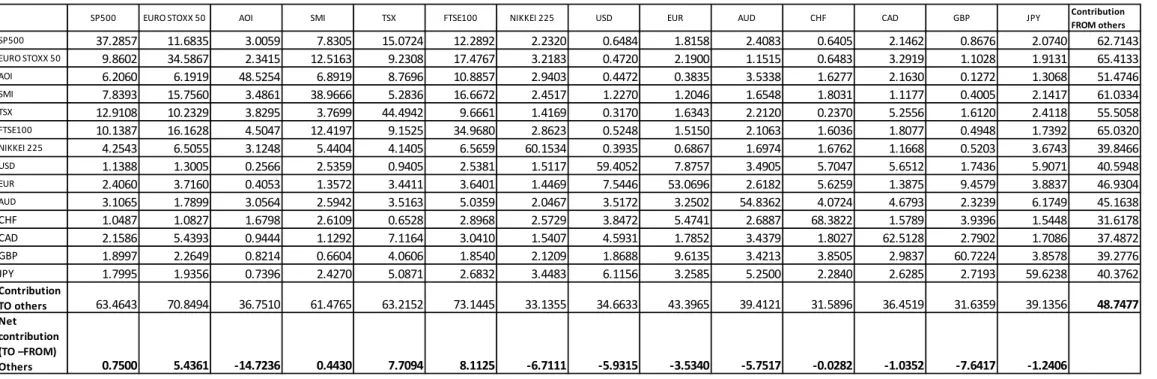
The full-sample connectedness table appears as Table 2. As mentioned above, the ijth entry of the upper-left 14x14 market submatrix gives the estimated ijth pair-wise directional connectedness contribution to the forecast error variance of market i’s volatility yields coming from innovations to market j. Hence,
the off-diagonal column sums (labelled TO) and row sums (labelled FROM) gives the total
directional connectedness to all others from i and from all others to i respectively. The
bottom-most row (labelled NET) gives the
difference in total directional connectedness
(to-from). Finally, the bottom-right element (in boldface) is the total connectedness.
As can be seen, the diagonal elements (own
connectedness) are the largest individual
elements in the table (ranging from 34.97%
for FTSE100 to 68.38% for CHF), being higher
in foreign exchange markets (with an average
of 59.79%) than in stock markets (with an average of 30.91%). Nevertheless, total
directional connectedness (from others or
to others) tends to be much larger for stock
markets, except the contribution to others by AOI and the Nikkei 225 Index. In addition, the spread of the “from” degree distribution is noticeably greater than that of the “to” degree distribution for nine out of the fourteen cases under study.
Regarding pair-wise directional connectedness (the off-diagonal elements of the upper-left
14×14 submatrix), the highest observed
pair-wise connectedness is from FTSE100 to
Eurostoxx 50 (17.48%). In return, the pair-wise
connectedness from Eurostoxx 50 to FTSE100
(1.16%) is the second-highest. The highest
value of pair-wise directional connectedness between foreign exchange markets is from
EUR to GBP (9.61%), followed by that from GPB to EUR (9.46%). The highest value of
pair-wise directional connectedness between stock markets and foreign markets is from TSX to
CAD (7.12%), followed by that from CAD to TSX (5.26%). The total directional connectedness
from others, which measures the share of volatility shocks received from other market in the total variance of the forecast error for
each market, ranges between 31.62% (CHF) and 51.47% (AOI). As for the total directional
connectedness to others, our results suggest that it varies from a low of 31.59% for CHF to 73.14% for FTSE100. Finally, we obtain a value of 48.75% for the total connectedness between the fourteen markets under study
for the full sample (system-wide measure),
indicating that 51.25% of the variation is due to idiosyncratic shocks. This result sharply contrasts with the value of 78.3% obtained
by Diebold and Yilmaz (2014) for US financial
institutions and with the value of 97.2% found
by Diebold and Yilmaz (2012) for international financial markets.
2.4 Dynamic (rolling, conditional)
analysis
The full-sample connectedness analysis provides a good characterization of “unconditional” aspects of the connectedness measures. However, it does not help us to understand the connectedness dynamics. The appeal of connectedness methodology lies in its use as a measure of how quickly return or volatility shocks spread across countries as well as within a country. This section presents an analysis of dynamic connectedness which relies on rolling estimation windows.
The dynamic connectedness analysis starts with total connectedness, and then moves on to net directional connectedness across countries in Section 3.
2.4.1. Total connectedness
The rolling-window approach has the advantages of tremendous simplicity and coherence with a wide variety of possible
Table 2: Full-sample connectedness
SP500 EURO STOXX 50 AOI SMI TSX FTSE100 NIKKEI 225 USD EUR AUD CHF CAD GBP JPY Contribution
FROM others SP500 37.2857 11.6835 3.0059 7.8305 15.0724 12.2892 2.2320 0.6484 1.8158 2.4083 0.6405 2.1462 0.8676 2.0740 62.7143 EURO STOXX 50 9.8602 34.5867 2.3415 12.5163 9.2308 17.4767 3.2183 0.4720 2.1900 1.1515 0.6483 3.2919 1.1028 1.9131 65.4133 AOI 6.2060 6.1919 48.5254 6.8919 8.7696 10.8857 2.9403 0.4472 0.3835 3.5338 1.6277 2.1630 0.1272 1.3068 51.4746 SMI 7.8393 15.7560 3.4861 38.9666 5.2836 16.6672 2.4517 1.2270 1.2046 1.6548 1.8031 1.1177 0.4005 2.1417 61.0334 TSX 12.9108 10.2329 3.8295 3.7699 44.4942 9.6661 1.4169 0.3170 1.6343 2.2120 0.2370 5.2556 1.6120 2.4118 55.5058 FTSE100 10.1387 16.1628 4.5047 12.4197 9.1525 34.9680 2.8623 0.5248 1.5150 2.1063 1.6036 1.8077 0.4948 1.7392 65.0320 NIKKEI 225 4.2543 6.5055 3.1248 5.4404 4.1405 6.5659 60.1534 0.3935 0.6867 1.6974 1.6762 1.1668 0.5203 3.6743 39.8466 USD 1.1388 1.3005 0.2566 2.5359 0.9405 2.5381 1.5117 59.4052 7.8757 3.4905 5.7047 5.6512 1.7436 5.9071 40.5948 EUR 2.4060 3.7160 0.4053 1.3572 3.4411 3.6401 1.4469 7.5446 53.0696 2.6182 5.6259 1.3875 9.4579 3.8837 46.9304 AUD 3.1065 1.7899 3.0564 2.5942 3.5163 5.0359 2.0467 3.5172 3.2502 54.8362 4.0724 4.6793 2.3239 6.1749 45.1638 CHF 1.0487 1.0827 1.6798 2.6109 0.6528 2.8968 2.5729 3.8472 5.4741 2.6887 68.3822 1.5789 3.9396 1.5448 31.6178 CAD 2.1586 5.4393 0.9444 1.1292 7.1164 3.0410 1.5407 4.5931 1.7852 3.4379 1.8027 62.5128 2.7902 1.7086 37.4872 GBP 1.8997 2.2649 0.8214 0.6604 4.0606 1.8540 2.1209 1.8688 9.6135 3.4213 3.8505 2.9837 60.7224 3.8578 39.2776 JPY 1.7995 1.9356 0.7396 2.4270 5.0871 2.6832 3.4483 6.1156 3.2585 5.2500 2.2840 2.6285 2.7193 59.6238 40.3762 Contribution TO others 63.4643 70.8494 36.7510 61.4765 63.2152 73.1445 33.1355 34.6633 43.3965 39.4121 31.5896 36.4519 31.6359 39.1356 48.7477 Net contribution (TO –FROM) Others 0.7500 5.4361 -14.7236 0.4430 7.7094 8.1125 -6.7111 -5.9315 -3.5340 -5.7517 -0.0282 -1.0352 -7.6417 -1.2406
Note: SP500, EURO STOXX 50, AOI, SMI, TSX, FTSE100, NIKKEI 225, USD, EUR, AUD, CHF, CAD, GBP and JPY stand for Standard & Poor’s 500 composite index, Eurostoxx 50 Index, Australian All Ordinaries Index, Swiss Market Index, Toronto Stock Exchange index, Nikkei 225 index, Financial Times Stock Exchange 100 Index, US Dollar, Euro, Australian dollar, Swiss franc, Canadian dollar, British pound and Japanese yen effective exchange rates, respectively.
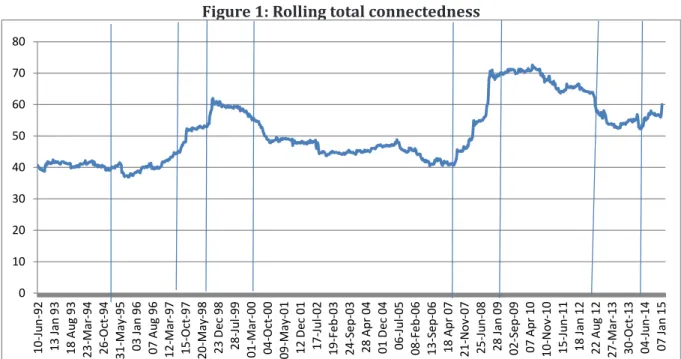
underlying time-varying parameter mechanisms. Rolling windows do, however, require choice of window width, in a manner precisely analogous to bandwidth choice in density estimation. In this paper we focus on a 200-day rolling-sample windows and using 10 days as the predictive horizon for the underlying variance decomposition. As expected, the connectedness index plotted in Figure 1 shows a time-varying pattern over the sample period.
The total volatility connectedness index during the period between 1992 and 1994 was relatively high, 41% on average. After the tequila crisis in 1994, began an upward trend that was successively reinforced by
the Asian crisis (July 1997) and the rubble crisis (August 1998). After reached a peak
in October 1998 there was an obvious downward trend that was strengthened after
the dotcom crash (March 2000) and a period
or relatively stability around the value of 45%. Interestingly, the events of September 11, 2001, and the wars of Afghanistan and Iraq
did not seem to have a significant impact on
total volatility connectedness. Following the subprime crisis and the complete evaporation
of liquidity that initiated the global financial crisis (August 2007), there was an increase in
volatility connectedness that reaches its peak in April 20094, coinciding with a statement by
the European Central Bank (ECB) expressing its fears of a slowdown in financial market integration that triggered a first episode of the
European sovereign crisis. It was only after a forceful response of central by implementing nonstandard monetary policies and the ECB’s President Mario Draghi’s statement that he would do “whatever it takes to preserve the
euro” (July 2012) that there was a substantial
decrease in the level of total connectedness. Finally, after the collapse of the Russian rubble
in June 2014 there was an intensification of connectedness. Our findings are consistent
with earlier literature in that the linkage
between markets intensifies during periods of increasing economic and financial instability (see, e. g., Kolb, 2011), implying a loss of diversification just when it is needed most.
4This finding is in line with to those of Diebold and
Yilmaz (2014) where the total connectedness of select companies in the financial services industry increased during the global financial crisis. Figure 1: Rolling total connectedness
0 10 20 30 40 50 60 70 80 10 -Ju n-92 13 J an 93 18 Au g 93 23 -M ar -94 26 -O ct -94 31 -M ay -9 5 03 J an 96 07 Au g 96 12 -M ar -97 15 -O ct -97 20 -M ay -9 8 23 D ec 98 28 -Ju l-9 9 01 -M ar -00 04 -O ct -00 09 -M ay -0 1 12 D ec 01 17 -Ju l-0 2 19 -F eb -0 3 24 -S ep -0 3 28 A pr 04 01 D ec 04 06 -Ju l-0 5 08 -F eb -0 6 13 -S ep -0 6 18 A pr 07 21 -N ov -07 25 -Ju n-08 28 J an 09 02 -S ep -0 9 07 A pr 10 10 -N ov -10 15 -Ju n-11 18 J an 12 22 Au g 12 27 -M ar -13 30 -O ct -13 04 -Ju n-14 07 J an 15
Note: Vertical lines mark the start of major financial crisis: the tequila crisis (December 1994), the Asian crisis (July 1997), the rubble crisis (August 1998), the dotcom crash (March 2000), the global financial crisis (August 2007), the European sovereign crises (April 2009 and July 2012) and the Russian financial crisis (June 2014).
The dynamic analysis of the total connectedness of returns gave a clear understanding of the dynamics of connectedness over the full sample period, and provides insight into the system as a whole. The next step is to look at the dynamics of directional connectedness over the same period. To better evaluate the differences between the ‘to others’ and ‘from others’ directional connectedness, the evolution of the entire ‘net’ degree distribution is examine in the next section.
3. Net directional connectedness
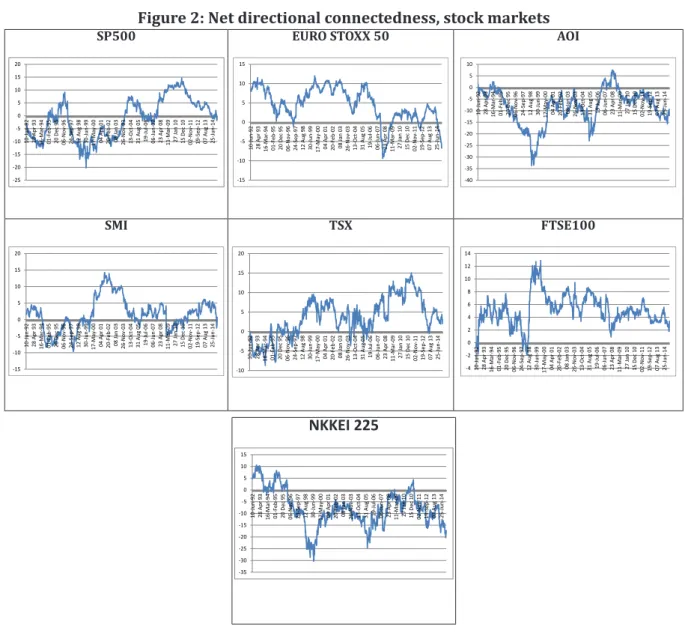
The net directional connectedness index provides information about how much each market’s volatility contributes in net terms to other market’s volatilities and, like the full sample dynamic measure presented in the previous section, also relies on rolling estimation windows. The time varying-indicators are displayed in Figures 3, 4 and 5 for stock markets, exchange-rate markets and national stock markets to exchange-rate market respectively.Figure 2: Net directional connectedness, stock markets
SP500 -25 -20 -15 -10 -5 0 5 10 15 20 10 -Ju n-92 28 A pr 93 16 -M ar -94 01 -F eb -9 5 20 D ec 95 06 -N ov -96 24 -S ep -9 7 12 Au g 98 30 -Ju n-99 17 -M ay -0 0 04 A pr 01 20 -F eb -0 2 08 J an 03 26 -N ov -03 13 -O ct -04 31 Au g 05 19 -Ju l-0 6 06 -Ju n-07 23 A pr 08 11 -M ar -09 27 J an 10 15 D ec 10 02 -N ov -11 19 -S ep -1 2 07 Au g 13 25 -Ju n-14 EURO STOXX 50 -15 -10 -5 0 5 10 15 10 -Ju n-92 28 A pr 93 16 -M ar -94 01 -F eb -9 5 20 D ec 95 06 -N ov -96 24 -S ep -9 7 12 Au g 98 30 -Ju n-99 17 -M ay -0 0 04 A pr 01 20 -F eb -0 2 08 J an 03 26 -N ov -03 13 -O ct -04 31 Au g 05 19 -Ju l-0 6 06 -Ju n-07 23 A pr 08 11 -M ar -09 27 J an 10 15 D ec 10 02 -N ov -11 19 -S ep -1 2 07 Au g 13 25 -Ju n-14 AOI -40 -35 -30 -25 -20 -15 -10 -5 0 5 10 10 -Ju n-92 28 A pr 93 16 -M ar -94 01 -F eb -9 5 20 D ec 95 06 -N ov -96 24 -S ep -9 7 12 Au g 98 30 -Ju n-99 17 -M ay -0 0 04 A pr 01 20 -F eb -0 2 08 J an 03 26 -N ov -03 13 -O ct -04 31 Au g 05 19 -Ju l-0 6 06 -Ju n-07 23 A pr 08 11 -M ar -09 27 J an 10 15 D ec 10 02 -N ov -11 19 -S ep -1 2 07 Au g 13 25 -Ju n-14 SMI -15 -10 -5 0 5 10 15 20 10 -Ju n-92 28 A pr 93 16 -M ar -94 01 -F eb -9 5 20 D ec 95 06 -N ov -96 24 -S ep -9 7 12 Au g 98 30 -Ju n-99 17 -M ay -0 0 04 A pr 01 20 -F eb -0 2 08 J an 03 26 -N ov -03 13 -O ct -04 31 Au g 05 19 -Ju l-0 6 06 -Ju n-07 23 A pr 08 11 -M ar -09 27 J an 10 15 D ec 10 02 -N ov -11 19 -S ep -1 2 07 Au g 13 25 -Ju n-14 TSX -10 -5 0 5 10 15 20 10 -Ju n-92 28 A pr 93 16 -M ar -94 01 -F eb -9 5 20 D ec 95 06 -N ov -96 24 -S ep -9 7 12 Au g 98 30 -Ju n-99 17 -M ay -0 0 04 A pr 01 20 -F eb -0 2 08 J an 03 26 -N ov -03 13 -O ct -04 31 Au g 05 19 -Ju l-0 6 06 -Ju n-07 23 A pr 08 11 -M ar -09 27 J an 10 15 D ec 10 02 -N ov -11 19 -S ep -1 2 07 Au g 13 25 -Ju n-14 FTSE100 -4 -2 0 2 4 6 8 10 12 14 10 -Ju n-92 28 A pr 93 16 -M ar -94 01 -F eb -9 5 20 D ec 95 06 -N ov -96 24 -S ep -9 7 12 Au g 98 30 -Ju n-99 17 -M ay -0 0 04 A pr 01 20 -F eb -0 2 08 J an 03 26 -N ov -03 13 -O ct -04 31 Au g 05 19 -Ju l-0 6 06 -Ju n-07 23 A pr 08 11 -M ar -09 27 J an 10 15 D ec 10 02 -N ov -11 19 -S ep -1 2 07 Au g 13 25 -Ju n-14 NKKEI 225 -35 -30 -25 -20 -15 -10 -5 0 5 10 15 10 -Ju n-92 28 A pr 93 16 -M ar -94 01 -F eb -9 5 20 D ec 95 06 -N ov -96 24 -S ep -9 7 12 Au g 98 30 -Ju n-99 17 -M ay -0 0 04 A pr 01 20 -F eb -0 2 08 J an 03 26 -N ov -03 13 -O ct -04 31 Au g 05 19 -Ju l-0 6 06 -Ju n-07 23 A pr 08 11 -M ar -09 27 J an 10 15 D ec 10 02 -N ov -11 19 -S ep -1 2 07 Au g 13 25 -Ju n-14
Figure 3: Net directional connectedness, exchange-rate markets USD -50 -40 -30 -20 -10 0 10 20 10 -Ju n-92 28 A pr 93 16 -M ar -94 01 -F eb -9 5 20 D ec 95 06 -N ov -96 24 -S ep -9 7 12 Au g 98 30 -Ju n-99 17 -M ay -0 0 04 A pr 01 20 -F eb -0 2 08 J an 03 26 -N ov -03 13 -O ct -04 31 Au g 05 19 -Ju l-0 6 06 -Ju n-07 23 A pr 08 11 -M ar -09 27 J an 10 15 D ec 10 02 -N ov -11 19 -S ep -1 2 07 Au g 13 25 -Ju n-14 EUR -30 -25 -20 -15 -10 -5 0 5 10 15 10 -Ju n-92 28 A pr 93 16 -M ar -94 01 -F eb -9 5 20 D ec 95 06 -N ov -96 24 -S ep -9 7 12 Au g 98 30 -Ju n-99 17 -M ay -0 0 04 A pr 01 20 -F eb -0 2 08 J an 03 26 -N ov -03 13 -O ct -04 31 Au g 05 19 -Ju l-0 6 06 -Ju n-07 23 A pr 08 11 -M ar -09 27 J an 10 15 D ec 10 02 -N ov -11 19 -S ep -1 2 07 Au g 13 25 -Ju n-14 AUD -20 -15 -10 -5 0 5 10 15 10 -Ju n-92 28 A pr 93 16 -M ar -94 01 -F eb -9 5 20 D ec 95 06 -N ov -96 24 -S ep -9 7 12 Au g 98 30 -Ju n-99 17 -M ay -0 0 04 A pr 01 20 -F eb -0 2 08 J an 03 26 -N ov -03 13 -O ct -04 31 Au g 05 19 -Ju l-0 6 06 -Ju n-07 23 A pr 08 11 -M ar -09 27 J an 10 15 D ec 10 02 -N ov -11 19 -S ep -1 2 07 Au g 13 25 -Ju n-14 CHF -20 -15 -10 -5 0 5 10 15 10 -Ju n-92 28 A pr 93 16 -M ar -94 01 -F eb -9 5 20 D ec 95 06 -N ov -96 24 -S ep -9 7 12 Au g 98 30 -Ju n-99 17 -M ay -0 0 04 A pr 01 20 -F eb -0 2 08 J an 03 26 -N ov -03 13 -O ct -04 31 Au g 05 19 -Ju l-0 6 06 -Ju n-07 23 A pr 08 11 -M ar -09 27 J an 10 15 D ec 10 02 -N ov -11 19 -S ep -1 2 07 Au g 13 25 -Ju n-14 CAD -25 -20 -15 -10 -5 0 5 10 15 10 -Ju n-92 28 A pr 93 16 -M ar -94 01 -F eb -9 5 20 D ec 95 06 -N ov -96 24 -S ep -9 7 12 Au g 98 30 -Ju n-99 17 -M ay -0 0 04 A pr 01 20 -F eb -0 2 08 J an 03 26 -N ov -03 13 -O ct -04 31 Au g 05 19 -Ju l-0 6 06 -Ju n-07 23 A pr 08 11 -M ar -09 27 J an 10 15 D ec 10 02 -N ov -11 19 -S ep -1 2 07 Au g 13 25 -Ju n-14 GBP -40 -30 -20 -10 0 10 20 10 -Ju n-92 28 A pr 93 16 -M ar -94 01 -F eb -9 5 20 D ec 95 06 -N ov -96 24 -S ep -9 7 12 Au g 98 30 -Ju n-99 17 -M ay -0 0 04 A pr 01 20 -F eb -0 2 08 J an 03 26 -N ov -03 13 -O ct -04 31 Au g 05 19 -Ju l-0 6 06 -Ju n-07 23 A pr 08 11 -M ar -09 27 J an 10 15 D ec 10 02 -N ov -11 19 -S ep -1 2 07 Au g 13 25 -Ju n-14 JPY -20 -15 -10 -5 0 5 10 15 10 -Ju n-92 28 A pr 93 16 -M ar -94 01 -F eb -9 5 20 D ec 95 06 -N ov -96 24 -S ep -9 7 12 Au g 98 30 -Ju n-99 17 -M ay -0 0 04 A pr 01 20 -F eb -0 2 08 J an 03 26 -N ov -03 13 -O ct -04 31 Au g 05 19 -Ju l-0 6 06 -Ju n-07 23 A pr 08 11 -M ar -09 27 J an 10 15 D ec 10 02 -N ov -11 19 -S ep -1 2 07 Au g 13 25 -Ju n-14
Figure 4: Net directional connectedness, national stock markets to exchange-rate market
USA -15 -10 -5 0 5 10 15 20 25 10 -Ju n-92 28 A pr 93 16 -M ar -94 01 -F eb -9 5 20 D ec 95 06 -N ov -96 24 -S ep -9 7 12 Au g 98 30 -Ju n-99 17 -M ay -0 0 04 A pr 01 20 -F eb -0 2 08 J an 03 26 -N ov -03 13 -O ct -04 31 Au g 05 19 -Ju l-0 6 06 -Ju n-07 23 A pr 08 11 -M ar -09 27 J an 10 15 D ec 10 02 -N ov -11 19 -S ep -1 2 07 Au g 13 25 -Ju n-14 Euro Area -10 -8 -6 -4 -2 0 2 4 6 8 10 -Ju n-92 28 A pr 93 16 -M ar -94 01 -F eb -9 5 20 D ec 95 06 -N ov -96 24 -S ep -9 7 12 Au g 98 30 -Ju n-99 17 -M ay -0 0 04 A pr 01 20 -F eb -0 2 08 J an 03 26 -N ov -03 13 -O ct -04 31 Au g 05 19 -Ju l-0 6 06 -Ju n-07 23 A pr 08 11 -M ar -09 27 J an 10 15 D ec 10 02 -N ov -11 19 -S ep -1 2 07 Au g 13 25 -Ju n-14 Australia -12.0000 -10.0000 -8.0000 -6.0000 -4.0000 -2.0000 0.0000 2.0000 4.0000 6.0000 8.0000 10.0000 10 -Ju n-92 26 -M ay -9 3 11 -M ay -9 4 26 A pr 95 10 A pr 96 26 -M ar -97 11 -M ar -98 24 -F eb -9 9 09 -F eb -0 0 24 J an 01 09 J an 02 24 D ec 02 10 D ec 03 24 -N ov -04 09 -N ov -05 25 -O ct -06 10 -O ct -07 24 -S ep -0 8 09 -S ep -0 9 25 Au g 10 10 Au g 11 25 -Ju l-1 2 10 -Ju l-1 3 25 -Ju n-14 Switzerland -15 -10 -5 0 5 10 15 20 25 30 10 -Ju n-92 28 A pr 93 16 -M ar -94 01 -F eb -9 5 20 D ec 95 06 -N ov -96 24 -S ep -9 7 12 Au g 98 30 -Ju n-99 17 -M ay -0 0 04 A pr 01 20 -F eb -0 2 08 J an 03 26 -N ov -03 13 -O ct -04 31 Au g 05 19 -Ju l-0 6 06 -Ju n-07 23 A pr 08 11 -M ar -09 27 J an 10 15 D ec 10 02 -N ov -11 19 -S ep -1 2 07 Au g 13 25 -Ju n-14 Canada -10.0000 -5.0000 0.0000 5.0000 10.0000 15.0000 20.0000 10 -Ju n-92 26 -M ay -9 3 11 -M ay -9 4 26 A pr 95 10 A pr 96 26 -M ar -97 11 -M ar -98 24 -F eb -9 9 09 -F eb -0 0 24 J an 01 09 J an 02 24 D ec 02 10 D ec 03 24 -N ov -04 09 -N ov -05 25 -O ct -06 10 -O ct -07 24 -S ep -0 8 09 -S ep -0 9 25 Au g 10 10 Au g 11 25 -Ju l-1 2 10 -Ju l-1 3 25 -Ju n-14 UK -8.0000 -6.0000 -4.0000 -2.0000 0.0000 2.0000 4.0000 6.0000 8.0000 10.0000 12.0000 14.0000 10 -Ju n-92 26 -M ay -9 3 11 -M ay -9 4 26 A pr 95 10 A pr 96 26 -M ar -97 11 -M ar -98 24 -F eb -9 9 09 -F eb -0 0 24 J an 01 09 J an 02 24 D ec 02 10 D ec 03 24 -N ov -04 09 -N ov -05 25 -O ct -06 10 -O ct -07 24 -S ep -0 8 09 -S ep -0 9 25 Au g 10 10 Au g 11 25 -Ju l-1 2 10 -Ju l-1 3 25 -Ju n-14
Figure 4: (continued) Japan -25.0000 -20.0000 -15.0000 -10.0000 -5.0000 0.0000 5.0000 10.0000 10 -Ju n-92 26 -M ay -9 3 11 -M ay -9 4 26 A pr 95 10 A pr 96 26 -M ar -97 11 -M ar -98 24 -F eb -9 9 09 -F eb -0 0 24 J an 01 09 J an 02 24 D ec 02 10 D ec 03 24 -N ov -04 09 -N ov -05 25 -O ct -06 10 -O ct -07 24 -S ep -0 8 09 -S ep -0 9 25 Au g 10 10 Au g 11 25 -Ju l-1 2 10 -Ju l-1 3 25 -Ju n-14
Regarding the stock markets, it is noticeable
that in the cases of the Eurostoxx 50 (89.24%), SMI (65.00%), TSX (78.735), FTSE100 (97.46%), more than 50% of the computed
values are positive, indicating that during most of the sample period, the stock market
volatility in these markets influenced that of
the rest of markets, whereas for the remaining stock markets the opposite is true (i.e., they
are net receivers during most of the period).
Interestingly, the SP500 becomes volatility
trigger after the outbreak of the global financial
crisis while Eurostoxx 50 becomes volatility receiver. When we split the sample into crises periods, some interesting patterns emerge.
The Tequila crisis intensified the volatility
spillovers from the US, European and British stock markets. The 1997 Asian crisis seems to have specially affected the US, British and Japanese stock markets, while the rubble crisis
played a significant role in the transmission
of volatility from the European, Canadian and British stock markets. Finally, the successive European sovereign crises especially impacted in volatility transfer from the US, Swiss, Canadian and British stock markets.
As for the exchange-rate markets (Figure 3),
in all the cases under study more than 50% of the computed values are negative, suggesting that during most of the sample period, these markets were importing volatility from the rest
of markets, the GBP standing out as a significant net receiver (with 82.80% of negative values).
Nevertheless, it is interesting to note that for the cases of the USD, EUR, CAD, GBP and JPY at the beginning of the sample there are subperiods of net directional connectedness in volatility to the other markets.
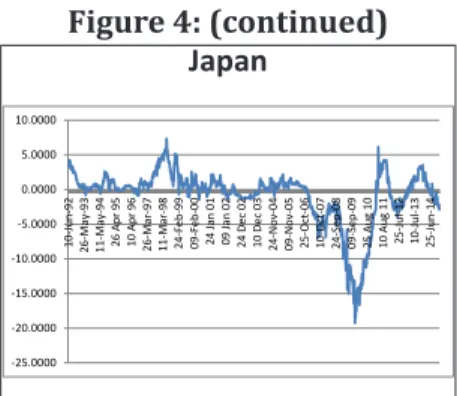
Finally, and in relation to the evolution of the net directional connectedness between the national stock markets and its exchange-rate markets, in Figure 4 we can see that in all the cases more than 50% of the computed values are positive, indicating that during most of the sample period, the volatility in these stock markets crucially determined the volatility registered in their exchange rate markets. It is noticeable the role of net volatility transmitters of the USA, Canada and the UK during the
global financial crisis.
4. Net pair-wise directional
connectedness
So far, we have discussed the behaviour of the total connectedness and total net directional connectedness measures for the fourteen stock and foreign-exchange markets. However, we have also examined their net pair-wise
directional connectedness during the financial
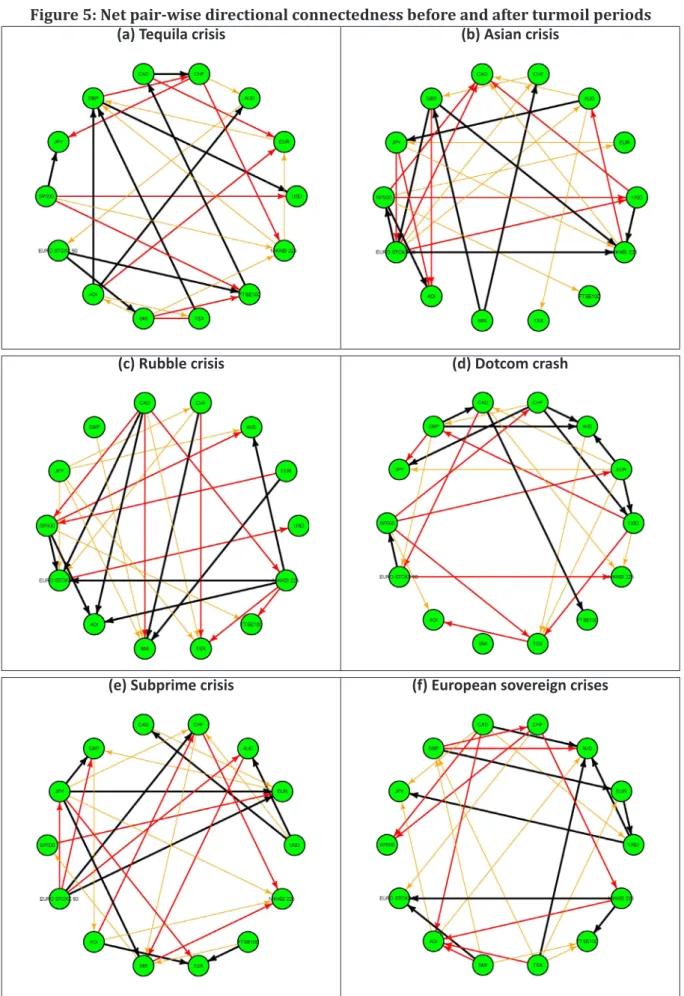
turmoil periods experienced in the sample period. Figure 5 synthetically displays the main results for our dynamic analysis of the net pairwise directional connectedness among the 91 possible pairs formed from the 14 markets under study, focusing on cases where intensity
was especially significant. That is, using of the Diebold and Yilmaz`s (2014) graphical
methodology, we provide a visualization of
the complex network of innovation overflows
among the 14 variables in our sample. The colour of the arrows indicates the intensity of the connectedness among the variables: black, red and yellow links correspond, respectively, to the tenth, twentieth and thirtieth percentiles of all net pairwise directional connections between markets.
Figure 5: Net pair-wise directional connectedness before and after turmoil periods
(a) Tequila crisis (b) Asian crisis
(c) Rubble crisis (d) Dotcom crash
(e) Subprime crisis (f) European sovereign crises
Note: We show the most important directional connections among the 91 possible pairs formed from the
14 markets under study. Black, red and orange links (black, grey and light grey when viewed in grayscale)
Specifically, Figure 5a displays stronger net
pair-wise directional connectedness during the tequila crisis, suggesting that stock markets were the main triggers in the volatility connectedness relationships (representing the
two thirds of the relationships). Conversely,
during the rubble crisis and the dotcom
crash (Figure 5c and 5d), the connectedness
relationships account, respectively, for 63% and 65.22% of the total when exchange-rate markets are the triggers (especially in the thirtieth percentile, where only one relationship is detected departing from stock
markets in both episodes). As for the Asian crisis (Figure 5b), our results suggest an almost
equal distribution of the source of volatility, since 51.85% of the stronger connectedness relationships depart from exchange-rate markets and 48.15% from stock markets.
Interestingly, during the global financial crisis (Figure 5e), only 44.4% of the most intensive
connectedness linkages originated in the stock markets. Finally, during the successive European sovereign crises, the exchange-rate markets are the triggers (representing two thirds of the detected relationships in the tenth
and twentieth percentiles).
5. Concluding remarks.
Several financial as well as currency crises
across emerging markets around the globe
and the advent of floating exchange rate led
the academicians along with practitioners to reconsider the nature of volatility spillovers, between stock and foreign exchange markets, that have seen large correlated movements resulting in market contagion. The recent global
financial crisis of 2007‒2009 has prompted renewed academic interest in financial
market volatility. In this paper we investigated interdependence in volatility using a new method developed by Diebold and Mariano
(2014). We focuses on short-run volatility
interaction effects within a system that compromises the stock and foreign exchange markets of the seven major world economies over the period between 6 July 1988 and 21 January 2015. We especially emphasized
the analysis volatility transmission for the
successive of financial crises registered during
the sample period.
Our study may enhance the understanding of cross-market volatility dynamics in times of both turbulence and calm, and may help to assess the risk of crisis transmission. We stress the paper’s important methodological contribution: that is, the use of the ‘volatility surprise’ component (along with other
traditional measures of volatility) to fully apprehend the sensitivity of financial markets
to volatility shocks.
The main findings of our research can be summarized as follows. In the first step,
we found a system-wide value of 48.75% for the total connectedness between the fourteen markets under study for the full sample period. This level is much lower than that obtained by Diebold and Yilmaz (2012,
2014) for international financial markets and US financial institutions respectively. In the
second step, we analysed the dynamic nature of total net connectedness, obtaining evidence of splillovers showing large variation over time and supporting the literature documenting that volatility across markets increases during unstable periods such as the Asian crisis and
the looming financial crisis in USA and Europe.
In a third step, we examined the time-varying net spillovers across markets, observing in all cases that the variables frequently switch between a net transmitting and a net receiving role. Finally, when analysing net pair-wise directional spillovers, our results suggest that throughout the tequila crisis, stock markets played a dominant role in the transmission of volatility, whereas during the rubble crisis, the
dotcom crash, the global financial crisis and
the European sovereign crises the exchange-rate markets were the main volatility triggers and during the Asian crisis there was an almost equal distribution of the source of volatility between stock markets and exchange-rate markets.
Our results may be of interest to policy-makers, who should take into consideration the spillover effects explained by the dynamic
interdependences among the markets under study. Indeed, the connectedness measure can be used in a static or dynamic context, by showing the state of potential contagion at a certain point in time or a time dependent contagion index, allowing us to identify systemically relevant markets that can be a source of contagion and systemic risk, hence providing a macro-prudential toolbox for measuring the potential contagion using market data that can be adapted to the needs of policymakers by integrating other markets or extending it to real economy variables A natural extension to the analysis presented in this paper would be to explore the main determinants of the detected net directional connectedness, with special emphasis in the economic and institutional factors. This is an item in our future research agenda.
References
Acemoglu, D., Ozdaglar, A. and Tahbaz-Salehi, A. (2015). Systemic risk and stability in
financial networks. American Economic Review, 105, 564-608.
Adler, M. and Dumas, B. (1984). Exposure to currency risk: Definition and measurement.
Financial Management, 13, 41-50.
Adrian, T. and Brunnermeier, M., (2008). CoVaR. Staff Report 348, New York: Federal Reserve
Bank of New York.
Amihud, Y. (1994). Exchange rates and the valuation of equity shares. In Amihud, Y. and Levich, R. M (Eds.) Exchange rates and corporate performance (Irwin, IL: Beard Books), pp. 49-58 Ang, A. and Longstaff, F. A., (2013). Systemic sovereign credit risk: Lessons from the US and
Europe. Journal of Monetary Economics 60, 493-510.
Antonakakisa, N. and Floros, C. (2016): Dynamic interdependencies among the housing
market, stock market, policy uncertainty and the macroeconomy in the United Kingdom, International Review of Financial Analysis, 44, 111–122.
Apostolakisa, G. and Papadopoulos, A. P. (2014). Financial stress spillovers in advanced
economies. Journal of International Financial Markets, Institutions and Money, 32, 128-149.
Awartania, B., Maghyerehb, A.I. and Al Shiabc, M. (2013). Directional spillovers from the U.S.
and the Saudi market to equities in the Gulf Cooperation Council countries. Journal of International Financial Markets, Institutions and Money, 27, 224-242.
Bank for International Settlements (2016). Triennial Central Bank Survey: Foreign exchange turnover in April 2016 (Basel: Switzerland).
Bodnar, G.M. and Gentry, W.M. (1993), Exchange rate exposure and industry characteristics:
evidence from Canada, Japan and the USA, Journal of International Money and Finance, 12: 29-45.
Booth, L., and Rotenberg, W. (1990), Assessing foreign exchange exposure: Theory and applications using Canadian firms, Journal of International Financial Management and Accounting,
2: 1-22.
Branson, W.H. (1976). Portfolio equilibrium and monetary policy with foreign and non-traded assets. In Chaasen, E. and Salin, P. (Eds.) Recent Issues in International Economics (Amsterdam: North Holland), pp. 241-250.
Branson, W.H. (1977). Asset markets and relative prices in exchange rate determination.
Sozialwissenschaafttliche Annalen, 1: 69-89.
Campbell, J. Y. and Shiller, R. J. (1987): Cointegration and tests of present value models.
Journal of Political Economy, 95: 1062-1088.
Caporale, G. M., Pittis, N and Spagnolo, N. (2002). Testing for causality-in-variance: An
application to the East Asian markets. International Journal of Finance and Economics, 7: 235-245.
Chau, F. and Deesomsak, R. (2014). Does linkage fuel the fire? The transmission of financial
stress across the markets. International Review of Financial Analysis, 36, 57–70.
Chinn, M. (1989). A tale of two markets: capital market integration and the determination of exchange rates. In O’Brien, R. and Datta, T. (Eds.) International Economics and Financial Markets (Oxford: Oxford University Press), pp. 193-214.
Cronin, D. (2014). The interaction between money and asset markets: A spillover index
approach. Journal of Macroeconomics, 39, 185-202
Diebold, F. X. and Yilmaz, K. (2012). Better to give than to receive: Predictive directional
measurement of volatility spillovers. International Journal of Forecasting, 28: 57-66.
Diebold, F. X. and Yilmaz, K. (2014). On the network topology of variance decompositions: Measuring the connectedness of financial firms. Journal of Econometrics, 182, 119–134.
Diebold, F. X. and Yilmaz, K. (2015). Financial and Macroeconomic Connectedness: A Network
Approach to Measurement and Monitoring. Oxford: Oxford University Press.
Dumas, B and Solnik, B. (1995). The world price of foreign exchange risk, The Journal of
Finance, 50: 445-479.
Duncan, A. S. and Kabundi, A. (2013). Domestic and foreign sources of volatility spillover to
South African asset classes. Economic Modelling, 31, 566-573.
Fernández-Rodríguez, F., Gómez-Puig, M. and Sosvilla-Rivero, S, (2016). Using connectedness analysis to assess financial stress transmission in EMU sovereign bond market volatility, Journal of
International Financial Markets, Institutions and Money, 43, 126-145.
Glover, B. and Richards-Shubik, S. (2014). Contagion in the European sovereign debt crisis.
Working Paper 20567. Cambridge, MA: National Bureau of Economic Research.
Grosche, S. C. and Heckelei, T. (2016): Directional volatility spillovers between agricultural, crude oil, real estate, and other financial markets, in: Kalkuhl, M., von Braun, J. and Torero, M. (Eds.), Food Price Volatility and Its Implications for Food Security and Policy, Berlin: Springer, pp
183-205
Inci, A. C. and Lee, B. S. (2014), Dynamic relations between stock returns and exchange rate
changes. European Financial Management, 20: 71–106.
Jorion, P. (1990). The exchange-rate exposure of U.S. multinationals. The Journal of Business,
63: 331-345.
Kanas, A. (2000). Volatility spillovers between stock returns and exchange rate changes:
international evidence, Journal of Business Finance and Accounting, 27: 447–467.
Kolb, R. W. (2011). Financial Contagion: The Viral Threat to the Wealth of Nations. Hoboken:
John Wiley & Sons.
Lee, H. C. and Chang, S. L. (2013). Finance spillovers of currency carry trade returns, market
risk sentiment, and U.S. market returns. North American Journal of Economics and Finance, 26, 197-216.
Mishra, A. K., Swain, N. and Malhotra, D, K. (2007). Volatility spillover between stock and
foreign exchange markets: Indian evidence, International Journal of Business, 12: 343-359.
Narayan, P.K. Narayan, S. and Prabheesh K.P. (2014). Stock returns, mutual fund flows and spillover shocks. Pacific-Basin Finance Journal, 29, 146-162.
Roll, R. (1992). Industrial structure and the comparative behavior of international stock
market indices, The Journal of Finance, 47: 3-41,
Sarantis, N. (1987). A dynamic asset market model for the exchange rate of the pound
sterling. Weltwirtschaftliches Archiv, 123: 24-38
of exporting firms, Journal of Banking and Finance, 16: 152–182.
Shiller, R. J. (1981). Do stock prices move too much to be justified by subsequent changes in dividends? American Economic Review, 71: 421-436.
Smith, C. (1992). Stock markets and the exchange rate: A multi-country approach., Journal of
Macroeconomics, 14 : 607-629.
Tsai, I.C. (2014). Spillover of fear: Evidence from the stock markets of five developed
countries. International Review of Financial Analysis, 33, 281-288.
Yang, S-Y and Doong; S-C (2004) Price and volatility spillovers between stock prices and
exchange rates: Empirical evidence from the G-7 countries. International Journal of Business and Economics, 3: 139-153.
Yilmaz, K. (2010). Return and volatility spillovers among the East Asian equity markets.
Journal of Asian Economics, 21, 304-313.
Walid, C., Chaker, A., Masood, O and Fry, J. (2011). Stock market volatility and excgange rates
in emerging countries: A Markov-state switching approach. Emerging Markets Review, 12: 272-202.
Wang, Y-C, Wu, J-L and Lai, Y-H (2013). A revisit to the dependence structure between the
stock and foreign exchange markets: A dependence-switching copula approach. Journal of Banking and Finance, 37: 1706–1719.
Zhou, X., Zhang, W. and Zhang, J. (2012). Volatility spillovers between the Chinese and world equity markets. Pacific-Basin Finance Journal, 20, 247-270.
Últimos títulos publicados
OCCASIONAL PAPERS
OP01/16 Borrell, Josep; Mella, José María; Melle, Mónica; Nieto, José Antonio. “¿Es posible otra Euro-pa? Debate abierto.”
WORKING PAPERS
WP03/16 García Sánchez, Antonio; Molero, José; Rama, Ruth: Patterns of local R&D cooperation of foreign subsidiaries in an intermediate country: innovative and structural factors.
WP02/16 Gómez-Puig, Marta; Sosvilla-Rivero, Simón: Debt-growth linkages in EMU across countries and time horizon.
WP01/16 Rodríguez, Carlos; Ramos, Javier: El sistema español de Garantía Juvenil y Formación Pro-fesional Dual en el contexto de la Estrategia Europea de Empleo.
Desempleo Juvenil en España. Vol 2. Ruiz-Gálvez Juzgado, María Eugenia; Rodríguez Crespo, Carlos.
Desempleo Juvenil en España. Vol 1. Ramos, Javier; Vicent Valverde, Lucía; Recuenco-Vegas, Luis: Desem-pleo Juvenil en España.
WP05/15 Pérez Pineda, Jorge Antonio; Alañón Pardo, Ángel: Mediciones alternativas de la coopera-ción internacional para el desarrollo en el contexto de la agenda post 2015.
WP04/15 Fernández-Rodríguez, Fernando; Gómez-Puig, Marta; Sosvilla-Rivero, Simón: Volatility spi-llovers in EMU sovereign bond markets.
WP03/15 Stupariu, Patricia; Ruiz, Juan Rafael; Vilariño, Angel: Reformas regulatorias y crisis de los modelos VaR.
WP02/15 Sosvilla, Simón; Ramos, María del Carmen: De facto exchange-rate regimes in Central and Eastern European Countries
WP01/15 Fernández, Fernando; Gómez, Marta; Sosvilla, Simón: Financial stress transmission in EMU sovereign bond market volatility: A connectedness analysis.
WP08/14 Albis, Nadia; Álvarez, Isabel: Desempeño innovador de las subsidiarias de empresas multina-cionales en la industria manufacturera de Colombia
WP07/14 Pérez, Luis; Hernández, Julio; Berumen, Sergio: La motivación extrínseca del profesorado universitario en Alemania y en España: un análisis empírico.
WP06/14 Donoso, Vicente; Martín, Víctor; Minondo, Asier: Exposure to Chinese imports and local la-bor market outcomes. An Analysis for Spanish provinces
WP05/14 Donoso, Vicente; Martín, Victor; Minondo, Asier: Import competition from China and un employment. An analysis using Spanish workers’micro-data.
WP04/14 Stupariu, Patricia; Vilariño, Ángel: Retos y carencias de la regulación financiera internacio -nal.
WP03/14 García, Antonio; Molero, José; Rama, Ruth: Foreign MNEs and domestic innovative capabili-ties: are there conditions for reverse spillovers in the spanish industry
WP 02/14 Sosvilla Rivero, Simón; Ramos Herrera, María del Carmen: On the forecast accuracy and consistency of exchange rate expectations: The Spanish PwC Survey
WP01/14 Kropacheva, Anna; Molero, José: Russian technological specialization in terms of world’s innovation changes during 1994-2008. Comparison with countries of BRIC and European Innovation-driven economies.
WP 07/13 Sanchís, Raúl G.: Extended theory about the allocation of the time. Description and applica-tion to the increase in the retirement age policies.
WP 06/13 Morales-Zumaquero, Amalia; Sosvilla-Rivero, Simón: Real exchange rate volatility, finan -cial crises and nominal exchange regimes.
WP 05/13 Álvarez, Isabel; Labra, Romilio: Identifying the role of natural resources in knowledge-based strategies of development.
WP 04/13 Alonso Gallo, Nuria; Trillo del Pozo, David: La respuesta de la regulación prudencial a la 29 crisis: Basilea II.
WP 05/13 Sosvilla-Rivero, Simón; Ramos-Herrera, María del Carmen: On the forecast and consis- tency of exchange rate expectations: The Spanish PwC Survey.
WP 04/12 Sosvilla-Rivero, Simón; Morales-Zumaquero, Amalia: Real exchange rate volatility, financial crises and nominal exchange regimes.
WP 03/13 Revuelta, Julio; Alonso, Fernando:Presencia de las multilatinas en Europa. Tipología y es-trategia empresarial.
WP 02/13 Nicolau Ibarra, Ignacio: Evolución de la cooperación española en El Salvador.
WP 01/13 Monedero, Juan Carlos; Jerez, Ariel; Ramos, Alfredo; Fernández, Jose Luis: Participación ciudadana y Democracia. Una revisión de las mejores experiencias Iberoamericanas.
WP 05/12 Sanchís, Raúl G.: Trying to escape the Malaise State in the future.A macroecnomic design to hinder another Great Recession which risks the Welfare State.
WP 04/12 Basave Kunhardt, J., Flujos de IED mexicana hacia Europa y presencia de grandes multina-cionales mexicanas en España. Evidencia empírica y reflexiones teóricas.
WP 03/12 Luengo Escalonilla, F., Gracia Santos, M., Vicent Valverde, L., Productividad y Posicionamien-to Esctructural en la industria de bienes de equipo española.
WP 02/12 Alonso (dir.), José A.; Castillo, Alberto; García, Héctor; Ospina, Shirley; Aguirre, Pablo;
Millán, Natalia; Santander, Guillermo: Estimación de la ayuda española a la infancia: una
propuesta metodológica.
WP 01/12 Alonso (dir.), José A.; Aguirre, Pablo; Castillo, Alberto: La cooperación al desarrollo y la infancia. Apuntes estratégicos para el caso de España.
WP 09/11 Torrecillas, Celia; Fischer, Bruno B.: Technological Attraction of FDI flows in Knowledge-In -tensive Services: a Regional Innovation System Perspective for Spain.
WP 08/11 Gómez-Puig, Marta; Sosvilla-Rivero, Simón: Causality and contagion in peripheral emu public debt markets: a dynamic approach.
WP 07/11 Sosvilla-Rivero, Simón; Ramos-Herrera, María del Carmen: The US Dollar-Euro exchange rate and US-EMU bond yield differentials: A Causality Analysis.
WP 06/11 Sosvilla-Rivero, Simón; Morales-Zumaquero, Amalia: Volatility in EMU sovereign bond yields: Permanent and transitory components .
WP 05/11 Castellacci, Fulvio; Natera, José Miguel: A new panel dataset for cross-country analyses of national systems, growth and development (CANA).
WP 04/11 Álvarez, Isabel; Marín, Raquel; Santos-Arteaga, Franciso J.: FDI entry modes, development and technological spillovers.
WP 03/11 Luengo Escalonilla,Fernando: Industria de bienes de equipo: Inserción comercial y cambio estructural.
WP 02/11 Álvarez Peralta, Ignacio; Luengo Escalonilla,Fernando: Competitividad y costes laborales en la UE: más allá de las apariencias.
WP 01/11 Fischer, Bruno B; Molero, José: Towards a Taxonomy of Firms Engaged in International R&D Cooperation Programs: The Case of Spain in Eureka.
WP 09/10 Éltető, Andrea: Foreign direct investment in Central and East European Countries and Spain – a short overview.
WP 08/10 Alonso, José Antonio; Garcimartín, Carlos: El impacto de la ayuda internacional en la cali-dad de las instituciones.
WP 07/10 Vázquez, Guillermo: Convergencia real en Centroamérica: evidencia empírica para el perío-do 1990-2005.
WP 06/10 P. Jože; Kostevc, Damijan, Črt; Rojec, Matija: Does a foreign subsidiary’s network status affect its innovation activity? Evidence from post-socialist economies.
WP 05/10 Garcimartín, Carlos; Rivas Luis; García Martínez, Pilar: On the role of relative prices and cap-ital flows in balance-of-payments constrained growth: the experiences of Portugal and Spain in the euro area.
WP 04/10 Álvarez, Ignacio; Luengo, Fernando: Financiarización, empleo y salario en la UE: el impacto de las nuevas estrategias empresariales.
WP 03/10 Sass, Magdolna: Foreign direct investments and relocations in business services – what are the locational factors? The case of Hungary.
WP 02/10 Santos-Arteaga, Francisco J.: Bank Runs Without Sunspots.
WP 01/10 Donoso, Vicente; Martín, Víctor: La sostenibilidad del déficit exterior de España.
WP 14/09 Dobado, Rafael; García, Héctor: Neither so low nor so short! Wages and heights in eighteenth and early nineteenth centuries colonial Hispanic America.
WP 13/09 Alonso, José Antonio: Colonisation, formal and informal institutions, and development. WP 12/09 Álvarez, Francisco: Opportunity cost of CO2 emission reductions: developing vs. developed
economies.
WP 11/09 J. André, Francisco: Los Biocombustibles. El Estado de la cuestión.
WP 10/09 Luengo, Fernando: Las deslocalizaciones internacionales. Una visión desde la economía críti-ca.
WP 09/09 Dobado,Rafael; Guerrero, David: The Integration of Western Hemisphere Grain Markets in the Eighteenth Century: Early Progress and Decline of Globalization.
WP 08/09 Álvarez, Isabel; Marín, Raquel; Maldonado, Georgina:Internal and external factors of com-petitiveness in the middle-income countries.
WP 07/09 Minondo, Asier: Especialización productiva y crecimiento en los países de renta media. WP 06/09 Martín, Víctor; Donoso, Vicente: Selección de mercados prioritarios para los Países de Renta
Media.
WP 05/09 Donoso, Vicente; Martín, Víctor: Exportaciones y crecimiento económico: estudios empíricos. WP 04/09 Minondo, Asier; Requena, Francisco: ¿Qué explica las diferencias en el crecimiento de las
exportaciones entre los países de renta media?
WP 03/09 Alonso, José Antonio; Garcimartín, Carlos: The Determinants of Institutional Quality. More on the Debate.
WP 02/09 Granda, Inés; Fonfría, Antonio: Technology and economic inequality effects on international trade.
WP 01/09 Molero,José;Portela, Javier y ÁlvarezIsabel: Innovative MNEs’ Subsidiaries in different do-mestic environments.
WP 08/08 Boege, Volker; Brown, Anne; Clements, Kevin y Nolan Anna: ¿Qué es lo “fallido”? ¿Los Esta-dos del Sur,o la investigación y las políticas de Occidente? Un estudio sobre órdenes políticos híbridos y los Estados emergentes.
WP 07/08 Medialdea García, Bibiana; Álvarez Peralta, Nacho: Liberalización financiera internacional, inversores institucionales y gobierno corporativo de la empresa.
WP 06/08 Álvarez, Isabel; Marín, Raquel: FDI and world heterogeneities: The role of absorptive capaci-ties.
WP 05/08 Molero, José; García, Antonio: Factors affecting innovation revisited. WP 04/08 Tezanos Vázquez, Sergio: The Spanish pattern of aid giving.
WP 03/08 Fernández, Esther; Pérez, Rafaela; Ruiz, Jesús: Double Dividend in an Endogenous Growth Model with Pollution and Abatement.
WP 02/08 Álvarez, Francisco; Camiña, Ester: Moral hazard and tradeable pollution emission permits.
WP 01/08 Cerdá Tena, Emilio; Quiroga Gómez, Sonia: Cost-loss decision models with risk aversion.
WP 05/07 Palazuelos, Enrique; García, Clara: La transición energética en China.
WP 04/07 Palazuelos, Enrique: Dinámica macroeconómica de Estados Unidos: ¿Transición entre dos recesiones?
WP 03/07 Angulo, Gloria: Opinión pública, participación ciudadana y política de cooperación en Es-paña.
WP 02/07 Luengo, Fernando; Álvarez, Ignacio: Integración comercial y dinámica económica: España ante el reto de la ampliación.
WP 01/07 Álvarez, Isabel; Magaña, Gerardo: ICT and Cross-Country Comparisons: A proposal of a new composite index.
WP 05/06 Schünemann, Julia: Cooperación interregional e interregionalismo: una aproximación so-cial-constructivista.
WP 04/06 Kruijt, Dirk: América Latina. Democracia, pobreza y violencia: Viejos y nuevos actores. WP 03/06 Donoso, Vicente; Martín, Víctor: Exportaciones y crecimiento en España (1980-2004):
Coin-tegración y simulación de Montecarlo.
WP 02/06 García Sánchez, Antonio; Molero, José: Innovación en servicios en la UE: Una aproximación a la densidad de innovación y la importancia económica de los innovadores a partir de los datos agregados de la CIS3.
WP 01/06 Briscoe, Ivan: Debt crises, political change and the state in the developing world.
WP 06/05 Palazuelos, Enrique: Fases del crecimiento económico de los países de la Unión Europea–15. WP 05/05 Leyra, Begoña: Trabajo infantil femenino: Las niñas en las calles de la Ciudad de México. WP 04/05 Álvarez, Isabel; Fonfría, Antonio; Marín Raquel: The role of networking in the
competi-tive-ness profile of Spanish firms.
WP 03/05 Kausch, Kristina; Barreñada, Isaías: Alliance of Civilizations. International Security and Cos-mopolitan Democracy.
WP 02/05 Sastre, Luis: An alternative model for the trade balance of countries with open economies: the Spanish case.
WP 01/05 Díaz de la Guardia, Carlos; Molero, José; Valadez, Patricia: International competitiveness in services in some E