DOI.org/10.5281/zenodo.1119147 УДК 697.972
Samui P., Вocharova A.
PIJUSH SAMUI, AssociateProfessor, Department of Civil Engineering, e-mail: [email protected]
National Institute of Technology Patna Patna, Bihar India, 80005
ANNA BOCHAROVA, Chief of Mechanics and Mathematical Modeling Department, e-mail: [email protected]
Far Eastern Federal University
8 Sukhanova St., Vladivostok, Russia, 690091
Modeling of compressive strength of masonry structure using relevance
vector machine and minimax probability machine regression
Abstract: Compressive Strength (f) of masonry structure is a key parameter for designing masonry
struc-ture. This article employs Relevance Vector Machine (RVM) and Minimax Probability Machine Regres-sion (MPMR) for estimation of compressive strength (f) of a masonry structure. RVM is a Bayesian mod-el. MPMR is constructed based on the concept of Minimax Probability Machine Classification. Mortar compressive strength (fm), and brick compression strength (fb) are used as inputs of the RVM and MPMR.
The output of RVM and MPMR is f. The results of RVM and MPMR have been compared with the other models. The results show that the developed RVM and MPMR are useful tools for estimation of f of ma-sonry structure.
Key words:compressive strength, masonry structure, relevance vector machine, minimax probability ma-chine regression.
Compressive strength (f) of a masonry structure is a key parameter for designing masonry struc-ture. Researchers gave different analytical models for estimation of f [2, 3, 8, 10, 13]. The available ana-lytical models are not so reliable [20]. Different empirical models are also available for determination of f [1, 5, 7, 16]. Artificial Neural Network (ANN) and fuzzy logic were examined for prediction of f of a masonry structure [9]. However, ANN is not a perfect model [12, 18].
This article adopts Relevance Vector Machine (RVM) and Minimax Probability Machine Regres-sion (MPMR) have used for estimation of f of a masonry structure. RVM was developed based on Bayes-ian concept [22, 23]. Many problems have been solved by RVM [24–26]. MPMR was developed based on the kernel formulation [14, 17, 19]. The predicted output from the MPMR will be within some bound of the true regression function. RVM and MPMR use the database of Roca et al. [9]. The dataset consist the value of mortar compressive strength (fm), brick compression strength (fb) and f. The results of RVM
and MPMR have been compared with the ANN and fuzzy logic models. In RVM, the basic equation is given below for estimation of output(y):
N i i iK x x w y 1 , , (1)© Samui P., Bocharova A., 2017
About the article: Received: 30.10.2017; financing: budgets: National Institute of Technology, India and Far
East-ern Federal University, Russia.
where N represents the number of samples, wi is weight, x denotes input variable and K(xi,x) is kernel
function. This article uses fm and fb as inputs of the RVM. The output of RVM is f.
So, x
fm,fb
and y
f .In RVM, a Gaussian prior is assumed on wi. The Gaussian prior has zero mean and hyperparameters
( 1
i
) variance. RVM uses iterative formulae for hyperparameter estimation [15]. In RVM, nonzero weights are called relevant vectors. The details of RVM have been obtained from Tipping (2000, 2001) [22, 23].
To develop the above mentioned RVM, 76 out of 96 dataset have been taken as training dataset. The remaining 20 datasets have been used to examine the capability of model. These datasets are called testing dataset. This article adopts normalization between 0 and 1. This study employs Radial basis
func-tion (
2 2 exp , T i i i x x x x x xK , is the width of radial basis function) as kernel function. Dif-ferent kernel functions (radial basis function, polynomial and spline) have been examined to get best per-formance. However, radial basis function gives best perper-formance. The program of RVM has been im-plemented in MATLAB.
A brief description of MPMR for prediction of f of a masonry structure. In MPMR model, the basic formulation is given below
N i i iK x x b y 1 , , (2) where y denotes output, x denotes input, K(xi,x) represents kernel function, N represents number of data,i and b are output of the MPMR algorithm. MPMR uses fm and fb as inputs. f is the output of MPMR.
Hence, x
fm,fb
and y
f .Strohmann and Grudic [20] gave the procedure for estimation of i and b. In MPMR, it
deter-mines a bound on the probability that the regression model is within
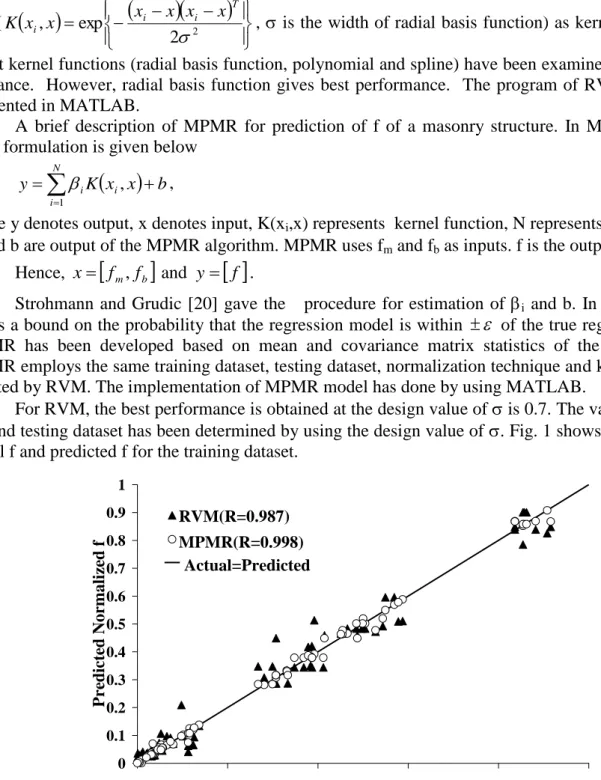
of the true regression function. MPMR has been developed based on mean and covariance matrix statistics of the regression data. MPMR employs the same training dataset, testing dataset, normalization technique and kernel function as adopted by RVM. The implementation of MPMR model has done by using MATLAB.For RVM, the best performance is obtained at the design value of is 0.7. The value of f of train-ing and testtrain-ing dataset has been determined by ustrain-ing the design value of . Fig. 1 shows the plot between actual f and predicted f for the training dataset.
Fig. 1. Plot between Actual f and predicted f for training dataset.
0 0.1 0.2 0.3 0.4 0.5 0.6 0.7 0.8 0.9 1 0 0.2 0.4 0.6 0.8 1 Actual Normalized f Predicted Normali zed f RVM(R=0.987) MPMR(R=0.998) Actual=Predicted
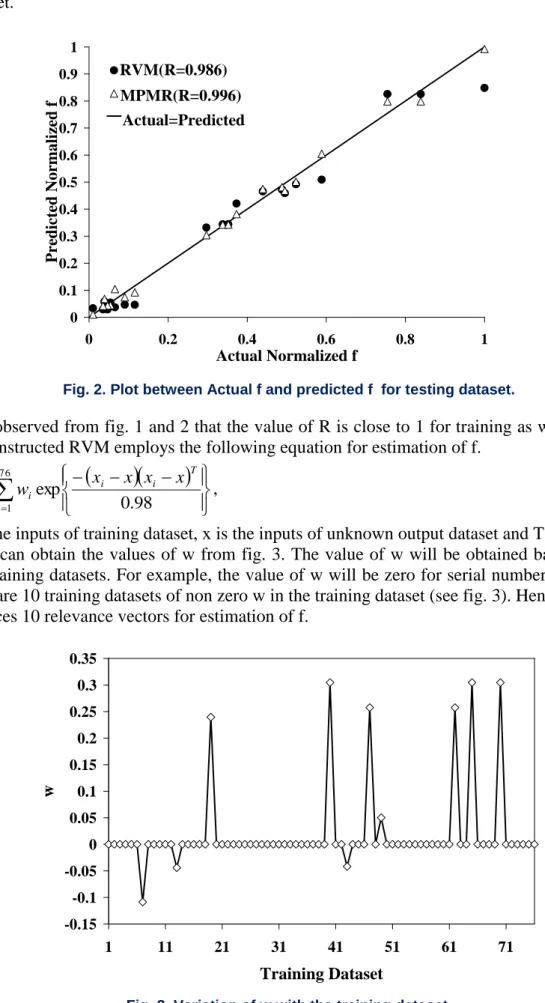
The value of Coefficient of Correlation (R) has been determined to assess the performance of RVM and MPMR. For a good model, the value of R is close to one. Fig. 2 depicts the performance of testing dataset.
Fig. 2. Plot between Actual f and predicted f for testing dataset.
It is observed from fig. 1 and 2 that the value of R is close to 1 for training as well as testing da-taset. The constructed RVM employs the following equation for estimation of f.
76 1 0.98 exp i T i i i x x x x w f , (3) where xi is the inputs of training dataset, x is the inputs of unknown output dataset and T is transpose.User can obtain the values of w from fig. 3. The value of w will be obtained based on the serial number of training datasets. For example, the value of w will be zero for serial number 1 of training da-taset. There are 10 training datasets of non zero w in the training dataset (see fig. 3). Hence, the developed RVM produces 10 relevance vectors for estimation of f.
Fig. 3. Variation of w with the training dataset. 0 0.1 0.2 0.3 0.4 0.5 0.6 0.7 0.8 0.9 1 0 0.2 0.4 0.6 0.8 1 Actual Normalized f Predicted Normali zed f RVM(R=0.986) MPMR(R=0.996) Actual=Predicted -0.15 -0.1 -0.05 0 0.05 0.1 0.15 0.2 0.25 0.3 0.35 1 11 21 31 41 51 61 71 Training Dataset w
For MPMR, the best performance is obtained at = 0.45 and = 0.002 . The value of f of training and testing datasets has been determined by using = 0.45 and =0.002. Fig. 1 illustrates plot between actual f and predicted f for training dataset. Fig. 2 shows the plot between actual f and predicted f for test-ing dataset. It is clear from figures 1 and 2 that the developed MPMR predicts f reasonable well for train-ing as well as testtrain-ing datasets. Therefore, the developed MPMR shows his ability for estimation of f.
The results of constructed RVM, MPMR have been compared with the other models [7–9, 13, 24–26]. Table depicts the value of mean and standard deviation of the
real proposed
f f
. The performance of de-veloped MPMR and RVM is almost identical with the ANN. However, the dede-veloped MPMR and RVM outperform the other methods. ANN uses many design parameters compare to the RVM (design parame-ter = ) and MPMR (design parameter = and ). RVM has no control on the predicted f for future da-tasets. However, the developed MPMR has control on the predicted f for future dada-tasets. RVM uses only some parts of training data (called relevance vector) for estimation of f. However, ANN and MPMR adopt all training dataset for determination of f.
Values of mean and standard deviation of the different models
Method Mean Standard Deviation
Mann (1982) 1.19 0.22 Dayaratnam (1987) 0.32 0.22 Kaushik et al. (2007) 0.48 0.34 Dymiotis et al. (2007) 0.79 0.37 Eurocode 6 (1998) 0.57 0.34 ACI 530.99 (1999) 0.29 0.32
ANN (Roca et al., 2013) 1.02 0.35
Fuzzy Logic(Roca et al., 2013) 1.09 0.34
Linear Regression (Roca et al., 2013) 1.22 1.52
RVM 1.03 0.37
MPMR 1.01 0.40
This study describes RVM and MPMR models for estimation of f of a masonry structure. The de-veloped RVM and MPMR give reasonable performance. MPMR employs convex optimization for pre-diction of f. Advantage of RVM is that it produces sparse solution. The results of the developed models (RVM and MPMR) have been compared with the other models. In summary, it can be concluded that the developed RVM and MPMR are new reliable tools for estimation of f of a masonry structure.
REFERENCES
1. ACI committee 530. Building code requirements for masonry structure. American Concrete Institute, Farmington Hills, MI; 1999.
2. Atkinson R.H., Noland J.L., Abrams D.P. A deformation theory for stack bonded masonry prisms in com-pression. Proc., 7th int. brick masonry conf., Melbourne, Melbourne Univ., 1982, p. 565-576.
3. Binda L., Fontana A., Frigerio G. Mechanical behaviour of brick masonries derived from unit and mortar characteristics. Proc. of the 8th international brick/block masonry conf, Dublin, 1988, pp. 205-216.
4. Dayaratnam P. Brick and reinforced brick structures. Oxford and IBH, New Delhi, 1987.
5. Department of transport. The assessment of highway bridges and structures. British Standard BD 21/93, Her Majesty’s Stationery Ofc., London, 1993.
6. Dymiotis C., Gutlederer B.M. Allowing for uncertainties in the modeling of masonry compressive strength. Constr Build Mater, 2007;16(7):1385–1393.
7. ENV 1996-1-1. Eurocode no. 6 Design of masonry structures, Part 1-1: general rules for buildings-rules for reinforced and un-reinforced masonry, 1998.
8. Francis A.J., Horman C.B., Jerrems L.E. The effect of joint thickness and other factors on the compressive strength of brickwork. Proc. of the 2nd int. brick masonry conf. Stoke-on-Trent, UK, British Ceramic Re-search Association, West HWH, Speed KH editors, 1971, p. 31-37.
9. Hilsdorf H.K. Investigation into the failure mechanism of brick masonry loaded in axial compression. De-signing, engineering and constructing with masonry products. Gulf Publishing Company, 1969:34-41. 10. Julio Garzón-Roca, Creu Obrer Marco, Jose Adam M. Compressive strength of masonry made of clay
bricks and cement mortar: Estimation based on Neural Networks and Fuzzy Logic. Engineering Struc-tures, 2013;48:21–27.
11. Kaushik H.B., Rai D.C., Jain S.K. Stress-strain characteristics of clay brick masonry under uniaxial com-pression. J. Mater Civil Eng. 2007;19(9):728-39.
12. Kecman V. Learning and Soft Computing: Support Vector Machines, Neural Networks, and Fuzzy Logic Models. Cambridge, Massachusetts, London, England, the MIT Press, 2001.
13. Khoo C.L., Hendry A.W. A failure criterion for brickwork in axial compression. Proc., 3rd int. brick ma-sonry conference. Foertig L., Gobel K., editors, 1973, p. 139-145.
14. Lanckriet G.R.G., Ghaoui L.E., Bhattacharyya C., Jordan M.I. Minimax probability machine. T.G. Diet-terich, S. Becker, and Z. Ghahramani, editors. Advances in Neural Information Processing Systems 14. Cambridge, MA, MIT Press, 2002.
15. MacKay D.J., Bayesian methods for adaptive models. Ph.D. thesis. Pasadena, Calif, Dep. of Comput. and Neural Sysyt., Calif Inst. of Technol., 2001.
16. Mann W. Statistical evaluation of tests on masonry by potential functions. Sixth international brick ma-sonry conference, 1982.
17. Marshall A.W., Olkin W. Multivariate chebyshev inequalities. Annals of Mathematical Statistics. 1960; 31(4):1001-1014.
18. Park D., Rilett L.R. Forecasting freeway link ravel times with a multi-layer feed forward neural network. Computer Aided Civil and infra Structure Engineering. 1999; 14:358-367.
19. Popescu I., Bertsimas D. Optimal inequalities in probability theory: a convex optimization approach. Technical Report TM62, INSEAD, Dept. Math. O.R., Cambridge, Mass, 2001.
20. Sarangapani G., Venkatarama Reddy B.V., Jagadish K.S. Brick-mortar bond and masonry compressive strength. J. Mater Civil Eng. 2005;17(2):229–237.
21. Strohmann T.R., Grudic G.Z. Minimax probability machine regression. Advances in Neural Information Processing Systems (NIPS). 2003:15.
22. Tipping M.E. The relevance vector machine. Advances in Neural Information Processing Systems. 2000; 12:625-658.
23. Tipping M.E. Sparse Bayesian learning and the relevance vector machine. J. of Machine Learning Re-search. 2001; 211-244.
24. Wang T., Li Y., Wang H., Wang P. A RVM reliability analysis model for wireless sensor of networked synchronization control system. J. of Information and Computational Science. 2012;9(17):5345-5351. 25. Zhang Z., Cui J. Network intrusion detection based on robust wavelet RVM algorithm. J. of Information
and Computational Science. 2011;8(14):2983-2989.
26. Zhou Y., Bao Y. Structural damage detection by integrating non-negative matrix factorization and rele-vance vector machines. Applied Mechanics and Materials. 2013;249-250:137-146.
DOI.org/10.5281/zenodo.1119147 УДК 52-17