Hospital Boards and Quality Dashboards
Eugene Kroch, PhD,* Thomas Vaughn, PhD,
Þþ
Mark Koepke, JD, MHA,§ Sheila Roman, MD,§
David Foster, PhD,|| Sunil Sinha, MD, MBA,§ and Samuel Levey, PhD, SM
þ
Introduction:Dashboards/scorecards have emerged as a vital tool for hospital leaders who are interested in promoting quality improvement (QI) within their institutions. As part of a collaboration between the University of Iowa College of Public Health, Depart-ment of Health ManageDepart-ment and Policy (HMP) CareScience, and the Centers for Medicare and Medicaid Services (CMS), researchers analyzed a set of hospital board performance measurement summary reports (dashboards) and their relationship to leadership engagement and QI in 9 states across the United States. The goals were to assess the content and composition of hospital board dashboards, to examine how board dashboards are created and used by various constituencies in the hospital, and to explore the relationship between dashboards and hospital performance to identify, in a preliminary way, those structures and processes related to dashboards systems that most directly influence QI.
Methodology:Of the 139 hospitals that supplied their dashboards, 109 completed an internet-based Dashboard Implementation Survey that addressed the development and utilization of dashboards in the hospitals. The survey instrument was developed and pretested by a group of survey experts and researchers from CMS, CareScience, and HMP. The analyses of the dashboard content and implementation were linked to hospital performance data from CareScience and Solucient, 2 healthcare performance measurement system vendors with expertise in performance data analysis, modeling, and reporting that collaborated with HMP and CMS in this study. Both measurement systems are used to rank hospitals on a composite of measures. The systems use hospital-specific, risk-adjusted results for inpatient mortality, complications, patient safety, adverse outcomes, length of stay, and other selected measurements to represent a broad indicator of hospital performance.
Findings:The Dashboard Implementation Survey showed that there are some commonalties in the way that dashboards are created and used. First, the majority of hospitals in the study include Hospital Compare measures in their dashboards. Second, dashboards typi-cally are shared widely within the organization, although with dif-fering frequencies. Third, dashboard content derives from multiple constituencies, although its development is generally directed by the executive and by the QI staff. Finally, dashboards are usually geared more toward the creation of general awareness and focus than used
for operational and performance management. The patterns revealed that greater hospital quality was linked to shorter, more focused dashboards, active use of dashboards for operations management, and strong influence of board quality committees in dashboard content and implementation.
Discussion and Recommendations: This study found much variation in dashboard content and in the implementation practices associated with them. The suggested relationship of dashboard content, development, and implementation practices to observed hospital performance is worth noting. Further research relating these preliminary findings to quality performance would enable the identification of characteristics of dashboards that are most useful in supporting hospital leadership in its QI activities.
Key Words:hospital quality performance, dashboards, scorecards (J Patient Saf 2006;2:10Y19)
H
ospital boards are under greater scrutiny than ever before when it comes to quality oversight, and recent activities at the national level have further encouraged hospital boards to engage in quality improvement (QI). In 1999, the Institute of Medicine published the first installment in the landmark series,To Err is Human,1Crossing the Quality Chasm,2and Leader-ship by Example.3In 2002, Congress passed the Sarbanes-Oxley legislation that decreed that Boards of Directors have ultimate responsibility for the quality of care provided by the institution. In 2005, the importance of clinical quality was further emphasized when the Centers for Medicare & Medicaid Services (CMS), in collaboration with the Hospital Quality Alliance (HQA), initiated the Hospital Compare Web site (www.hospitalcompare.hhs.gov),4which publicly reports clin-ical quality measures on a range of conditions, thereby providing boards with new tools to review hospital quality in selected areas and push for system-level improvements where warranted.
In 2004, the National Quality Forum (NQF) released a set of principles entitledA Call to Responsibility,5aimed at encouraging hospital governing boards to actively engage in QI at their institutions. These principles call on boards to ensure the quality of health care provided at their institutions by examining their own role in enhancing quality and by educating themselves in patient safety, clinical care, and performance measurement. The principles include recom-mendations that hospital boards oversee and be accountable for their institutions’ participation and performance in national quality measurement efforts and subsequent QI activities.
Also in 2004, CMS began collaborating with the Department of Health Management and Policy (HMP) at the University of Iowa College of Public Health, CareScience, and several state hospital associations to investigate the extent
From the *CareScience and the Wharton School of the University of Pennsylvania, Philadelphia, Pennsylvania; †Iowa City Veterans Inte-grated Health System;‡The University of Iowa College of Public Health, Iowa City, Iowa; §Centers for Medicare & Medicaid Services, Baltimore, Maryland; and ||Solucient, Inc., Evanston, Illinois.
Dr. Vaughn is a senior scientist in the Center for Research on the Im-plementation of Innovative Strategies in Practice, a Veterans Affairs Center of Excellence in Health Services Research and Development. Correspondence: Eugene A. Kroch, PhD, 7th Floor, 3600 Market St.,
Philadelphia, PA 19104 (e-mail: ekroch@wharton.upenn.edu). Copyright*2006 by Lippincott Williams & Wilkins
and success of leadership involvement in promoting QI and to examine the drivers and barriers that should be addressed to improve quality in hospitals nationwide. Through this collaboration, 3 projects were undertaken. The first project consisted of a series of in-depth interviews with board, executive, and medical leaders in 18 hospitals that examined how hospital leaders are involved in QI (Leadership Field Study). The second project was an e-mail survey of 1200 hospital executives in 8 states (413 responses) that sought to measure an executive’s perceptions regarding hospital QI (Executive QI Survey). The third project consisted of an analysis of hospital board performance measurement sum-mary reports, calledBdashboards,^ and their relationship to leadership engagement and QI (Board Dashboard Analysis). The dashboard is a tool used by the governing board and senior, midlevel, and line managers to support monitoring the progress of all patient quality and safety performance improvement programs. Its main purpose is to ensure that the most important information regarding quality is conveyed to appropriate leaders and managers as clearly as possible and that information overload is minimized.
This article is devoted to the third project of the collaboration, the Board Dashboard Analysis, the 3 goals of which were (1) to assess the content and composition of hospital board dashboards from a sampling of institutions across the United States; (2) to examine how board dash-boards are created and used by various constituencies in the hospital; and (3) to explore the relationship between dash-boards and hospital performance to identify, in a preliminary way, those structures and processes related to dashboard systems that most directly influence QI. Research findings from these efforts were used to inform the upcoming NQF recommendations for hospital culture and leadership safe practices that update their 2003 publication,Safe Practices for Better Healthcare: A Consensus Report.6
METHODOLOGY
The dashboards that were analyzed in this study were acquired as a by-product of the Executive QI Survey described above. All of the hospitals that participated in the Executive QI Survey were asked to share their Bformal
quality performance measurement reports.^ One hundred twenty of the 413 hospitals that participated in the executive survey supplied their board’s quality measurement reports to HMP, CMS, and CareScience. They represent the original 8 states of the leadership survey project: Arizona, Colorado, Iowa, Illinois, New Jersey, New York, Pennsylvania, and Wisconsin. In addition, 19 hospitals in the state of Maryland provided their dashboards to the researchers.
The states participating in the study were chosen as a convenience sample. Nonetheless, the particular states selected represent a wide range of institutions in size, location, teaching status, and system membership. The dashboard request was for Bformal quality performance measurement reports^ with no particular guidelines, so the hospital submissions were subject to respondent interpreta-tion. Consequently, in some instances, hospitals might have submitted only clinical dashboards, whereas other institutions submitted broader reports that included financial, employee, and/or customer measures. The absence of nonclinical measures does not necessarily imply that the hospital boards do not review other performance measures. It means only that such measures were not integrated into theirBformal quality performance measurement reports^or dashboards.
Of the 139 hospitals that supplied their dashboards, 109 completed an Internet-based BDashboard Implementation Survey^ that addressed the development and utilization of dashboards in the hospitals. This survey posed the following 6 questions: (1) Who is given the dashboard you supplied to us, and how frequently? (2) How much influence do the following (groups) have in placing measures on your dashboard? (3) What action does the board take in response to the information presented in the dashboard? (4) To what degree is your dashboard linked to these activities? (5) How long has your hospital used a dashboard? (6) What has been the greatest impact (positive or negative) of the dashboard on your hospital? The survey instrument was developed and pretested by a group of survey experts and researchers from CMS, CareScience, and HMP.
In addition to the analysis of the dashboard content and the implementation survey, we were able to link these descriptive findings to 2003 hospital performance data from CareScience and Solucient, 2 health care performance
FIGURE 1. Distribution of measures (70% of scorecards
have 15Y45 measures)
(139 hospitals; mean, 28.6; SD, 14.64).
TABLE 1. Composition of Hospital Board Dashboard Sample
Measures
Hospitals Reporting,
n= 139 (%)
Average No. Measures
Per Hospital Total (%)
Clinical quality, efficiency, and safety 97 17.3 61
Clinical quality 87 11.6 40
AMI, heart failure, pneumonia core measures 64 7.8 27
Nosocomial infections 44 0.7
Mortality 44 0.6
Surgical site infection rate 22 0.3
Surgical infection prevention 21 0.5
Obstetrics 21 0.4
Pain management 16 0.2
Complications 11 0.2
Other core measures (JCAHO) 4 0.1
Morbidity 1 0.0 Other 30 0.7 Clinical efficiency 51 2.7 9 Length of stay 46 0.7 Readmits/returns 40 0.9 Wait time ED 15 0.2 Wait time 11 0.2
Leave without being seen/against advice 11 0.1
ED stays 9 0.1 Other 19 0.5 Patient safety 60 3.1 11 Injuries/falls 47 0.6 Medication incidents 47 0.7 Sentinel events 15 0.2 Restraints 12 0.1
Surgical site ID/time out 12 0.2
Other patient safety 52 1.3
Customer perspective 60 2.6 9
Inpatient satisfaction 62 0.6
Satisfaction with ED 38 0.4
Satisfaction with outpatient care 28 0.4
Recommend hospital (including other services) 22 0.3
Physician satisfaction 14 0.2 Complaints 11 0.2 Satisfaction with MD 5 0.1 Other satisfaction 24 0.4 Financial perspective 60 4.8 17 Revenue/cash/operating margin 42 0.8
Inpatient volume (admits, days, census, discharges) 34 0.5
Cost 27 0.5
AR days 26 0.3
Case mix index 24 0.3
Other volume (specify) 22 0.5
Surgical volume (including ambulatory surgery) 19 0.3
ED volume 18 0.2
FTEs per adjusted occupied bed 17 0.2
Market share 12 0.3
Outpatient volume 11 0.1
Growth 2 0.0
measurement system vendors with expertise in performance data analysis, modeling, and reporting, which collaborated with HMP and CMS in this study. The CareScienceBQuality Index^is derived from outcome modeling developed under the Corporate Hospital Rating Project,7where risk-adjusted adverse outcome rates for mortality, morbidity, and complica-tions8are combined into a single quality measure. Hospital outcome rates are adjusted for patient risk (case mix acuity) through diagnosis-stratified multilevel outcome regressions calibrated on a large national all-payer database of almost 2800 hospitals. Appendix A lists the set of patient factors used by the outcome risk model. The Solucient model (Solucient 100 Top Hospitals Scorecard) measures efficiency, clinical quality, patient safety, financial stability, and growth. It is based on both administrative and Medicare cost report data.
Both the CareScience and the Solucient hospital performance metrics are built on hospital administrative
data. Although such data can provide profound insights into health care practices, administrative data include a relatively limited amount of clinical information. Further, both measurement systems are used to rank hospitals on a composite of measures. The systems use hospital-specific, risk-adjusted results for in-patient mortality, complications, patient safety, adverse outcomes, length of stay, and other selected measurements to represent a broad indicator of hospital performance, but they should not be viewed as definitive assessments of hospital quality or efficiency in specific areas, as cautioned in other studies of patient safety and quality indicators.9 These 2 alternative rankings are correlated at about 50%, which is consistent with the differences in their measurement objectives.
In the analysis of performance relative to dashboard content and implementation, statistical inference was based on 2-tailed tests. An alpha level of 0.05 was used to establish TABLE 1.(Continued)
Measures
Hospitals Reporting,
n= 139 (%)
Average No. Measures
Per Hospital Total (%)
Employee perspective 57 2.5 9 Employee turnover 46 0.6 Vacancy/recruitment 30 0.5 Employee injuries 19 0.2 Employee satisfaction 19 0.3 Nursing staffing 12 0.2
Education and training 11 0.2
Evaluations 9 0.1
Sick time and lost time (injuries) 8 0.1
Other 17 0.5 Other 26 1.3 5 Information management/records 19 0.3 Community benefit 15 0.3 Information technology 12 0.2 Other 19 0.6 Total 100 28.6 100
Includes dashboards provided in August 2005 from Arizona, Colorado, Iowa, Illinois, Maryland, New Jersey, New York, Pennsylvania, and Wisconsin.
AMI indicates acute myocardial infarct; AR, accounts receivable ED, emergency department; FTE, full-time equivalent; JCAHO, Joint Commission on Accreditation of Healthcare Organizations; MD, medical doctor.
the critical value for statistical significance. Differences described in the results as Bgreater than^ orBless than^ are statistically significant at that level or higher.
FINDINGS OF THE STUDY
Those hospitals in the 9 states that provided dashboards were present in the following proportions: 67% were members of a hospital system, 53% had more than 200 beds, 56% were urban institutions, and 83% were nonteaching hospitals. Relative to the country as a whole, the survey sample some what overrepresented teaching hospitals and large/medium hospitals and underrepresented small community hospitals.
The average number of years that hospitals in the sample had their quality dashboards in place was 4.2 years. Only 14% of institutions had dashboard experience for less than 2 years, whereas 35% of hospitals have had such formal reporting mechanisms in use for more than 5 years.
Content of Board Dashboards
The 139 hospitals participating in the survey reported, on average, 29 measures on their board quality dashboards. The number of measures reported from similarly sized hospitals ranged from only 2 measures to 105 measures. Seventy percent of the dashboards reviewed contained between 15 and 45 measures. Figure 1 shows a highly
skewed distribution of the number of measures among the 139 hospitals.
Examination of the dashboard elements allowed a grouping of the reported measures into 5 categories (percentages noted): clinical quality, efficiency, and safety (61%); customer perspective (9%); financial perspective (17%); employee perspective (9%); and other (5%). Table 1 gives the full detail.
Within the clinical quality, efficiency and safety category, the clinical quality measures [e.g., acute myocardial infarct (AMI), heart failure, pneumonia, and surgical infection] outnumbered both the clinical efficiency and patient safety measures at a rate of 4 to 1 (11.6 quality measures versus 2.7 on efficiency and 3.1 measures on safety). The HQA core measures (AMI, heart failure, and pneumonia) were the most frequently included measures in hospital board dashboards. Approximately 70% of the measures that appeared in the clinical quality category of measures were related to AMI, heart failure, and pneumonia. Not evident from this table is the extent to which combinations of these measures were present across hospi-tals. Almost half of the dashboards provided (47%) have at least 1 measure in each of the 4 major categories, although the number of measures hospitals reported within the categories varies greatly. Virtually all of the dashboards included clinical measures, and 13% of the dashboards focused
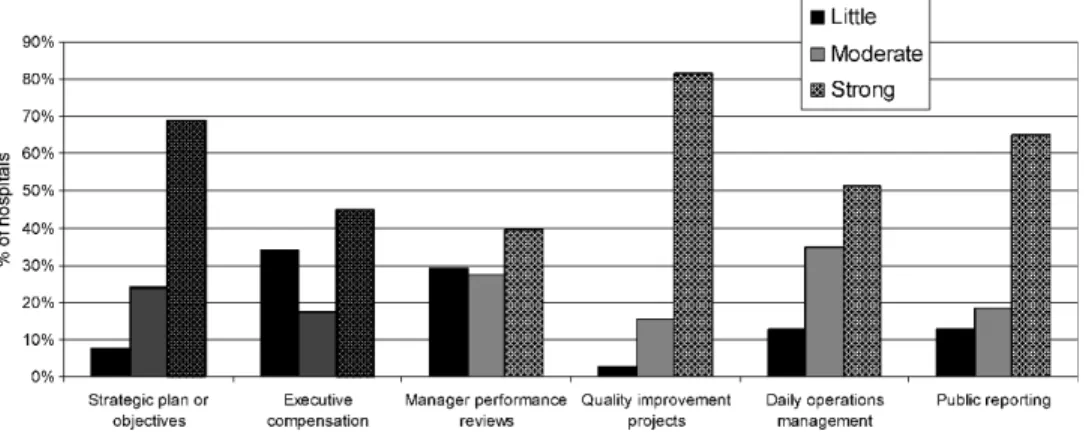
FIGURE 3. Question 4: To what degree is your dashboard linked to these activities? (n= 109).
exclusively on clinical quality, efficiency, and safety. More than half of the dashboards (54%) reported separately on each of these 3 subcategories (quality, efficiency, and safety).
The 38 hospitals with dashboards that were at least 5 years old possessed a greater percentage of clinical quality indicators (45%) than the 54 hospitals whose dashboards were less than 4 years old (35% of indicators on clinical quality).
Dashboard Implementation Survey Responses
The first question on the Dashboard Implementation
Survey asked, BWho is given the dashboard and how
frequently?^The executive leadership was the only constitu-ency most likely to be given the dashboard on a monthly basis, as shown in Figure 2. The modal frequency of distribution to the full board, the board quality committee, the medical staff, middle management, and general staff were all quarterly.
Three of the questions posed on the Dashboard Implementation Survey addressed how the dashboard is used within the institution. These allowed us to identify linkages between the dashboards and a number of actions or activities within these hospitals.
Figure 3 shows that a high percentage of respondents said that their dashboards were strongly linked to strategic plans or objectives (69%), and to QI projects (82%),
indicating that dashboards were used in many hospitals to create awareness of and focus discussion on QI at a strategic level. In addition, 76% of boards use dashboards to request more information, and 62% use dashboards to review processes associated with outcomes (not in the figure). Dashboards seemed to be less strongly associated with use for daily operations management (51% of hospitals), execu-tive compensation (45% of hospitals), and manager perfor-mance reviews (40% of hospitals).
The responses to question 2 (Fig. 4) indicate that compared with physicians and the boards, executive leader-ship and the QI staff are the 2 constituencies that exert the greatest influence when placing measures on the board dashboards.
Relating Board Dashboards and
Implementation Practices to Performance
The relationship between hospital performance and board dashboard content and use was examined using 2 different indexes of hospital performance: quality only (CareScience Quality Index) and a broader scorecard (Solucient 100 Top Rankings). Figure 5 displays the distribution of hospital quality index scores (normalized to 100) and shows that the variation in the dashboard sample of 139 hospitals is reasonably reflective of the hospitals in the 9 survey states and among all
FIGURE 5. CareScience quality index distribution. A comparison across samples.
TABLE 2. Number of Dashboard Measures Relative to Quality Ranking
Measures
Average No. Measures Per Hospital
Total (n= 139) Top Third (n= 46) Bottom Third (n= 46) PairedtTest (Differences)P
Clinical quality and efficiency 17.3 15.6 18.5 0.08
Clinical Quality 11.6 10.0 13.0 0.03
Clinical efficiency outcomes 2.7 2.5 2.9 0.22
Patient safety 3.1 3.1 2.6 0.27 Customer perspective 2.6 2.3 3.1 0.04 Financial perspective 4.8 4.2 4.6 0.31 Employee perspective 2.5 2.0 2.8 0.05 Others 1.3 1.5 1.3 0.39 Total 28.6 25.6 30.3 0.02
U.S. hospitals. Hospitals with quality index scores above 104 in our study are in theBhigh performers^(top third) group, whereas hospitals with quality index scores below 96 are in theBlow performers^(bottom third) group.
Both the quality index and the Solucient rankings were correlated with board involvement in the development of board dashboard content. High scores on the quality index were correlated with fewer dashboard measures, more frequent review, and a longer experience with the board dashboard. High scores on the Solucient rankings were correlated with greater direct use of the dashboard results for performance improvement, operations management, and public reporting.
Hospital performance was related to the number of measures included in the dashboard (Table 2). Shorter dashboards were associated with higher quality based on the CareScience metric. The average number of measures in board dashboards for top-performing hospitals (top third) is 26 measures, compared with 30 measures for hospitals in the bottom third. One notable aspect of this difference was that high-performing hospitals had 3 fewer clinical quality
measures (e.g., core measures, mortality, infection rates) on their dashboards than low-performing hospitals.
In addition, hospitals that have used board dashboards for more than 2 years have higher levels of quality than hospitals that have used dashboards for less than 2 years (Fig. 6).
Perhaps the most important finding of this study is that hospitals in which the board quality committees are strongly involved with the development of dashboard content had significantly higher performance, using both the Solucient and the CareScience rankings, than hospitals that do not have such strong involvement (Fig. 7).
Analysis of question 3 (BWhat action does your board take in response to the information presented in the scorecard?^) revealed that those hospitals that used the dashboard for more than informational purposes showed significantly higher performance on the Solucient rankings than those hospitals where the dashboard was used only for information sharing. Also, those hospitals that have strong linkages between their dashboards and QI projects, daily operations management, and/or public reporting, were more
FIGURE 7. Implementation question 2: Influence of board quality committee on dashboard content related to CareScience and Solucient performance scores.
likely to possess better institutional quality scores with the Solucient rankings (Fig. 8).
High-performing hospitals (i.e., top third based on the CareScience Quality Index) reviewed their board dashboards with greater frequency (monthly or more frequently) than bottom-third hospitals (quarterly review or less). Figure 9 illustrates that this finding holds true for all constituencies that review dashboards (full board, board quality committee, medical staff, middle management, and general staff) except the executive leadership.
DISCUSSION AND RECOMMENDATIONS
Dashboards have emerged as a vital tool for hospital leaders who are interested in promoting QI within their institutions. It has been estimated that more than 80% of U.S. hospitals use formal quality performance reports to report quality to their boards. Because dashboards are an integral
tool to monitor and improve hospital quality, they should be customized to the hospital’s values and needs. Boards and other hospital leaders should take an active role not only in the initial designation of the data to be collected for the dashboard but also in designing and implementing the quality reports that are presented to the board.
The high proportion of hospitals in the study that include Hospital Compare measures in their dashboards suggests that CMS and the Joint Commission on Accredita-tion of Healthcare OrganizaAccredita-tions, in conjuncAccredita-tion with the HQA, have a strong influence on the content of board dashboards. This is reflected in the large preponderance of clinical quality measures (11.6) in board dashboards compared with patient safety measures (3.1). The influence of Hospital Compare measures on the content of hospital board dashboards is not surprising given that the Medicare Modernization Act of 2003 gave a financial incentive to report these measures.
FIGURE 8. Implementation question 4: To what degree is your dashboard linked to the following activities related to Solucient relative performance score?
The Dashboard Implementation Survey showed that there are some commonalties among dashboards in how they are used; dashboards typically are shared widely across the organization (although on differing timeframes), are devel-oped with input from multiple constituencies (although dominated by executives and QI staff), and are usually geared more to the creation of general awareness and focus than operational and performance management.
Beyond these commonalties, however, this study showed that there is much variation in dashboard content and in the implementation practices associated with the dashboards. The presence of this variation allowed us to identify certain themes that seem to be associated with good board quality reports.
First, this study indicates that shorter, more focused dashboards that are reviewed on a frequent basis are associated with higher performance. According to the results of this dashboard analysis, hospitals that use dashboards with fewer measures are more likely to be in the high-performance group, suggesting that higher-performing hospitals have developed dashboards that focus on areas they see as critical for quality. Furthermore, performance data are more action-able when such data are consistently reviewed by the board on a relatively frequent basis (i.e., at least quarterly, if not at every meeting).
Second, this study has shown that hospitals with boards that more actively use their dashboards for operation manage-ment and QI projects are more likely to be high-quality performers. Findings suggest that leading hospital boards hold management accountable for achieving excellence in patient safety and quality. The findings suggest that full and complete explanations are required from management when performance differs from expectations, best practice standards are not followed, or actions are not taken if shortfalls are identified but not addressed in a timely manner.
Third, our analysis showed that better performance is found with boards that have highly engaged board quality committees. The companion Executive QI Survey found that an alignment of boards with medical staffs in developing the hospital’s quality strategy was one of the strongest predictors of quality in a hospital. Therefore, hospital leaders should facilitate collaboration and cross-fertilization between boards and medical staffs in all activities related to dashboard development and implementation. Others have suggested that qualified clinicians, including physicians and nurses, and others with expertise in QI (e.g., medical data experts/ statisticians), should be sought out as consultants to provide guidance and education in support of this endeavor.
In general, the findings of this study align with the new NQF safe practice recommendations for necessary changes in hospital culture required to improve patient safety, especially in the areas of leadership, structures, and systems, and identification and mitigation of risks and hazards. Hospital leaders must be able to prioritize their areas of focus based on identification and mitigation of risks and hazards, leading to improved quality, as discussed in Denham.10Dashboards are recommended by NQF as a tool to be researched to help design the structures and systems that support leaders. The leaders must have the tools to become aware of performance
gaps that harm patients; they must be more accountable to close those gaps and invest in creating good tools that work.11 A well-designed dashboard can be an important tool.
In conclusion, the relationship between dashboard implementation and quality performance warrants addi-tional study. The findings of this study suggest that leaders use specific objective measures purposefully, but exactly how they establish priorities and direct change, based on the dashboard results, is unclear. Further study should examine the extent to which leadership actions affect performance change in hospitals. Such a study of board quality practices and the associated reporting and monitor-ing systems used by boards has great potential. Relatmonitor-ing these findings to quality performance would enable the identification of characteristics of hospital leadership that are most likely to strengthen QI activities within hospitals. The development of more refined quality reports that are based on empirical research will facilitate the role of boards in promoting QI in hospitals across the nation.
REFERENCES
1. Kohn LT, Corrigan J, Donaldson MS, eds.To Err Is Human: Building a Safer Health System. Washington, DC: National Academies Press; 2000. 2. Institute of Medicine.Committee on Health Care in America. Crossing
the Quality Chasm: A New Health System for the 21st Century. Washington, DC: National Academies Press; 2001.
3. Institute of Medicine. In: Corrigan J, Eden J, Smith B, eds. Committee on Enhancing Federal Healthcare Quality Programs. Leadership by Example: Coordinating Government Roles in Improving Healthcare Quality. Washington, DC: National Academies Press; 2002.
4. Hospital Compare Web site. Department of Health and Human Services. Available at: http://www.hospitalcompare.hhs.gov. Accessed
March 13, 2006.
5. National Quality Forum. Hospital governing board and quality of care: a call to responsibility.Trustee. 2005;58(3):15Y18.
6. National Quality Forum.Safe Practices for Better Healthcare: A Consensus Report. Washington, DC: National Quality Forum; 2003. 7. Pauly MV, Brailer DJ, Kroch EA. The corporate hospital rating project:
measuring hospital outcomes from a buyers perspective.Am J Med Qual. 1996;11(3):112Y122.
8. Brailer DJ, Kroch EA, Pauly MV. Comorbidity-adjusted complication risk: a new outcome quality measure.Med Care. 1996;34(5): 490Y505.
9. Miller MR, Pronovost P, Donithan M, et al. Relationship between performance measurement and accreditation. Implications for quality of care and patient safety.Am J Med Qual. 2005;20: 239Y252.
10. Denham CR. Patient safety practices: leaders can turn barriers into accelerators.J Patient Saf. 2005;1(1):41Y55.
11. Denham CR, Bagian J, Daley J, et al. No excuses: the reality that demands action.J Patient Saf. 2005;1(3):170Y175.
APPENDIX A
CARESCIENCE OUTCOME RISK FACTORS & Age (quadratic form); gestational age/birth weight for neonates & Sex (female, male, unknown)
& Race (white, black, other, unknown)
& Income (median household income within a zip code reported by U.S. Census Bureau)
& Distance traveled (the centroid-to-centroid distance between the zip code of the household and the zip code of the hospital or provider)
& Principal diagnosis (terminalInternational Classification of Diseases, Ninth Revision, Clinical Modification digit, where statistically significant)
& Comorbidity-adjusted complication risk8 comorbidity scores (count of comorbidities within each of 5 severity categories on the comorbidity-adjusted complication risk Likert scale)
& Cancer status (benign, malignant, carcinoma in situ, history of cancer)
& Chronic disease and disease history (e.g., diabetes, renal failure, hypertension, chronic gastrointestinal disorder, chronic pancreatitis, obesity, and history of substance abuse) & Defining procedure (as a supplement to diagnosis, where
statistically significant)
& Time trend factor for cost and charge outcomes (to control for inflation specific for each disease in the inpatient hospital setting)
& Admission source (physician referral, clinic referral, health maintenance organization referral, transfer from a hospital,
skilled nursing facility or another health care facility, emergency room, court/law enforcement, newborn-normal delivery, premature delivery, sick baby, or extramural birth), unknown/other
& Admission type (emergency, urgent, elective, newborn, delivery, unknown/other)
& Payor class (self-pay, Medicaid, Medicare, Blue Cross/ Blue Shield, commercial, health maintenance organization, Workman’s Compensation, Civilian Health and Medical Program of the Uniformed Services/Federal Employee Health Plan/other federal government, unknown/other) & Discharge disposition (for some outcomes only) (home or
self-care, short-term general hospital, skilled nursing facility, intermediate care facility, another type of institu-tion, home under care of organized home health service, left against medical advice, discharged home on intrave-nous medications, expired, unknown/other)
& Facility type (urban/rural setting, geographic region, own-ership type, teaching status, size category)
TMIT
3011 North IH-35 Austin, TX 78722
(512) 473-2370
April 30, 2007
Dear Healthcare Leader:
We are delighted to announce that the Journal of Patient Safety has graciously given us permission to distribute copies of recently published articles to you in the interest of helping you adopt the National Quality Forum Safe Practices for Better Healthcare – 2006 Update.
The Journal of Patient Safety is dedicated to presenting research advances and field applications in every area of patient safety and we give our highest recommendation for them as a valuable resource toward patient safety from hospital bedside to boardroom. It is in the fulfillment of this mission that they make the gift of these articles to you in your pursuit of your quality journey.
The home page of the Journal of Patient Safety can be accessed at the following link:
http://www.journalpatientsafety.com and subscription information can be directly accessed online at:
http://www.lww.com/product/?1549-8417.
We want to acknowledge you and your institution for your current efforts in patient safety. We hope you enjoy this article and find it useful in your future work.
Sincerely,
Charles R. Denham, M.D. Chairman