International linkages, local externalities, innovation and
productivity
A structural model of Italian manufacturing firms
Roberto Antonietti
Giulio Cainelli
WP 5/2009
working papers
series
This research was funded by the Autonomous Province of Trento, as the sponsor of the OPENLOC research project under the call for proposals “Major Projects 2006”. Partners of the project are: the E. Mach Foundation, the Manchester Institute of Innovation Research, the Trento Museum of Natural Sciences, the University of Bologna and the University of Trento
International linkages, local externalities,
innovation and productivity
A structural model of Italian manufacturing firms
Roberto Antonietti1 and Giulio Cainelli2
Abstract
Using a large sample of Italian manufacturing firms, in this paper we estimate a structural model of research, innovation, productivity and export performance augmented to take account for the role played by local externalities. This model, which is an “enlarged” version of Crepon, Duguet and Mairesse (1998) model, comprises four main equations. The first identifies the factors underlying the intensity of Research and Development (R&D) investments; the second links R&D capital to innovation output; the third focuses on Total Factor Productivity (TFP) as determined by innovation; the fourth relates export performance to TFP. Our estimates show the significant role played by local externalities in these processes. In particular, related variety and urbanization positively affect the creation of new ideas through R&D, while specialization impacts on TFP to complement innovation output. Finally, urbanization economies support TFP in driving firms’ export performance.
Keywords:export, innovation, productivity, R&D, spatial agglomeration
Acknowledgments
The Authors acknowledge with thanks Andreas Stephan and all the participants to the XII Uddevalla Symposium “The geography of innovation and entrepreneurship”, Bari, 11-13 June 2009. Roberto Antonietti also thanks Unicredit-Capitalia for the provision of the dataset. Financial support from OPENLOC Project “Public policies and local development: innovation policy and its effects on locally embedded global dynamics” (Province of Trento) is particularly acknowledged. All the usual disclaimers apply.
1. Introduction
Since the 1990s there has been great emphasis in the literature on the role of spatial agglomeration, technological innovation and internationalisation as the main drivers of the economic performance of manufacturing firms. However, while the positive role of innovative activities in enhancing productivity growth in manufacturing and service
firms is now considered a robust stylized fact (Griffith et al., 2004; Griliches and
Mairesse 1985, 1995; Hall and Mairesse 1995; Harhoff 1998; Wakelin 2001; Wang and
Tsai 2003; Parisi et al., 2006; Cainelli et al., 2006) the sign and the intensity of spatial
agglomeration, and thus local knowledge spillovers effects on economic performance, are still a puzzling and unresolved question.
Starting with the seminal papers of Glaeser et al. (1992) and Henderson et al. (1995), the
relationships between local knowledge spillovers, such as Marshall-Arrow-Romer
1 Department of Economics and Management “Marco Fanno”, University of Padova, via del Santo 33,
35123 Padova, Italy. Tel: +39 049 8271508. E-mail: roberto.antonietti@unipd.it.
2 Faculty of Law, University of Bari, Piazza Battisti , Bari, Italy and CERIS-CNR, via Bassini 15, Milan,
(MAR) externalities, Porter and Jacobs externalities, and economic performance have
been extensively investigated at both industry and firm levels (De Lucio et al., 2002;
Henderson, 2003; Cingano and Schivardi, 2003; Martin et al., 2008). But, these studies
do not reach a definite, clear-cut conclusion about the role of these variables.
In addition to this literature, a line of research, linked to the new theory of international trade, is showing that economic performance, measured as firms’ Total Factor Productivity (TFP) or labour productivity, can affect in turn the export propensity of firms and their internalisation strategies, more generally. In other words, most works in this strand show that more productive firms tend to have higher export propensities (Wagner, 2005) or, more generally, that firms with different levels of productivity – the main source of firm heterogeneity – tend to be engaged in different modes of internationalization. According to this literature, this is because internationalization is characterized by different levels of sunk costs: i.e., firms need to acquire information on foreign market, establish distribution channels, and so on. This stream of literature, therefore, finds that exporters benefit from larger and significant performance premia relative to non-exporting firms, and thus identifies a causal positive relationship between productivity and exports.
All these studies suggest the presence of a “complex” dynamic relationship between gglomeration, innovation and internationalization, which passes through firm productivity. Underling these contributions is the idea that agglomeration and innovation may affect productivity, which, in turn, may have a role in explaining firms’ export performance.
In spite of the relevance of these phenomena, the number of empirical studies that deal with these complex relationships is limited. This paper is an attempt to filling this gap. In particular, we model these complex and dynamic structural relationships, estimating an “enlarged” version of Crepon, Duguet and Mairesse (CDM hereafter) model, developed to summarize the complex process “that goes from the firm decision to engage in
research activities to the use of innovations in its production activities” (Crepon et al.,
1998, p.116).
We modify this model in two ways. First, to the three equations characterizing the “traditional” CDM model, i.e., the “research activity” equation linking Research and Development (R&D) to its main determinants, the “innovation” equation relating research to innovation output, and the “productivity” equation relating innovation output to TFP, we add a fourth that refers to “exports”. This equation emphasizes the empirical link with firm heterogeneity – being the TFP the main source of – in determining the performance of firms on foreign markets.
Second, we use this four equation recursive model to empirically test the role played by different forms of agglomeration economies in each stage of the firm process from the decision to engage in R&D to the decision to export. We introduce into each of the four equations a set of measures for local knowledge spillovers. We consider three specific forms of local externalities: (i) localization economies (also known as MAR economies), arising from the spatial concentration of firms belonging to the same industry; (ii) Jacobs’s externalities, which are spurred by the variety and diversity of geographically proximate industries, and capture knowledge spillovers from the cross-fertilization of
ideas by firms operating in related or unrelated-sectors (Frenken et al., 2007; Boschma
and Iammarino, 2009); and (iii) urbanization economies, which mainly involves information spillovers as local public goods, external to both firms and industry, and which are related to the size of the market and the density of the urban area in which the
Controlling for sample selection and simultaneity, we estimate this recursive four equations system using a large sample of over 700 Italian manufacturing firms. Data, for the period 1998-2003, are drawn from merging information from the VII, VIII and IX Survey on Manufacturing Firms conducted by Unicredit-Capitalia (formerly
Mediocredito Centrale) with 1991 census data on manufacturing and service industries
provided by the National Statistical Institute (ISTAT).
We measure research intensity empirically by real investment in R&D per employee. Since our sample includes firms that do not engage in R&D, we account for possible sample selection bias by using the Heckman (1976, 1979) two-step procedure: in the first stage, estimating firm propensity to invest in R&D, and, in the second stage, estimating the determinants of R&D intensity. Innovation output is measured through firm propensity to introduce a new product or new process in the three years 2001-2003. We also examine the probability of a new product (product innovation) or a new process (process innovation). Productivity is measured by both TFP and value added per employee. In order to compute TFP we assume a standard, two-input Cobb-Douglas production function with output measured as deflated value added at each three-digit sector level. To avoid simultaneity, we estimate TFP using the Levinsohn and Petrin (2003) semi-parametric approach, where we use a composite index of materials and services in order to control for unobservables. Finally, we measure export performance (i) as the propensity to export; (ii) as the share of export sales; and (iii) as the number of macro-areas in which firms exported in 2003.
The main contribution of this paper to the literature is that unlike other empirical studies, we do not rely on a “reduced form” rather estimate a structural model that allows us to identify which forms of spatial agglomeration affect innovation, productivity and export performance, and at what level.
The paper is organized as follows. In Section 2 we briefly review the related literature. In Section 3 we describe the dataset, present the modelling strategy and discuss the main empirical results. Section 4 concludes the work.
2. Related literature
2.1. The role of technological innovations on productivity
Innovation and technological change are important factors in analyses of the determinants of long-term economic growth, and in firm or industry level investigations of the relationship between innovation and economic performance. The first analysis of innovation and technological change was conducted by Solow (1957). In this and subsequent contributions based on a theoretical framework originating in the aggregate production function, Solow tried to identify technical progress in the “residual” component of economic growth, which cannot be explained by the contribution of production factors such as labour and capital. This so-called “growth accounting” approach emphasize the relevance of technological change as a key factor explaining the aggregate productivity of an economic system.
Within an analytical framework based on production functions, most analyses at industry or firm level confirm the importance of investment in R&D, and of innovative activities
more generally, in determining firms’ competitive advantage. The works of Griffith et al.
(2004), Griliches and Mairesse (1985, 1995), Hall and Mairesse (1995), Harhoff (1998),
Parisi et al. (2006), Wakelin (2001), and Wang and Tsai (2003) are examples of such
studies. They generally find a positive effect of technological innovations on productivity growth. An alternative approach to analysing technological change is based on the
fundamental contributions of Schumpeter (1939, 1943). Within this line of research, technological change is interpreted as a process of creative destruction. Although neo-Schumpeterian approaches such as the evolutionary theories of economic and technological change differ from the mainstream in terms of their theoretical framework, they agree about the impact of technological innovation on aggregate and firm-level performance (Antonelli 2003; Dosi 1988; Malerba and Orsenigo 1995; Metcalfe 1997, 1998).
2.2 The role of spatial agglomeration on productivity
Another body of works focuses on the positive effects on productivity of spatial agglomeration. This stream of literature originated in the early 1990s when the relationships between spatial agglomeration, knowledge spillovers, and economic growth
at the urban level were extensively investigated (Glaeser et al., 1992; Henderson et al.,
1995). Using a cross-section of US cities, Glaeser et al. (1992) analyse the impact of
three different forms of local knowledge spillovers – MAR, Porter and Jacobs
externalities – on subsequent urban employment growth. Glaeser et al. show that
localization economies or MAR economies, which arise from the spatial concentration of firms belonging to the same industry, and are captured by specialization indicators, have a negative impact on urban economic growth, while urbanization (or Jacobs) economies, spurred by the variety and diversity of geographically proximate industries, positively affect the subsequent growth of a metropolitan area.
Using a similar empirical framework, Henderson et al. (1995) find that localization plays
a positive role in mature capital-goods sectors, while productive structure differentiation (variety), which should generate the cross-fertilization of ideas between different industries, has a positive impact only in the case of high-tech industries. Using French data, Combes (2000) also finds a rather negative impact of specialization on employment growth in both industry and service sectors. Finally, Forni and Paba (2002), using information on a cross section of 995 Italian LLS for the period 1971-1991 find that in most cases specialization and variety positively affect growth, but that the effect of variety is different for each industry. They note also that, consistent with Marshall (1920), in order to capture the spillover-generating process a size effect needs to be added to the specialization effect.
Glaeser et al.’s (1992) approach has been replicated in the contexts of different countries
in order to provide further evidence on these issues. However, the various results obtained from empirical research in this field are controversial and currently there is not a unique model that explains the link between economic performance measured by employment growth, and the structure of the local economy. In particular, some studies referring to the Italian case, find that specialization has a negative impact on local growth, while diversity plays a positive role (see, among others, Cainelli and Leoncini,
1999; Cunat and Peri, 2001; Usai and Paci, 2003; Paci and Usai, 2006; Mameli et al.,
2007).
This empirical literature has been extended by several studies that analyse the impact of measures of agglomeration economies on both employment growth (as in the original
body of literature referred to), and productivity or firms’ TFP growth (De Lucio et al.,
2002; Henderson, 2003; Cingano and Schivardi, 2003; Martin et al., 2008). The findings
from this new strand of empirical research are also rather puzzling.
For example, De Lucio et al. (2002) investigate the relationship between labour
productivity and spatial agglomeration at the level of the 50 Spanish provinces for the period 1978-1992, and find that variety plays a role in labour productivity growth, and
also find a U-shaped effect for specialization. According to their results, low levels of specialization reduce productivity growth, and high levels foster it.
Cingano and Schivardi (2003), on the other hand, use firm-level based TFP indicators to show that specialization, calculated at the level of the 784 Italian LLSs, has a positive impact on firm productivity growth, but that variety has no significant effect. However, taking local employment growth as the dependent variable, Cingano and Schivardi (2003) show that the specialization effect is reversed and becomes negative, while variety
has a significant and positive impact on employment growth, thus confirming Glaeser et
al.’s results.
Henderson (2003), using the US Census Bureau Longitudinal Research Database (LRD) shows that localization economies have strong positive effects on productivity at plant level in high-tech, but not in mechanical industries; he also finds little evidence of urbanization economies.
Martin et al. (2008), using French individual firm data from 1996 to 2004, find no
significant effect of spatial agglomeration on firm productivity. More precisely, they find that French firms benefit from localization, but not from urbanization economies, but that benefits from industrial clustering – even though highly significant from a statistical point of view – are quite modest in terms of magnitude.
Finally, Boschma and Iammarino (2009) estimate the impact of agglomeration economies on regional economic growth, using export and import data for Italian provinces for the period 1995-2003. They find that forms of related-variety affect regional growth. Their main result is that local systems endowed with sectors that are
complementary in terms of shared competences (i.e. with related-variety) perform better3.
2.3. The role of productivity and agglomeration on export
Another relationship fundamental to our analysis is the link between productivity and exports. In fact, most empirical studies show that more productive firms tend to have a higher propensity for export (Wagner, 2005). In other words, these studies find that exporters benefit from larger and more significant performance premia relative to non-exporting firms. Two different hypotheses on the relationship between firm performance
and export status are proposed in this literature (Castellani et al., 2009). The first assumes
that the presence of sunk costs, such as transport costs or expenses related to establishing and developing distribution channels, induces self-selection of the more productive firms (Roberts and Tybout, 1997; Bernard and Jensen, 1999). The second hypothesis underlines that firms can become more efficient after they start exporting through
3 There is yet another body of work that focuses on the positive effects on productivity of spatial
agglomeration. This includes studies of Marshallian industrial districts. Starting with Becattini’s “re-discovery” in the late 1970s of this analytical category of Marshallian thought (Becattini 1989) and continued in later works (Langlois and Robertson 1995; Best 1990; Boschma and Lambooy 2002; Boschma and ter Wal 2007; Brusco 1982; Brusco et al. 1996; Gordon and McCann 2001, 2005; Iammarino and McCann 2006), the industrial district achieved wide notoriety as a specific type of industrial organization, within which long-term informal links among firms generate agglomeration economies, and, more generally, Marshallian externalities which take the place of scale economies internal to individual firms. Alongside this theoretical revisiting of the Marshallian district concept, a new body of empirical literature emerged. These works attempt to establish the presence of a “district effect”; that is, they try to identify empirically the agglomerative benefits that firms derive from membership in one of these productive structures. Following Signorini’s (1994) contribution, research in this field (see for example Bagella and Becchetti 2000; Fabiani et al. 1999) show that firms in industrial districts do indeed benefit from agglomeration advantages; that is, they enjoy a “district effect.” These results were derived from different econometric specifications and different data sets. However, the results on the positive effects of agglomeration on firm performance are unanimous.
learning or economies of scale effects (Clerides et al., 1998). The empirical literature
tends to support the first hypothesis, finding the post-entry mechanisms less relevant.
The empirical relationship between firm economic performance and export has given rise to new theoretical models that try to account for these phenomena (Bernard and Jensen, 2004; Melitz, 2003). The basic ideas behind them is that firms with different levels of productivity – the main source of firm heterogeneity – generally will be engaged in different modes of internationalization which are characterized by different sunk costs. In other words, these models assume that “servicing a foreign market entails an entry (sunk) cost, due to the fact that, for example, firms need to acquire information on the foreign market, establish distribution channels and find the appropriate suppliers of goods and services” (Castellani and Zanfei, 2007, p. 4). In this sense, these “new international trade” theories are able to link firm productivity to export performance and to internationalization modes more generally (Bernard and Jensen, 1995 and 1999; Melitz, 2003).
Finally, we would underline that most studies acknowledge the role played by spatial agglomeration (Bagella and Becchetti, 2000; Becchetti and Rossi, 2000) in export activities. For example, Becchetti and Rossi (2000), based on a sample of over 3,800 manufacturing firms drawn from the Mediocredito Centrale database for the period 1989-1991 show that spatial agglomeration, captured by localization within the boundary of an industrial district, increases average export intensity by 4 percentage points. This evidence is tested using econometric methods, which confirm the positive effects of geographical agglomeration on export intensity.
This relationship is further confirmed by more recent evidence showing that export intensity in a sample of Italian manufacturing firms tends to be higher for firms in industrial clusters compared to “isolated” firms (Banca Intesa, 2008).
Export is not the only strategy adopted by firms to achieve international expansion. Others include foreign direct investment (FDI) and a continuum of intermediate forms of internationalization such as joint ventures, trade and production licensing, sub-contracting, etc. However, most studies and reports suggest that small and medium sized firms located in agglomerated areas tend not to adopt these more complex internationalization strategies due to various technological, informative and financial constraints. Thus, our choice to focus on export is supported by the evidence in the literature and is consistent with the specific features of the Italian manufacturing system. 3. The empirical investigation
3.1. The dataset
The dataset we use in our empirical investigation consists of a sample of Italian manufacturing firms drawn from the VIII and IX waves of the Survey on Manufacturing
Firms (Indagine sulle Imprese Manifatturiere) provided by Unicredit-Capitalia (formerly
Mediocredito Centrale), which covers the period 1998-2003. Interviews have been
conducted respectively in 2001 and 2004 for the two surveys with all firms with more than 500 employees and over a representative sample with more than 11 and less than 500 employees, stratified by geographical area, industry and employment size. The master datasets, one referring to 1998-2000 and the other to 2001-2003, gather information on 4.680 and 4.289 firms respectively.
We cleaned the data for missing observations, inconsistencies and outliers, and thus achieved a balanced sample of 715 firms, whose distributions are presented Tables 1, 2 and 3.
Table 1 – Sample distribution by size, area and Pavitt’s sectors Size 1998-2000 2001-2003 1998-2003 11-20 39.94 22.15 32.45 21-50 37.14 29.54 35.66 51-250 16.15 36.93 23.92 251-500 3.87 5.27 4.34 > 500 2.91 6.11 3.64 Area North West 37.54 35.91 41.54 North East 27.44 30.12 29.51 Centre 20.62 17.65 18.04 South 14.40 16.32 10.91 Pavitt Supplier dominated 52.22 50.71 48.81 Scale intensive 18.14 17.42 17.34 Specialized suppliers 24.34 26.92 29.79 Science based 5.30 3.99 4.06 N. obs. 4.680 4.289 715
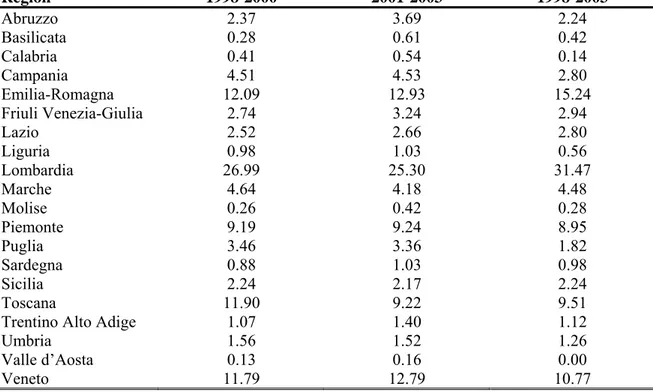
Table 2 – Sample distribution by regions
Region 1998-2000 2001-2003 1998-2003 Abruzzo 2.37 3.69 2.24 Basilicata 0.28 0.61 0.42 Calabria 0.41 0.54 0.14 Campania 4.51 4.53 2.80 Emilia-Romagna 12.09 12.93 15.24 Friuli Venezia-Giulia 2.74 3.24 2.94 Lazio 2.52 2.66 2.80 Liguria 0.98 1.03 0.56 Lombardia 26.99 25.30 31.47 Marche 4.64 4.18 4.48 Molise 0.26 0.42 0.28 Piemonte 9.19 9.24 8.95 Puglia 3.46 3.36 1.82 Sardegna 0.88 1.03 0.98 Sicilia 2.24 2.17 2.24 Toscana 11.90 9.22 9.51
Trentino Alto Adige 1.07 1.40 1.12
Umbria 1.56 1.52 1.26
Valle d’Aosta 0.13 0.16 0.00
Table 3 – Sample distribution by industry
Industry %
Food, beverages and tobacco 8.11
Textile 12.31 Leather 4.06
Wood 3.64
Paper, publishing, printing 5.59 Coke, petroleum, nuclear fuel 0.70
Chemicals 4.06
Rubber, plastics 6.85
Non-metallic mineral products 5.87
Metal products 15.24
Machinery, equipment 16,36
Electrical and optical equipment 9.09
Transport equipment 1.82
N.e.c., furniture 6.29
Total 100.00
The variables measuring spatial agglomeration come from the Census of Industry and Services conducted by ISTAT in 1991. We draw particularly on census information on employment and population density at the Administrative Provinces level.
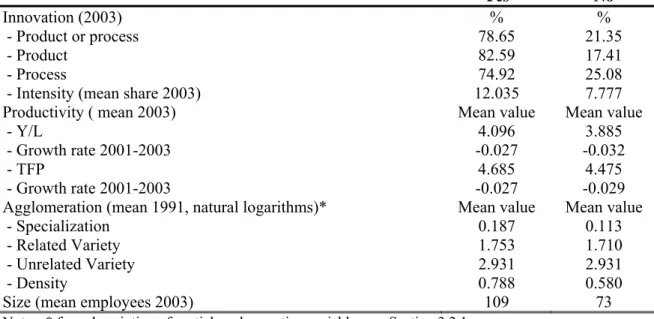
Tables 4, 5 and 6 present some descriptive evidence on our main variables. Table 4 shows that exporting firms, on average, are larger, more productive, more likely to introduce new products and/or processes, more specialized compared to domestic firms, but also located in denser areas.
Table 4 – Mean characteristics of exporting firms (2003)
Yes No
Innovation (2003) % %
- Product or process 78.65 21.35
- Product 82.59 17.41
- Process 74.92 25.08
- Intensity (mean share 2003) 12.035 7.777 Productivity ( mean 2003) Mean value Mean value
- Y/L 4.096 3.885
- Growth rate 2001-2003 -0.027 -0.032
- TFP 4.685 4.475
- Growth rate 2001-2003 -0.027 -0.029 Agglomeration (mean 1991, natural logarithms)* Mean value Mean value
- Specialization 0.187 0.113
- Related Variety 1.753 1.710
- Unrelated Variety 2.931 2.931
- Density 0.788 0.580
Size (mean employees 2003) 109 73
Notes: * for a description of spatial agglomeration variables see Section 3.2.1.
Table 5 shows that firms introducing new products and/or new processes tend to be more willing to export, slightly more productive (both in terms of labour productivity and in
terms of TFP), more specialized and located in areas characterized by a relatively high related variety.
Table 5 – Mean characteristics of innovative firms (2003)
Yes No
Export (% 2003) 66.60 33.40
- Intensity (mean share 2003) 31.5 20.9 Productivity ( mean 2003) Mean value Mean value
- Y/L 4.040 4.028
- Growth rate 2001-2003 -0.047 -0.000
- TFP 4.646 4.591
- Growth rate 2001-2003 -0.044 -0.004 Agglomeration (1991, natural logarithms)* Mean value Mean value
- Specialization 0.183 0.141
- Related Variety 1.753 1.721
- Unrelated Variety 2.904 2.952
- Density 0.713 0.739
Size (mean employees 2003) 126 58
Notes: * for a description of spatial agglomeration variables see Section 3.2.1.
Table 6 presents details on Italian firms’ productivity levels in year 2003. It can be seen that the most efficient firms are more present in foreign markets, are more innovative and more concentrated in specialized clusters. Also, productivity level increases with firm size, and productivity growth seems to be less negative for medium-sized firms.
Table 6 – Productivity by export, innovation, agglomeration and size
Ln Y/L 2003 TFP 2003 Export 2003 4.096 4.685 Domestic 3.885 4.475 Innovative 2003 4.040 4.646 Non innovative 4.028 4.591 - Product innovation 4.057 4.614 - No product innovation 4.018 4.632 - Process innovation 4.038 4.671 - No process innovation 4.033 4.591 Localization (above average) 4.039 4.711 Localization (below average) 4.031 4.538 Related variety (above average) 4.060 4.531 Related variety (below average) 4.014 4.701 Unrelated variety (above average) 4.045 4.618 Unrelated variety (below average) 4.022 4.632 Density (above average) 3.968 4.558 Density (below average) 4.045 4.634 Small firms (11-50) 3.973 4.448
Medium (51-250) 4.104 4.843
Large (> 250) 4.354 5.469
3.2. The modelling strategy
To model the structural relationships among research, innovation, productivity and export, we specify and estimate a four equation recursive system which constitutes a modified version of the CDM model.
As already mentioned we extend this model in two ways. First, we introduce a new equation which should capture the empirical links between productivity and firms’ export performance. Second, we empirically test for the effect of different forms of agglomeration economies in each stage, introducing measures of local knowledge spillovers: (i) localization economies, arising from the spatial concentration of firms in the same industry; (ii) Jacobs’ externalities, spurred by the variety and diversity of geographically proximate industries, and capturing knowledge spillovers from the cross-fertilization of ideas from firms operating in related or unrelated sectors; and (iii) urbanization economies, which measure mainly information spillovers as local public goods, external to both firm and industry, and related to the size of the market and the density of the urban area in which the firm is located.
Note that although we do not rely on panel data, we avoid the problem of simultaneity by measuring all the explanatory variables in each equation three years before the period of the dependent variable.
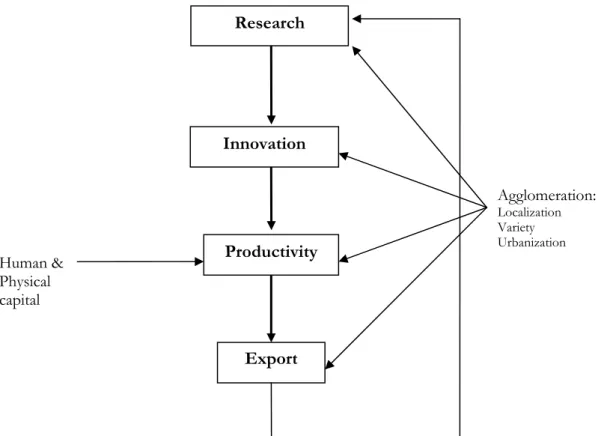
Our model is depicted in Figure 1. It consists of four equations, one for research, one for innovation, one for total factor productivity, and one for export behaviour. The idea is that research capital is an input that affects the creation of new products/processes, which, in turn, affects firm’s TFP level together with human and physical capital. Finally, TFP positively affects export behaviour by reducing the fixed costs associated with access to foreign markets.
All the above relations are assumed to be affected also by spatial agglomeration externalities, stemming from geographical concentration, variety and urbanization.
Figure 1 – The structure of the model
Research Innovation Productivity Agglomeration: Localization Variety Urbanization Human & Physical capital Export
3.2.1. The research equation
The first equation in the model concerns firms’ research intensity. Since our dataset includes firms that are not involved in research activities, we rely on a two-stage Heckman (1976, 1979) selection model in which we account first for the fact that the firm invested in R&D in 2003, and second we estimate the determinants of R&D
intensity. Operationally, we assume that there is a latent variable r* for firm i given by:
[1] ri* x0i0 0i
where x0i is the set of explanatory variables, β0 is the corresponding vector of the
coefficients, ε0 isthe error term and r* is the latent variable that reflects the criterion for
the decision to engage in R&D: for example, the corresponding expected present value of profits. In this case, we observe that the firm invests in R&D if the expected profits are positive or larger than the industry-specific threshold (as in our case since we include a constant term and a set of industry dummies in every equation). In our sample of 715 firms, 49.4% are engaged in R&D compared to 50.6% of firms that are not.
Research intensity r is given by equation [2]:
[2] ri x1i1 1i
where r is the 2003 real observed R&D investment per employee (in natural logarithms),
x1i is the vector of the explanatory variables, β1 is the corresponding vector of
coefficients and ε1 is the error term. In estimating the Heckman two-stage model, we
assume that the joint distribution of ε0 and ε1 is normal, with zero mean and constant
variance-covariance matrix. In order to provide more robust estimates, we include an exclusion restriction in the first-stage selection equation.
Among the explanatory variables, we include:4 (i) firm market share, computed as firm i
sales over average sector sales; (ii) a set of 13 industry-specific dummies; (iii) age (measured up to year 1998); (iv) previous investment in R&D (measured up to year
2000); (v) a dummy variable capturing firm engagement in export in 20005; (vi) a
dummy variable equal to 1 if the firm benefited from tax incentives in the period 1998-2000 (for research and technological innovation); (vii) an exclusion restriction based on whether the firm was part of a R&D consortium in the period 1998-2000. This last variable is thought to be correlated with the probability of engagement in R&D, but not necessarily with R&D intensity.
Finally, following the literature on spatial agglomeration economies (Glaeser et al., 1992;
Cainelli and Leoncini, 1999; Cingano and Schivardi, 2003; Frenken et al., 2007;
Boschma and Iammarino, 2009) we include in this and the following equations: (i) a variable measuring local specialization; (ii) two variables measuring Jacobs externalities
4
Unfortunately, our dataset does not include direct information on demand-pull or technology-push variables. Therefore, we deviate slightly from Crèpon et al., (1998), although we do include firm size and sectoral specialization.
5 In the absence of specific variable, we include market share and previous export activity in order to
capture demand-pull factors (at national and international levels), while previous R&D expenditure is used as a proxy for science-push factors and technological opportunities. We use market share as a proxy for firm size.
through related and unrelated variety; (iii) a variable measuring urbanization economies at the Province level.
The first variable captures localization economies, or MAR externalities, i.e. the idea that specialized locations may benefit from within-industry knowledge spillovers coming from the spatial concentration of firms in the same industry. In line with the literature, we
measure MAR externalities using the specialization index of sector s located in province
p is computed as follows: IT IT s p p s p s l l l l , , , Spec
where ls,p denotes employment in industry s in Province p, lpis total manufacturing
employment in Province k, ls,ITis employment in industry s in Italy and finally lIT is total
manufacturing employment in Italy.
The second set of variables measures the positive externalities induced by the diversity of
local economic activities outside sector s as a result of the cross-fertilization of ideas
(Jacobs externalities) from related and unrelated sectors. In the former case, following
Frenken et al., (2007), we restrict attention to sectors located in province p but related to
sector s. This allows us to calculate an index of related variety given by the 5-digit
employment share within a 2-digit sector, and thus measuring the level of entropy within
each 2-digit sector:6
G g g g H P 1 1 Relvarwhere Hg is the inverse of an Herfindahl concentration index calculated at the 5-digit
level within each 2-digit level, and Pg is the share of the 2-digit sector g.
To measure unrelated variety, we use a standard measure of product diversification in
each of the N available Italian provinces based simply on the inverse of an Herfindahl
concentration index calculated at the 3-digit level. The value of this indicator increases, the more diversified is the productive structure of a Province. This variable is computed as follows:
N i i p 1 2 1 Varietywhere pi denotes the employment share of the 3-digit sector i.
Finally, the third variable measures urbanization economies by population density (at
each Province level), computed as the number of local units per km2 of the Province area:
P P Area LU Density
This variable captures knowledge spillovers stemming from the concentration of many different economic activities irrespective of sectoral composition. Moreover, this variable is related to the size of the agglomeration and the importance of collective equipment, facilities, and information as well as to the size of the local (labour and final goods) market.
3.2.2. The innovation equation
The second equation in our extended model is an innovation production function which estimates the drivers of innovation output. Innovation output is measured first as the
propensity to create a new product or a new process (Innovation). Since we deal with a
binary variable, we estimate a Probit model of the following type:
[3] Pr(Innovationi 1|X xi)(Rrˆx2i2 2i)
where Innovation is the variable underlying the choice to innovate, x2 is a set of
explanatory variables, β2 is the related vector of coefficients and ε2 is the error term,
distributed according to a standard normal distribution with zero mean and unit variance. The set of explanatory variables includes absorptive capacity factors and knowledge inputs (Cohen and Levin, 1991). Among the former, we include firm market share, a set of industry-specific dummies, investment intensity (computed as the sum of 1998-2000 real investments in new machinery and equipment, in logs) and spatial agglomeration variables. Including spatial agglomeration in equation [3] allows us to test whether the effect of these variables on innovation output passes completely through the intensity of research or whether there are constant returns to agglomeration.
Knowledge inputs includes previous innovation activity (given by a dummy equal to 1 if the firm created a new product or process in the period 1998-2000) and the predicted value of the research equation. This accounts for persistence of innovation activity and innovation inputs, i.e. R&D intensity which, in turn, is explained by variables measured three years earlier.
In addition, we define innovation output in terms of the probability of a new product or a
new process being introduced in the three years 2001-2003,7 with the aim of
disentangling the role of local externalities in different types of innovation.
We separately estimate a bivariate Probit model in which we assume the presence of an
unobserved propensity latent variable I* proportional to the unobserved level of expected
profits from each type of innovation (j = product, process).
This latent profit is given by:
[4a] Ij*rrˆj x3j3j 3j
which can be mapped to an observable binary discrete variable Ij indicating whether a
firms introduces (or not) one of the two types of innovations:
[4b] Ij = 1 if Ij* > 0 and Ij = 0 if Ij* ≤ 0 (j = product, process).
The choices to create a new product or a new process are jointly modelled as a system of correlated equations, i.e. a system of equations with correlated error terms, which are
supposed to be jointly distributed according to a multivariate normal distribution with
variance-covariance matrix Σ given by:
[4c] 1 1 12 12
in which ρ12 represents the correlation coefficient between the two error terms.8
3.2.3. The productivity equation
After estimating R&D and innovation, we define our productivity equation by estimating a Cobb-Douglas production function with physical and human capital, local externalities and innovation output as the main determinants:
[5] yi IIi*x4i4 4i
where yi is the productivity variable, measured, respectively, as the natural logarithm of
value added per employee (in year 2003) and by TFP (at 2003) estimated through the
semi-parametric method provided by Levinsohn and Petrin (2003); x4i is the set of
explanatory variables, β4 is the related vector of coefficients, and ε4 is the error term
about we do not make any a priori assumptions.
Among x4i we include: (i) firm size; (ii) physical capital per employee (as the net book
value of physical capital adjusted for inflation); (iii) human capital (i.e. the share of managers and executives); (iv) firm organization, as given by two dummies capturing membership to a business group or a consortium in 1998-2000; and, again, (v) spatial
agglomeration. Coefficient αI is now the elasticity of productivity with respect to
innovation output.
3.2.4. The export equation
Finally, we estimate the equation for Italian firms’ export behaviour in year 2003. This is measured in three ways: (i) first, we simply estimate a Probit model for the propensity to export in 2001-2003; (ii) then, we estimate a Tobit model for the share of 2003 export sales; (iiv) finally, we estimate an ordered Probit model for the number of macro-areas into which firms exported goods in 2003.
The propensity to export is estimates according to equation [6]:
[6] Pr(exporti 1|X xi)(Yyˆi x5i5 5i)
where x5i is a set of explanatory variables, β5 is the corresponding vector of coefficients
and ε5 is the error term, which we assume to have the usual statistical properties. The
coefficient αy reflects the impact of (predicted) productivity (TFP) on the decision to
export in 2003.
8 A correlation coefficient equal to zero implies the error terms are distributed according to the standard
normal distribution, so that a univariate Probit specification can be used for both estimations. However, since our two dependent variables (product and process innovation) are significantly correlated (with a ρ equal to -0.4), we face two non-zero off-diagonal elements of Σ, which means that we need a multivariate probit specification in order to account for correlations across the disturbances of the two latent equations,
Relying on the same set of explanatory variables, we additionally focus on export intensity, computed as the share of total sales coming from the sale of goods in foreign markets. Since this variable is left and right censored to 0 and 1 respectively, we estimate a Tobit model in which we assume that such a dependent variable is continuous. The
coefficient αy, in this case, represents the marginal impact of predicted productivity on
firms international competitiveness, i.e. on the profitability of export.
Finally, we provide a non-monetary measure of export intensity. Since export sales may reflect not only the real competitiveness of firms, but also global demand conditions
(Malmberg et al., 2000), we measure export intensity also by counting the number of
macro areas9 that the firm has served through its exporting activity. We define an ordered
variable that equals 0 for purely domestic firms, 1, 2 and 3 for firms exporting in one, two and three macro regions respectively, and 4 for firms serving more than three areas. We estimate export intensity with an ordered Probit model in which we assume the error term to be normally distributed with zero mean and constant variance.
Following the recent theoretical and empirical literature on the determinants of export performance (Bernard and Jensen, 1999, 2004; Ferragina and Quintieri, 2001; Sterlacchini, 2001; Melitz, 2003), we include in our explanatory variables: (i) market share; (ii) sectoral specialization; (iii) age; (iv) membership of a business group or consortium as a measure of firm organization; (v) investment in information and communication technologies (ICT) during the three years 1998-2000 (dummy), and (vi) the predicted level of TFP.
3.2.5. The full model
The full model is given by a set of five equations, two for R&D, one for innovation output, one for productivity and one for export. We summarize these equations as follows. Research: [7] ri* x0i0 0i [8] ri x1i1 1i, innovation: [10] Pr(Innovationi 1|X xi)(Rrˆx2i2 2i) productivity (TFP): [11] yi IIi*x4i4 4i, export
9 These macro areas are: (1) EU-15 countries (Austria, Belgium, Denmark, Finland, France, Germany,
Greece, Ireland, Luxemburg, the Netherlands, United Kingdom, Spain and Sweden); (2) countries that joined the EU in 2004 (Cyprus, Estonia, Latvia, Malta, Poland, Cech Republic, Slovakia, Slovenia, Hungary); (3) Russia, Turkey and other European countries; (4) Africa; (5) Asia (excluding China); (6) China; (7) United States, Canada and Mexico; (8) Centre and South America; (9) Australia.
[12] Pr(exporti 1|X xi)(Yyˆi x5i5 5i).
3.3. The empirical findings
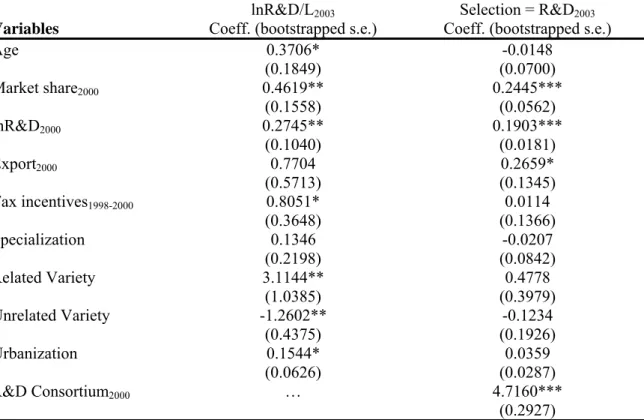
Tables 7 to 10d report the main results of our analysis. Table 7 refers to the first two equations for R&D capital; Tables 8a and 8b refer to the innovation output functions; Tables 9a and 9b refer to the TFP estimations and Tables 10a-10d refer to exporting. Table 7 shows that the intensity of R&D capital investments increases with both demand-pull and technology-push factors, or with firm’s market share and previous investment in R&D. R&D intensity is driven by firm experience and tax incentives but even more by the strong impact of spatial agglomeration: in particular, related variety and urbanization play a highly statistically significant and positive role in increasing the intensity of R&D, once the decision to invest in this activity is taken. Unrelated variety, in contrast, decreases R&D intensity.
The positive relationship between R&D and related variety can be viewed from two
perspectives. On the one hand, following Frenken et al. (2007), R&D may benefit more
from local knowledge spillovers from related sectors, i.e., from new ideas derived from different, complementary, knowledge sources. On the other hand, unrelated variety may be associated with increased knowledge dispersion and it may decrease the expected returns to R&D, thus lowering levels of R&D investment.
The positive effect of urbanization economies may reflect the fact that large agglomerations, or large cities, may host a variety of activities linked to R&D universities, research laboratories, advanced services, local credit, trade associations and
other knowledge-based organizations. According to Frenken et al. (2007, p. 687), “the
diverse industry mix in an urbanized locality also improves the opportunities to interact, copy, modify, and recombine ideas, practices and technologies across industries giving rise to Jacobs externalities”.
Table 7 – Research capital
lnR&D/L2003 Selection = R&D2003
Variables Coeff. (bootstrapped s.e.) Coeff. (bootstrapped s.e.)
Age 0.3706* -0.0148 (0.1849) (0.0700) Market share2000 0.4619** 0.2445*** (0.1558) (0.0562) lnR&D2000 0.2745** 0.1903*** (0.1040) (0.0181) Export2000 0.7704 0.2659* (0.5713) (0.1345) Tax incentives1998-2000 0.8051* 0.0114 (0.3648) (0.1366) Specialization 0.1346 -0.0207 (0.2198) (0.0842) Related Variety 3.1144** 0.4778 (1.0385) (0.3979) Unrelated Variety -1.2602** -0.1234 (0.4375) (0.1926) Urbanization 0.1544* 0.0359 (0.0626) (0.0287) R&D Consortium2000 … 4.7160*** (0.2927)
N. Obs. 715 Uncensored Obs. 353 Mills Lambda 3.929*** Wald χ2 (21) 154.36 (p < 0.000)
Notes: *p < 0.05, **p < 0.01, ***p < 0.001. Estimations include 13 industry-specific dummies.
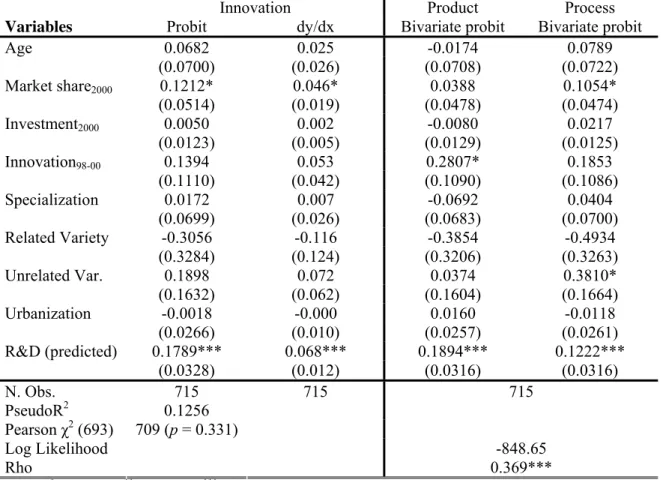
Table 8a shows that the impact of spatial agglomeration externalities is concentrated in the input phases of the innovation process. The propensity to innovate, in line with the Schumpeterian view of innovation, is affected mainly by R&D and firm size, i.e. market share.
When we investigate product and process innovation separately, we find that, while the former is driven more by past experience and R&D investments, and less by size, the latter depends much more on market share and investment in new equipment. This
confirms the results in the literature on innovation in Italy (Parisi et al., 2006), where
process innovation is shown to favour large firms and is embodied in new machinery and capital goods.
In addition, we find a significant role of unrelated variety: being located in a highly diversified productive structure increases the probability of a process innovation. If the introduction of a process innovation reflects capital-embodied technological change, then we can reasonably expect that different capital goods may come from firms belonging to different industries. Therefore, although on the one hand unrelated variety may hinder R&D investment, on the other, it may favour process innovation by increasing the pool of firms providing capital goods.
Table 8a – Innovation output
Innovation Product Process
Variables Probit dy/dx Bivariate probit Bivariate probit
Age 0.0682 0.025 -0.0174 0.0789 (0.0700) (0.026) (0.0708) (0.0722) Market share2000 0.1212* 0.046* 0.0388 0.1054* (0.0514) (0.019) (0.0478) (0.0474) Investment2000 0.0050 0.002 -0.0080 0.0217 (0.0123) (0.005) (0.0129) (0.0125) Innovation98-00 0.1394 0.053 0.2807* 0.1853 (0.1110) (0.042) (0.1090) (0.1086) Specialization 0.0172 0.007 -0.0692 0.0404 (0.0699) (0.026) (0.0683) (0.0700) Related Variety -0.3056 -0.116 -0.3854 -0.4934 (0.3284) (0.124) (0.3206) (0.3263) Unrelated Var. 0.1898 0.072 0.0374 0.3810* (0.1632) (0.062) (0.1604) (0.1664) Urbanization -0.0018 -0.000 0.0160 -0.0118 (0.0266) (0.010) (0.0257) (0.0261) R&D (predicted) 0.1789*** 0.068*** 0.1894*** 0.1222*** (0.0328) (0.012) (0.0316) (0.0316) N. Obs. 715 715 715 PseudoR2 0.1256 Pearson χ2 (693) 709 (p = 0.331) Log Likelihood Rho -848.65 0.369***
Notes: * p < 0.05, **p < 0.01, ***p < 0.001. Cluster-robust standard errors in parentheses. Estimations
include 13 industry-specific dummies. Pearson chi-squared statistics refers to Hosmer and Lemeshow goodness of fit test.
Table 8b – Marginal effects after bivariate probit estimation
Product Process
Variables Marginal Joint Marginal Joint
Age -0.007 -0.018 0.031 0.019 Market share2000 0.015 -0.010 0.041* 0.015 Investment2000 -0.003 -0.006 0.008* 0.006* Innovation98-00 0.110* 0.030 0.072 -0.009 Specialization -0.027 -0.023 0.016 0.020 Related Variety -0.151 0.002 -1.192 -0.038 Unrelated Var. 0.015 -0.060 0.148* 0.072* Urbanization 0.006 0.006 -0.005 -0.005 R&D (predicted) 0.075*** 0.021** 0.047*** -0.006
Another interesting result emerges from the productivity estimates (Tables 9a and 9b).
While, as expected, innovation output contributes directly to TFP (as in Crépon et al.,
1998), this impact is statistically significant at the 5% level. Complementary to innovation, size and localization externalities strongly contribute to increasing productivity, while variety does not play role in either TFP or labour productivity. This result is in line with the literature on the sources of local productivity growth (Cingano and Schivardi, 2003); however, our structural model allows us to identify a positive role also for variety-based externalities, an effect that is not directly captured in reduced form models, since it is filtered by the impact of R&D on innovation, and innovation on productivity.
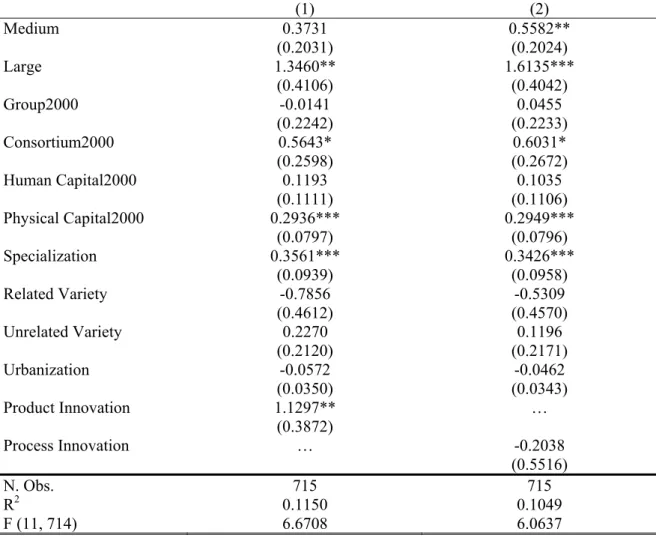
Table 9b shows that the impact of innovation on TFP is due to product rather than process innovation. In this respect, we can speculate that related rather than unrelated variety, impacts indirectly on productivity.
Table 9a – Productivity (1) (2) TFP Y/L Medium 0.3622 0.0762 (0.2062) (0.0506) Large 1.2787** 0.2224* (0.4162) (0.0952) Group2000 0.0016 0.1470* (0.2248) (0.0719) Consortium2000 0.5565* 0.0952 (0.2616) (0.0679) Human Capital2000 0.1161 0.0581 (0.1110) (0.0304) Physical Capital2000 0.2631*** 0.0509* (0.0791) (0.0232) Specialization 0.3262*** 0.0330* (0.0942) (0.0258) Related Variety -0.7293 0.2059 (0.4620) (0.1101) Unrelated Variety 0.1303 -0.0788 (0.2095) (0.0626) Urbanization -0.0517 -0.0085 (0.0348) (0.0085) Innovation 0.3666* 0.1037** (0.1570) (0.0394)
N. Obs. 715 715
R2 0.111 0.100
F (11, 714) 6.1965 7.8056
Notes: cluster-robust standard errors in parentheses. *p < 0.05, **p < 0.01, ***p < 0.001.
Table 9b – Product innovation, process innovation and TFP
(1) (2) Medium 0.3731 0.5582** (0.2031) (0.2024) Large 1.3460** 1.6135*** (0.4106) (0.4042) Group2000 -0.0141 0.0455 (0.2242) (0.2233) Consortium2000 0.5643* 0.6031* (0.2598) (0.2672) Human Capital2000 0.1193 0.1035 (0.1111) (0.1106) Physical Capital2000 0.2936*** 0.2949*** (0.0797) (0.0796) Specialization 0.3561*** 0.3426*** (0.0939) (0.0958) Related Variety -0.7856 -0.5309 (0.4612) (0.4570) Unrelated Variety 0.2270 0.1196 (0.2120) (0.2171) Urbanization -0.0572 -0.0462 (0.0350) (0.0343) Product Innovation 1.1297** … (0.3872) Process Innovation … -0.2038 (0.5516) N. Obs. 715 715 R2 0.1150 0.1049 F (11, 714) 6.6708 6.0637
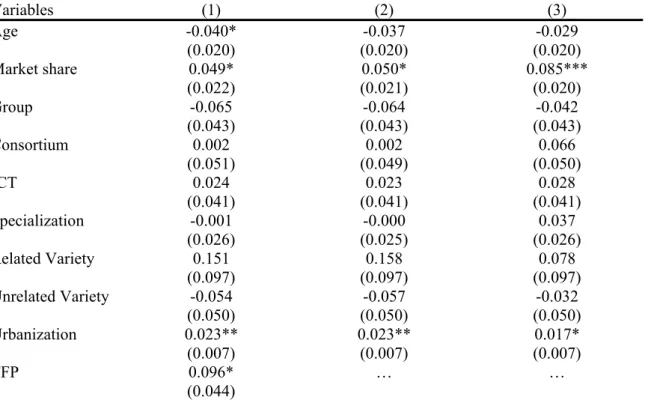
Finally, we test the role of TFP on export performance through a set of three specifications. First, we focus on the probability to export. Table 10a shows that younger, more productive and more “urbanized” firms are more willing to enter foreign markets. Therefore, in addition to TFP, we find that firms use other means to cope with the fixed costs associated with internationalization: the density of the urban structure. As before, the local availability of advanced services, qualified skills, infrastructures, universities, information sources and so on may help firms to reduce the sunk costs associated with the sale of goods at the international level.
These results are confirmed when we measure export intensity through export sales (Table 10b) and the number of macro-regions (Tables 10c and 10d). The higher the intensity of export, the higher the complementary role of TFP and urbanization economies.
Table 10a – Propensity to export, 2003 (marginal effects at the mean) Variables (1) (2) (3) Age -0.057* -0.054* -0.040 (0.027) (0.027) (0.027) Market share 0.044 0.046 0.087*** (0.026) (0.025) (0.024) Group -0.108 -0.108 -0.084 (0.059) (0.059) (0.059) Consortium -0.000 0.000 0.079 (0.073) (0.072) (0.066) ICT 0.030 0.030 0.035 (0.048) (0.048) (0.048) Specialization -0.016 -0.016 0.035 (0.032) (0.030) (0.031) Related Variety 0.222 0.233 0.116 (0.121) (0.121) (0.119) Unrelated Variety -0.057 -0.062 -0.030 (0.059) (0.059) (0.059) Urbanization 0.031** 0.031** 0.024* (0.010) (0.010) (0.010) TFP 0.151** … … (0.057) TFP_product … 0.149** … (0.052) TFP_process … … 0.006 (0.051) N. Obs. 715 715 715 Pseudo R2 0.1541 Log Likelihood -397.3614 -396.7140 -400.8225 Wald χ2 (22) 114.82 (p<0.000)
Cluster-robust standard errors in parentheses. *p < 0.05, **p < 0.01, ***p < 0.001.
Table 10b – Export intensity: share of export sales, 2003 (marginal effects after Tobit)
Variables (1) (2) (3) Age -0.040* -0.037 -0.029 (0.020) (0.020) (0.020) Market share 0.049* 0.050* 0.085*** (0.022) (0.021) (0.020) Group -0.065 -0.064 -0.042 (0.043) (0.043) (0.043) Consortium 0.002 0.002 0.066 (0.051) (0.049) (0.050) ICT 0.024 0.023 0.028 (0.041) (0.041) (0.041) Specialization -0.001 -0.000 0.037 (0.026) (0.025) (0.026) Related Variety 0.151 0.158 0.078 (0.097) (0.097) (0.097) Unrelated Variety -0.054 -0.057 -0.032 (0.050) (0.050) (0.050) Urbanization 0.023** 0.023** 0.017* (0.007) (0.007) (0.007) TFP 0.096* … … (0.044)
TFP_product … 0.095* … (0.041) TFP_process … … -0.016 (0.040) N. Obs. 715 715 715 Uncensored Obs. 450 450 450 Pseudo R2 0.1887 0.1896 0.1839 Log Likelihood -390.18 - 389.75 -400.8225
Cluster-robust standard errors in parentheses. *p < 0.05, **p < 0.01, ***p < 0.001.
Table 10c – Export intensity: number of macro-regions (ordered Probit coefficients)
(1) (2) (3) Age -0.0142 -0.0087 0.0139 (0.0587) (0.0582) (0.0581) Market share 0.2000*** 0.2007*** 0.2794*** (0.0518) (0.0497) (0.0474) Group -0.1221 -0.1233 -0.0803 (0.1195) (0.1194) (0.1205) ICT 0.2027 0.2024 0.2135* (0.1065) (0.1064) (0.1063) Specialization -0.0254 -0.0265 0.0611 (0.0686) (0.0671) (0.0664) Related Variety 0.4975 0.5215 0.2999 (0.2705) (0.2710) (0.2667) Unrelated Variety -0.2599* -0.2704* -0.2080 (0.1319) (0.1322) (0.1321) Urbanization 0.0804*** 0.0801*** 0.0685** (0.0222) (0.0221) (0.0222) TFP 0.2630* … … (0.1092) TFP_product … 0.2666** … (0.1010) TFP_process … … 0.0113 (0.1008) N. Obs. 715 715 715 Log Likelihood -1025.35 -1024.76 -1028.24 Pseudo R2 0.0874 0.0879 0.0848 LR test 66.30 (p=0.364) 66.57 (p=0.355) 67.12 (p=0.338)
Cluster-robust standard errors in parentheses. * p < 0.05, ** p < 0.01, *** p < 0.001. LR test refers to
approximate likelihood-ratio test for equality of coefficients.
Table 10d – Marginal effects of selected variables after ordered probit estimation
N. of countries 1 2 3 4 Market share -0.015** 0.005* 0.018*** 0.056*** ICT(*) -0.013* 0.008 0.019 0.054* Specialization 0.002 -0.001 -0.002 -0.070 Related Variety -0.038 0.014 0.045 0.139 Unrelated Variety 0.020 -0.007 -0.002 -0.073* Urbanization -0.006* 0.002* 0.007** 0.022** TFP -0.020* 0.007* 0.024* 0.073* TFP_product -0.020* 0.007* 0.024* 0.074** TFP_process -0.001 0.000 0.001 0.003
4. Conclusions
Using a large sample of Italian manufacturing firms, we estimate a structural model of research, innovation, productivity and export performance augmented to take account of the role played by local externalities. In so doing, we combine three main bodies of the recent literature: (i) works concerned with the empirical determinants of innovative activities; (ii) studies of the role played by agglomeration economies as drivers of local productivity and (iii) research linking productivity, as the main source of firm heterogeneity, to export.
The model used in the paper, which is an “enlarged” version of the CDM model, comprises four main equations. The first identifies the factors underlying the intensity of R&D investments; the second links R&D capital to innovation output; the third focuses on TFP as determined by innovation; the fourth relates export performance to TFP. To avoid problems of simultaneity, in each equation we measure our dependent variables in year 2003, while the explanatory variables refer to the period 1998-2000.
Unlike some related studies, we include in our analysis a set of variables measuring local knowledge spillovers, i.e. localization, variety and urbanization economies. The first measure captures MAR externalities based on geographical agglomeration of firms belonging to the same industry; the second focuses on Jacob externalities and knowledge spillovers from the cross-fertilization of ideas among firms operating in related and unrelated industries. The third measure concerns agglomeration economies – mainly information spillovers as local public goods – external to both firms and industry, and is related to the size of the market and the density of the urban area in which the firm is located.
Our estimates show that agglomeration economies do play a role in shaping the relationship between innovation, productivity and export performance. In particular, we find that related variety and urbanization economies promote R&D and the generation of new ideas, while specialization affects the exploitation of innovation in terms of higher levels of TFP. Finally, urbanization economies – through the availability of large labour pools, intermediate goods and services and extensive knowledge spillovers from the interactions with many local agents and institutions – do positively affect both R&D and also the propensity to export and the relative export intensity.
One of the main contributions of this paper is that, unlike other studies in this area, we do not rely on a “reduced form” relationship, but, rather, we estimate a structural model in which we identify the forms of spatial agglomeration that affect innovation, productivity and export performance. In this sense, this approach can be seen as providing a better understanding of these relationships, opening the “black box” of the mechanisms that are at the basis of firms’ competitive advantage.
References
Antonelli, C. (2003), The Economics of Innovation, New Technologies and Structural Change,
Routledge, London.
Bagella, M., & Becchetti, L. (2000), The Competitive Advantage of Industrial Districts. Theoretical and Empirical Analysis, Physica-Verlag, Heidelberg, Germany.
Banca Intesa (2008), Monitor dei Distretti, Servizio Studi e Ricerche, Trimestrale n. 21, Milan. Becattini, G. (1989), “Sector and/or Districts: Some Remarks on the Conceptual Foundations of
Industrial Economics”. In Goodman, E. & Bamford, J. (eds.), Small Firms and Industrial Districts in Italy, Routledge, London.
Becchetti, L. & Rossi, S.P.S. (2000), The Positive Effect of Industrial District on the Export Performance of Italian firms. Review of Industrial Organization.V.16: 53-68.
Bernard, A.B. & Jensen, J.B. (1995), Exporters, Jobs and Wages in US Manufacturing: 1976-1987. Brooking Papers on Economic Activity - Microeconomics. V. 1995: 67-119.
Bernard, A.B. & Jensen, J.B. (1999), Exceptional Export Performance: Cause, Effect, or Both?
Journal of International Economics. V. 47:1-25.
Bernard, A.B. & Jensen, J.B. (2004), Why Firms Export. Review of Economics and Statistics. V. 86: 561-569.
Best, M. (1990), The new competition. Institutions of industrial restructuring, Harvard University Press, Cambridge, Massachusetts.
Boschma, R.A., & Lambooy, J.G. (2002), Knowledge, Market Structure, and Economic Coordination: Dynamics of Industrial Districts. Growth and Change. V.33(3): 291–311. Boschma, R.A., & ter Wal, A. (2007), Knowledge Networks and Innovative Performance in an
Industrial District. The Case of a Footwear District in the South of Italy. Industry and Innovation.V.14(2): 177–199.
Boschma, R. & Iammarino, S. (2009), Related Variety, Trade Linkages and Regional Growth in Italy. Economic Geography. V.85(3): 289-311.
Brusco, S. (1982), The Emilian Model: Productive Decentralisation and Social Integration.
Cambridge Journal of Economics. V.6: 167–184.
Brusco, S., Cainelli, G., Forni, F., Franchi, M., Malusardi, A. & Righetti, R. (1996), “The Evolution of Industrial Districts in Emilia Romagna”, in Cossentino, F., Pyke, F. & W. Sengenberger (eds.), Local and Regional Response to Global Pressure: The Case of Italy and its Industrial Districts, International Labour Office, Geneva, Switzerland.
Cainelli, G. & Leoncini, R. (1999), Externalities and Long-Term Industrial Development. Some Empirical Evidence From Italy. Revue d’Economie Industrielle. V. 90: 25-40.
Cainelli, G., Evangelista, R. & Savona, M. (2006), Innovation and Economic Performance in Services. A Firm-Level Analysis. Cambridge Journal of Economics. V.30(3): 435-458. Castellani, D. & Zanfei, A. (2007), Internationalisation, Innovation and Productivity. How Do
Firms Differ in Italy. The World Economy. V. 30(1) : 156-176.
Castellani, D., Serti, F. & Tomasi, C. (2009), Firms in International Trade: Importers and Exporters Heterogeneity in the Italian Manufacturing Industry, University of Perugia, mimeo. Chevassous-Lozza, E.& Galliano, D. (2008), Local Spillovers, Firm Organization and Export
Behaviour: Evidence From the French Food Industry. Regional Studies. V. 37(2): 147-158. Cingano, F. & Schivardi, F. (2003), The Sources of Local Productivity Growth. Bank of Italy,
Working Paper N. 474.
Clerides, D., Lach, S. & Tybout, J. (1998), Is Learning by Exporting Important? Micro-Dynamic Evidence for Colombia, Mexico, and Marocco. Quarterly Journal of Economics. V. 113: 903-948.
Cohen, W.M. & Levin, R.C. (1989), “Empirical Studies of Innovation and Market Structure”, in Schmalensee, R. & Willig, R. (eds.), Handbook of Industrial Organization, V. 2, North Holland, Amsterdam.
Combes, P.P. (2000), Economic Structure and Local Growth: France, 1984–1993. Journal of Urban Economics. V. 47 (3): 329–355.
Crépon, B., Duguet, E. & Mairesse, J. (1998), Research, Innovation, and Productivity: An Econometric Analysis at the Firm Level. Economics of Innovation and New Technology. V. 7(2): 115-158.
Cunat, A., & Peri, G. (2001), Job Creation: Geography, Technology and Infrastructures.
Giornale degli Economisti e Annali di Economia. V. 61 (1): 23–54.
De Lucio, J. J., Herce, J.A. & Goilcolea, A. (2002), The effects of Externalities on Productivity Growth in Spanish Industry. Regional Science and Urban Economics. V. 32(2), 241–258. Dosi, G. (1988), Sources, Procedures, and Microeconomic Effects of Innovation. Journal of
Economic Literature. V.26: 1120–1171.
Fabiani, S., Pellegrini G., Romagnano, E. & Signorini, L.F. (1999), “Efficiency and Localisation: The Italian Case”, in Biffignardi, S. (ed.), Micro- and Macrodata of Firms, Statistical Analysis and InternationalCcomparison, Physica-Verlag, Heidelberg, Germany.
Ferragina, A.M. & Quintieri, B. (2001), Caratteristiche delle Imprese esportatrici Italiane, in Quintieri, B. (ed.), Le Imprese Esportatrici Italiane: Caratteristiche, Performance e Internazionalizzazione, Il Mulino, Bologna.
Forni, M. & Paba, S. (2002), Spillover and the Growth of Local Industries. Journal of Industrial Economics. V. 50(2): 151–171.
Frenken, K., Van Oort, F. & Verburg, T. (2007), Related Variety, Unrelated Variety and Regional Economic Growth. Regional Studies. V. 41(5): 685-697.
Glaeser, E.L., Kallal, H., Scheinkman, J. & Schleifer, A. (1992), Cities and Growth. Journal of Political Economy. V. 100: 1126-1152.
Gordon, I.R., & McCann, P. (2001), Industrial Clusters: Complexes, Agglomeration and/or Social Network. Urban Studies. V.37(3): 513–532.
Gordon, I.R., & McCann, P. (2005), Clusters, Innovation and Regional Development. Journal of Economic Geography. V.5(5): 523–543.
Griffith, R., Redding, S. & Van Reenen, J. (2004), Mapping the Two Faces of R&D: Productivity Growth in a Panel of OECD Industries. Review of Economics and Statistics. V. 86(4), 883-895.
Griliches, Z., & Mairesse, J. (1985), R&D and Productivity Growth: Comparing Japanese and U.S. Manufacturing Firms, NBER Working Paper Series N. 1778.
Griliches, Z., & Mairesse, J. (1995), Production Functions: The search for Identification, NBER Working Paper Series, N. 5067.
Hall, B. & Mairesse, J. (1995), Exploring the Relationship Between R&D and Productivity in French Manufacturing Firms. Journal of Econometrics. V.21: 89–119.
Harhoff, D. (1998), R&D and Productivity in German Manufacturing Firms. Economics of Innovation and New Technology. V.6: 29–49.
Heckman, J. (1976), The Common Structure of Statistical Models of Truncation, Sample Selection, and Limited Dependent Variables and a Simple Estimator for Such Models,
Annals of Economic and Social Measurement. V. 5: 475-492.
Heckman, J. (1979), Sample Selection Bias as a Specification Error. Econometrica. V. 47: 153-161.
Henderson, V. J. (2003), Marshall’s Scale Economies. Journal of Urban Economics. V. 53(1): 1–28.
Henderson, V. J., Kunkoro, A. & Turner, M. (1995), Industrial Development in Cities. Journal of Political Economy. V. 103(5): 1067–1090.
Iammarino, S., & McCann, P. (2006), The Structure and Evolution of Industrial Clusters: Transactions, Technology and Knowledge Spillovers. Research Policy. V.35(7): 1018–1036. Langlois, R., & Robertson, P.L. (1995), Firms, Markets and Economic Change. A Dynamic
Theory of Business Institutions, Routledge, London.
Levinsohn, J. & Petrin, A. (2003), Estimating Production Functions Using Inputs to Control for Unobservables. Review of Economic Studies. V. 70(2): 317-341.
Malerba, F., & Orsenigo, L. (1995), Schumpeterian Patterns of Innovation. Cambridge Journal of Economics. V.19: 47–65.