From Cloud Computing Adoption to Value Creation: A Sustainable Business Models
Track: Information Technology Management
From Cloud Computing Adoption to Value Creation: A Sustainable Business Models Abstract
For companies in Latin America, the potential to use Cloud Computing as a service, has the potential to be a valuable option for all types of organizations because of its accessibility and its potential to predominantly shift competitive landscapes by providing a new platform for creating and delivering business value. This paper aims to address a research gap by exploring the factors that affect the adoption of cloud computing in the high-tech industry and how cloud technologies are used to create business value. The methodology used was to design a survey to collect data from 85 SMEs Mexican companies. Keywords: Cloud Computing, Sustainable Business Models, Value Creation
Introduction.
It is only in the last few years that the level of interest in cloud computing has seen massive growth, particularly as a research topic. Previous research has argued that cloud computing has the power to predominantly shift competitive landscapes by providing not just a new platform for creating and delivering business value, and making room for new business models, but “breaking up traditional value chains and making room for new business models” (Leimester et al., 2010). Many providers like Amazon, Google, IBM, Microsoft, Salesforce, and Sun positioned themselves as platform and infrastructure providers in the cloud computing market. Beside them there emerge more and more providers, who build their own applications or consulting services upon infrastructure services offered by other market players (Leimeister et al 2010). Six patterns of benefits that companies achieve from leveraging cloud computing capabilities have been identified by Iyer and Henderson (2012) in their field study of seven early adopter companies. Such benefits include collective problem-solving, increased business focus and business model experimentation. Nonetheless, despite the rapid emergence of cloud computing, empirical research on the business value of cloud computing is quite limited (Iyer and Henderson, 2010; Leimeister et al, 2010), with most of it focusing on technical related issues. The literature to date has neither utilized existing conceptual frameworks that better explain value creation with cloud computing, nor has it clearly articulated the central issues related to this phenomenon. Therefore, this study strives to fill this gap by examining the determinants of cloud computing adoption and how the adoption level creates value for SMEs, not having the capital or resources to integrate an IT facility or the skills or staff to support their business activities.
The purpose of this study, therefore, is to address this research gap through two specific objectives:
1.
To identify factors that influence the cloud computing adoption level.The research objective and approach adopted in this paper is field based, the findings and analysis presented would clarify the determinants of cloud computing adoption and value creation. The paper concludes with a discussion of the implications of a case study, along with directions for future research.
Theoretical Framework. Cloud Computing Definitions
Based on a literature review, it is clear that there are many definitions of cloud computing (Armbrust et al., 2010). According to Mell and Grance (2011), cloud computing is a technology model is which any and all resources-application software, processing power, data storage, backup facilities, development tools, literally everything-are delivered as a set of services via the Internet.
Users of cloud computing technology can access the provided services on the Internet without having any previous operational knowledge. It is divided into a number of segments that include the cloud infrastructure, cloud platforms, and cloud applications. The US National Institute of Standards and Technology (NIST) has published a working definition (Mell and Grance, 2011) that is often cited and viewed as one of the more articulate, clear yet comprehensive classifications of cloud computing. This definition, which will be the one adopted in this study, describes cloud computing as containing:
•
Five characteristics: on-demand self-service, broad network access, resource pooling, rapid elasticity, and measuredservice.
•
Four deployment models: private clouds, community clouds, public clouds, and hybrid clouds.•
Three service models: Software as a Service (SaaS), this model allows users to pay for the software per one use; Platform as a Service (PaaS), which means that computing processing capacity is purchased on the web; and Infrastructure as a Service (IaaS), which allows cloud computing users to pay for the technology on a pay per use basis. Technology Organization and Environment Adoption FrameworkThe Technology Organization and Environmental (TOE) TOE framework was developed in 1990 byTornatzky and Fleischer (1990), identifying three aspects a company takes into account that influence the process by which it adopts and implements a technological innovation: technological domain, organizational domain, and environmental domain. (1) the Technological domain describes both the internal and external technologies relevant to the firm. This includes current practices and equipment internal to the firm, as well as the set of available technologies external to the firm; (2) Organizational domain refers to descriptive measures about the organization such as scope, size, and organizational structure; and (3) Environmental domain identifies the arena in which a firm conducts its business (industry, competitors, government and regulation agencies, etc.)
Value Creation Concept and Frameworks
Theoretical frameworks, like Porter’s (1985) value chain analysis, have been used to review value creation in general. However, Prahalad and Ramaswamy (2002) argued that while the concept of the value chain is more company-centric for the industrial age. This company-centric view is also contrary to the cloud phenomenon more in pace with ecosystems and collaboration networks as it is evident from the existing literature (Iyer and Henderson, 2012; Leimester et al., 2010) that firms collaborate with various strategic alliances such as suppliers, intermediaries, strategic partners and/or customers to improve their internal capabilities or expand the market for external use of their respective cloud offerings.
Another theory of the firm that makes important suggestions about value creation is transaction cost economics (TCE). However, TCE theory focuses on cost minimization and neglects innovation (Lazonick, 1993) and the mutual relationship between exchange parties and the opportunities for value creation that this presents (Amit and Zott, 2001).
Leimeister et al. (2010) suggests that with cloud computing, the traditional value chain becomes more complex and breaks up into a multitude of different actors and their interactions to depict a network rather than a sequential chain. Additionally, within a value network of cloud computing, value is created by providing services that are valuable for other participants in the network (Iyer and Henderson, 2012; Leimeister et al., 2010). Given that many of the traditional methods for analyzing value creation are not suitable for understanding the business value of cloud computing, so in this paper a business model perspective offers a more effective approach to better explore value creation in economic, pragmatic and social domains (Corrales, 2013). The economic value is determined by flexible pricing models, enhanced revenue streams, and increase in market share with the attraction of new customers with an innovative solution. The pragmatic value is determined by compliance, service level agreements, security and privacy, reliability and trust, interoperability, market adaptability to develop and launch new product and service offerings, more end user simplicity, best practice mobilization, and context-driven variability. The social value is determined by branding the customer experience by looking within and beyond the organization’s borders, access to a new value nets and ecosystem connectivity. Moreover, the most obvious opportunity in utilizing this framework is the fact that few, if any, scholars have applied a business model lens to study value creation in a cloud computing context.
Business Model Generation
Value creation is a key dimension of business innovation, starting by designing a sound and strong business model (West, 2007). Creating value necessitates identifying a relevant customer segment, the value proposition for those customers, and the ways in which the business model will provide that value (Chesbrough and Rosenbloom, 2002; Morris et al., 2005; West, 2007). In addition, Keen and Williams (2012) agree that value creation is a core element of a business model and argue that successful firms create substantial value by doing things that differentiate them from the competition.
According to Chesbrough (2004) the business model uses both external and internal ideals to create value, while defining internal mechanisms to claim some portion of that value. Similarly, Keen and Williams (2012) argue that a business model is a representation of a firm’s value proposition with strategic choices for creating value. Similarly Amit and Zott (2001) propose that a firm’s business model is an important path of innovation and a crucial source of value creation for the firm and strategic alliances with its suppliers, partners and customers. Several researchers have explored what might be included in a business model and have decomposed business models into components. Chesbrough and Rosenbloom (2002) present a basic framework describing the business model as having six elements: 1) value proposition, 2) market segment, 3) value chain structure, 4) revenue generation and margins, 5) position in value network and 6) competitive strategy.
Osterwalder et al., (2005) also investigated what elements were used in business model research and propose a comprehensive framework that focuses on nine building blocks to generate a business model (see Table 1). These components are common elements identified also by Chesbrough and Rosenbloom (2002), West (2007), Morris et al. (2005), and Keen and Williams (2012).
Table 1: Nine Building Blocks to Generate a Business Model (Source: Osterwalder et al., 2005)
Business Model Components Description
Product Value Proposition Articulates a company’s bundle of services and products and the valuedelivered to the customer as well as the problems being solved
Customer Relationship
Customer Segments Describes the segment of customers the company targets to delivervalue Channels Describes the most efficient channels of the company to reach itscustomers Customer
Relationship
Describes the strategies to access, retain and maintain the customer experience with the customers to gain loyalty, network externalities and feedback
Infrastructure Management
Key Activities Describe the key activities to deliver value in terms of channels,relationships, products, problem solving, platforms and networks (I+D, design, marketing, innovation)
Key Resources
Identify the key resources the company integrates to deliver value in terms of assets (people, intellectual property: patents, copy rights, brand, data, infrastructure, financial)
Key Partners and
Network Portrays the network of strategic alliances and agreements with othercompanies necessary to efficiently offer and commercialize value Financial
Aspects
Cost Structure Quantifies the cost sources required to execute and evolve the businessmodel Revenue Streams Describes the way a company makes money through a variety ofrevenue flows
This business model framework builds on and integrates the main domains for value creation on behalf of the customer to deliver an unmet need, considering the company’s own capacities and the partners’ capacities to collaborate and to innovate in a deliberate and continuous process. However, one important building block that is embedded in this framework is that of a partner network, an element that is lacking in traditional approaches and something that it is extremely important in the cloud computing context (decoupling, modularity, and media convergence).
Research Model.
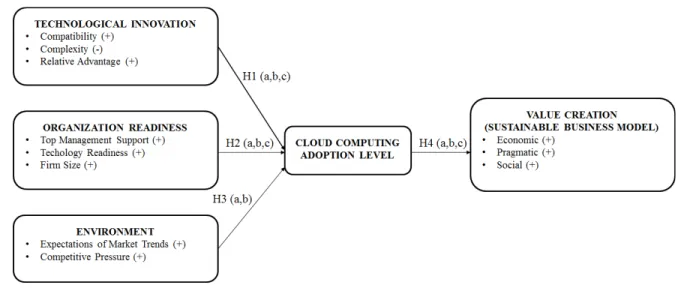
Considering the theoretical framework, a research model was developed to explore the relationship between adoption factors and cloud computing adoption, and the relationship between cloud computing adoption and business value creation (see Figure 1).
Figure 1. Research Model for Cloud Computing Adoption
Hypotheses and Constructs’ Conceptualization
Technological Innovation: There is a significant relationship between Technological Innovation and the Cloud Computing Adoption. For this research, the constructs include compatibility, complexity and relative advantage.
•
Compatibility (CM) assesses the alignment of the cloud computing technology with the existing IT infrastructure, previous practices, current and future needs of the company (Rogers, 1983)•
H1a:Compatibility will be positively and significantly correlated with the adoption of cloud computing•
Complexity (CX) is the degree to with cloud computing is perceived as relatively new and difficult to understand and use by the organization (Rogers, 1983)•
H1b:Complexity will be negatively and significantly correlated with the adoption of cloud computing•
Relative Advantage (RA) is the degree to with cloud computing is perceived as providing greater benefit for the organization (Armbrust et al., 2010)•
H1c:Relative Advantage will be positively and significantly correlated with the adoption of cloud computing Organization Readiness: This construct is used to assess whether the organization has the necessary attributes to ensure the overall readiness towards adopting cloud computing.•
Top Management Support (TS) is critical or creating a supporting climate and for providing adequate resources for the adoption of new technologies (Wang et al., 2010)•
Technology Readiness (TR) include assessing skill sets of the IT team, identifying infrastructure enhancements necessary to accommodate the new technology and evaluating and prioritizing which shared business process should be automated. It requires an organization to plan, commit and execute according to requirements established with strategic alliances (Nelson and Shaw, 2003).•
H2b:Technology Readiness will be positively and significantly correlated with the adoption of cloud computing•
Firm Size (FS) is reported to be a factor for cloud computing adoption, due that large firms tend to adopt more innovations, largely due to their greater flexibility and ability to take risk (Pan and Jang, 2008)•
H2c:Firm Size will be positively and significantly correlated with the adoption of cloud computingEnvironment: The competitive pressure and the expectations in the market trends of cloud computing in the industry can force companies into adopting cloud computing technologies to gain competitive advantages over their rivals (Nelson and Shaw, 2003).
•
Expectations of Market Trends (ET) in high tech industries put pressure in innovative companies to adopt technologies being proven of high potential value for the market in which the company is or wants to participate (Nelson and Shaw, 2003)•
H3a:Expectations of Market Trends will be positively and significantly correlated with the adoption of cloud computing•
Competitive Pressure (CP) refers to the level of pressure felt by the firm from competitors within the industry (Oliveira and Martins, 2010).•
H3b:Competitive Pressure will be positively and significantly correlated with the adoption of cloud computing Value Creation: This construct is used to assess how cloud computing adoption creates value for the company, generating a more sustainable business model (Corrales, 2013).•
Economic Value Creation (EV) is measure in terms of reducing costs, increasing ROA and ROE (Corrales, 2013).•
H4a:Cloud Computing Adoption will be positively correlated with Economic Value Creation•
Pragmatic Value Creation (PV) is measure in terms of adopting best practices and certified process (Corrales, 2013).•
H4b:Cloud Computing Adoption will be positively correlated with Pragmatic Value Creation•
Social Value Creation (SV) is measure in terms of brand, image, market leadership (Corrales, 2013).•
H4c: Cloud Computing Adoption will be positively correlated with Social Value CreationResearch Methodology.
A survey was designed to validate the research model and to test the hypothesis and the sample was part of a Mexican high tech telecommunication’s customer base.
The questionnaire was sent to 320 users (selected from the top customers) of different IT services (data centers, SaaS, PaaS, security services, cloud computing). The study included eight constructs with 42 items taken from previous literature but adapted to fit the cloud computing adoption.
The responses received were from 85 SMEs high tech firms, with a response rate of 26.56%. All the constructs were based on proved literature research, with some adaptation for cloud computing adoption (see Table 2).
Table 2. Literature Sources for Construct Conceptualization and Operationalization.
CONSTRUCTS FACTORS LITERATURE SOURCES
Technological Innovation
•
Compatibility•
Complexity•
Relative AdvantageRogers, 1983 Rogers, 1983 Armbrust et al., 2010 Organization Readiness
•
Top Management Support•
Technology Readiness•
Firm SizeWang et al., 2010 Nelson and Shaw, 2003 Pan and Jang, 2008
Environment
•
Expectations of Market Trends•
Competitive PressureNelson and Shaw, 2003 Oliveira and Martins, 2010
Value Creation
•
Economic Value•
Pragmatic Value Creation•
Social Value CreationCorrales, 2013 Corrales, 2013 Corrales, 2013
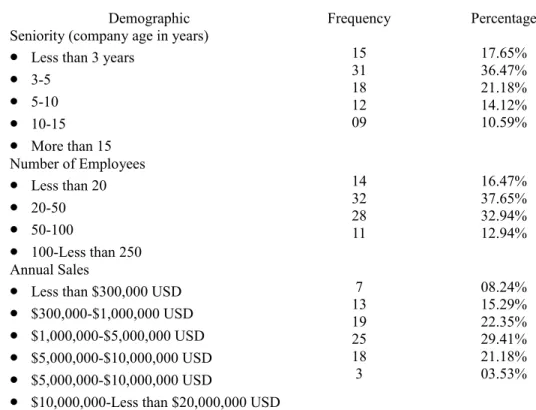
The demographics and profile of the 85 high tech Mexican SMEs in terms of seniority, number of employees, and annual sales are shown in Table 3.
Table 3. SMEs Demographics.
Demographic Frequency Percentage
Seniority (company age in years)
•
Less than 3 years•
3-5•
5-10•
10-15•
More than 15 15 31 18 12 09 17.65% 36.47% 21.18% 14.12% 10.59% Number of Employees•
Less than 20•
20-50•
50-100•
100-Less than 250 14 32 28 11 16.47% 37.65% 32.94% 12.94% Annual Sales•
Less than $300,000 USD•
$300,000-$1,000,000 USD•
$1,000,000-$5,000,000 USD•
$5,000,000-$10,000,000 USD•
$5,000,000-$10,000,000 USD•
$10,000,000-Less than $20,000,000 USD7 13 19 25 18 3 08.24% 15.29% 22.35% 29.41% 21.18% 03.53%
Variable Measurement
The adoption construct was initially comprised of 31 items. In order to test how these items loaded, a factor analysis was performed. Principal component extraction with varimax rotation and required Eigenvalues above 1 were considered. The results of this confirmatory factor analysis resulted in 8 factor loading cleanly with a total explained variance of 78% (see Table 4).
Three independent variables used in this research were technological innovation (TI), organizational readiness (OR) and environment (EN). The responses to the 31 items were made on a 5-point Likert Scale, ranging from 1=strongly disagree to 5=strongly agree.
Table 4. Rotated Component Matrix: Cloud Computing Adoption Level.
FACTOR CM CX RA TS TR FS ET CP CM1 0.641 CM2 0.564 CM3 0.563 CM4 0.853 CM5 0.880 CM6 0.912 CM7 0.917 CM8 0.693 CX1 0.913 CX2 0.969 CX3 0.953 RA1 0.613 RA2 0.731 RA3 0.703 RA4 0.618 RA5 0.671 RA6 0.513 TS1 0.716 TS2 0.698 TS3 0.656 TS4 0.611 TR1 0.561 TR2 0.790 FS1 0.635 FS2 0.624 FS3 0.617 FS4 0.654 ET1 0.788 ET2 0.824 CP1 0.925 CP2C 0.863 ADOPTION LEVEL 0.928 0.903 0.915 0.938 0.911 0.815 0.794 0.714 EIGENVALUE 9.862 2.431 2.113 2.761 1.323 1.527 1.801 1.216 VARIANCE 11.839 21.152 38.427 50.218 58.133 62.024 68.213 78.112
The adoption level was measured using the items from whether the organization has 1=deployed, 2=committed, 3=shown an interest, 4=aware, and 5= unaware of cloud computing. Table 4 shows that all items for the Adoption Level have loading > 0.5, and loaded significantly on their associated factors.
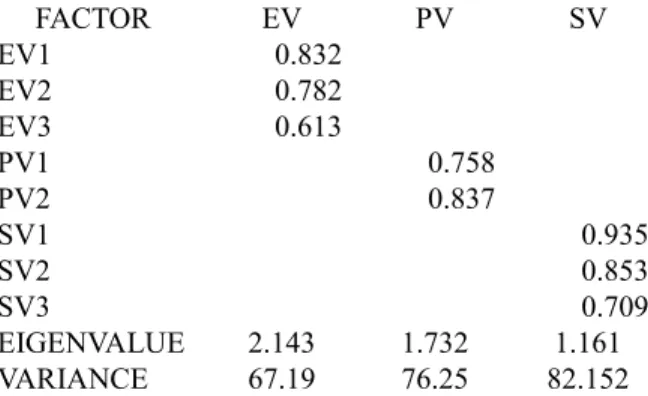
The value creation construct was measures using 8 items on a 5-point Likert Scale ranging from 1=strongly disagree to 5=strongly agree. All the items for value creation had loading > 0.5 (see Table 5).
The cloud computing solutions used in this research were based on the recommendations of senior executives from two leading telecommunication companies in Mexico. The cloud computing solutions used in this study were SaaS, PaaS, and IaaS, for private clouds, community clouds, public clouds, and hybrid clouds.
Table 5. Rotated Component Matrix: Value Creation.
FACTOR EV PV SV EV1 0.832 EV2 0.782 EV3 0.613 PV1 0.758 PV2 0.837 SV1 0.935 SV2 0.853 SV3 0.709 EIGENVALUE 2.143 1.732 1.161 VARIANCE 67.19 76.25 82.152
Table 6 shows that the Cronbach’s Alpha, in the case of Adoption Factors, the alpha values ranges from 0.76 to 0.91 for Organizational Readiness (OR); and for the case of Value Creation, the alpha value ranges from 0.72 to 0.93 for Economic Value. The results show evidence of construct validity for all factors.
Table 6. Reliability Analysis for Adoption Level and Value Creation. Adoption Factors (TOE Framework)
CONSTRUCTS CRONBACH’s ALPHA
Technological Innovation (TI) 0.83
Organization Readinexx (OR) 0.91
Environment (EN) 0.76
Value Creation Factors (Sustainable Business Model)
CONSTRUCTS CRONBACH’s ALPHA
Economic Value (EV) 0.93
Pragmatic Value (PV) 0.87
Social Value (SV) 0.72
Normality Test of Cloud Computing Adoption Level and Value Creation.
Since the data set was larger than 50 responses from the sample, the test being used was Kolmogorov-Smirnov’s to analyze normality for cloud computing adoption level and value creation. The significant level for the Kolmogorov-Smirnov test was a P value of 0.21 for cloud computing adoption and of 0.82 for value creation, both variables were more than 0.05, hence normality was assumed.
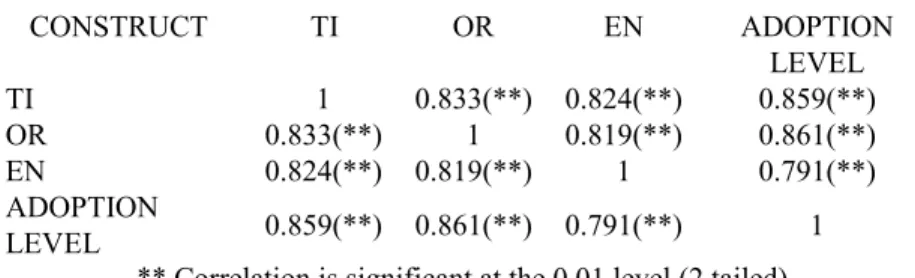
The correlation matrix in Table 7 indicated that the adoption factors were positively and strongly correlated with cloud computing adoption level. There was a significant positive relationship between technological innovation and cloud computing adoption level (r=0.859, p<0.01), organizational readiness and cloud computing adoption level (r=0.861, p<0.01), and environment and cloud computing adoption level (r=0.791, p<0.01). In Table 8 the correlation matrix shows also a positively and strong correlation between adoption level and value creation (r=0.865, p>0.01).
The correlation coefficients between the independent variables were less than 0.9, indicating that the data was not affected by a multicollinearity problem.
These correlations were also further evidence of validity and reliability of measurement scales used in this research. The results also indicated that the most relevant adoption factor affecting cloud computing adoption level was organizational readiness with a correlation of 0.861, and that the adoption level influences value creation, with a correlation of 0.865.
Table 7. Correlation Analysis between adoption factors and on cloud computing adoption level
CONSTRUCT TI OR EN ADOPTION LEVEL TI 1 0.833(**) 0.824(**) 0.859(**) OR 0.833(**) 1 0.819(**) 0.861(**) EN 0.824(**) 0.819(**) 1 0.791(**) ADOPTION LEVEL 0.859(**) 0.861(**) 0.791(**) 1
** Correlation is significant at the 0.01 level (2 tailed)
Table 8. Correlation Analysis between cloud computing adoption level and value creation
CONSTRUCT ADOPTION LEVEL VALUE CREATION ADOPTION LEVEL 1 0.865(**) VALUE CREATION 0.865(**) 1
** Correlation is significant at the 0.01 level (2 tailed) Canonical Analysis
The Canonical Analysis (CA) was selected because in this research there are multiple dependent variables and multiple independent variables. In CA there are “r” criterion variables (dependent variables) and “s” independent variables. The number of canonical correlations (functions) between these two sets of variables is the number of variables in the smaller set. In this case, the number of variables for value creation is 3 while the number of variables in the adoption level construct is 3. Thus the number of canonical functions from the analysis is 3 which correspond to the smallest set of variables.
To test the significance of the canonical correlations the criteria was (1) to consider the significance of the F value given by Wilks' Lambda, Pillai's Trace, Hotelling-Lawley Trace, and Roy's Greatest Root, and (2) to measure the overall model fit.
Table 9 shows the corresponding multivariate test of significance with (3X3) 9 degrees of freedom. The multivariate test of significance shows that all the tests are statistically at the 0.05 level.
Table 9. Multivariate Test of Significance TEST OF
SIGNIFICANCE VALUE F VALUE NUM DF F SIGNIFICANCE
Wilks' Lambda 0.65481 3.7368 9 0.000
Pillai's Trace 1.00321 4.4977 9 0.000
Hotelling-Lawley 0.46414 4.8723 9 0.000
Roy's Greatest Root 0.46743
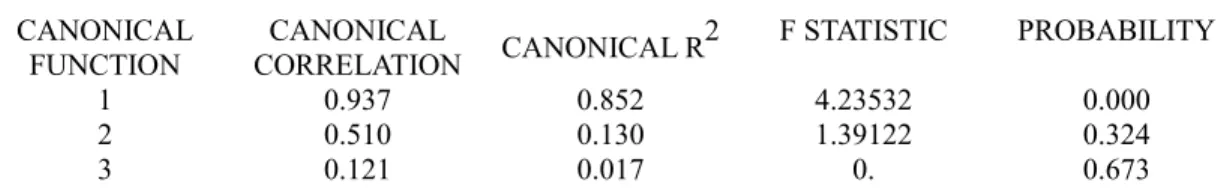
Table 10 shows the measures of the overall model fit in the three canonical functions, and also that only the first canonical
function represents a significant value of p>0.01. This finding is also relevant and consistent with the Canonical R2 in Table10, in which the independent variables explain 85.2% of the variance in the dependent variables; the second canonical correlation explains 13%, and the third explains 1.7%. So the first canonical correlation is more important than the other two. This finding also shows that the value creation and the cloud computing adoption level were significantly related with the first canonical function.
Table 10. Measures of Overall Model Fit CANONICAL FUNCTION CANONICAL CORRELATION CANONICAL R 2 F STATISTIC PROBABILITY 1 0.937 0.852 4.23532 0.000 2 0.510 0.130 1.39122 0.324 3 0.121 0.017 0. 0.673
Table 11 shows the Standardized Canonical Coefficients and Canonical Loadings. The traditional approach to interpreting canonical functions involves examining the sign and the magnitude of the canonical weight assigned to each variable in its canonical variate. Variables with relatively larger weights contribute more to the variates, and vice versa. Similarly, variables whose weights have opposite signs exhibit an inverse relationship with each other, and variables with weights of the same sign exhibit a direct relationship. However, interpreting the relative importance or contribution of a variable by its canonical weight is subject to the same criticisms associated with the interpretation of beta weights in regression techniques. Canonical loadings have been increasingly used as a basis for interpretation because of the deficiencies inherent in canonical weights. Canonical loadings, also called canonical structure correlations, measure the simple linear correlation between an original observed variable in the dependent or independent set and the set’s canonical variate. The canonical loading reflects the variance that the observed variable shares with the canonical variate and can be interpreted like a factor loading in assessing the relative contribution of each variable to each canonical function. The larger the coefficient, the more important it is in deriving the canonical variate. Also, the criteria for determining the significance of canonical structure correlations are the same as with factor loadings in factor analysis (Hair et al., 1998).
Table 11. Standardized Canonical Coefficients and Canonical Loadings DEPENDENT
VARIABLES
(CONSTRUCTS) VARIABLES
CANONICAL
WEIGHTS CANONICALLOADING RESULTS
Value Creation Economic (EV) Pragmatic (PV) Social (SV) 0.568 0.311 0.482 0.916 0.824 0.625 Accepted Accepted Accepted Adoption Level
Technology Innovation (TI) Organizational Readiness (OR) Environment (EN) 0.461 0.583 0.032 0.448 0.936 0.632 Accepted Accepted Accepted In Table 11 the canonical loadings measure the linear correlation between the independent variables and their respective canonical variates. The interpretation of the canonical loading is similar to the factor loadings, which it shows that all the canonical loading are significant for the independent variables (values > 0.3). The rank order of importance for Value Creation is Economic Value (productivity, efficiency, ROE, ROA), Pragmatic Value (best practices), and Social and Relational Value (branding, image, leadership). For the Cloud Computing Adoption Level contributing to the first canonical function the rank order of importance is Organizational Readiness (TMT support, technology readiness and firm size), Environment (market trends and competitive pressure).
Case Study
To analyze in depth the objectives of this study, one case study was documented based on being a company with a cloud initiative as part of the core business, and complementary to the core offering, to extend an exploratory study, and also the access to data from the company’s top management team, its customers and strategic alliances to deliver cloud computing solutions.
In January of 2011, the board of directors of ALESTRA was meeting to analyze the market tendencies and the capacity of the organization to take advantage of the opportunities offered by the convergence of two industries: telecommunications and information technologies.
Dr. Rolando Zubirán (CEO) described the context of the situation that ALESTRA found itself in as follows: “Our evolution has taught us that what is important is not whether there are technological changes; there have been many of those, and there will be many more. What is important is the way in which organizations adjust their mentality and their work methods in response to those technological changes. Successful organizations have the ability to unlearn old practices and learn different ones, in order to take advantage of those technological changes. In ALESTRA we have a history of success in our market orientation and in the constant enrichment of our value proposition through innovation; we have successfully reinvented ourselves on two occasions already. However, now we must ask ourselves if the organization can reinvent itself a third time when new forces of change are redefining ITC and telecommunication sectors created by the convergence. What opportunities are available to ALESTRA in this new convergence of industries? Two main alternatives are there: (1)
Should ALESTRA continue in a niche market with market operations at national scale with the trade of to compete with global giants (CISCO, IBM, HP) with vertical value propositions and customized offerings? (2) What is required in order to preserve our identity with our customers offering an integrated business customer-led solution and at the same time broaden our contribution to the value chain with ECOCOMPLEX, based on partnerships to integrate capacities in demand for our customer, but working with frenemies? What capacities do we need to develop in order to create value for our customers in a different dimension created by the convergence?”
In January of 2002, due to the change in market forces and the competitive and regulatory environment, the board of directors of ALESTRA with the support of Grupo ALFA determined the following:
1.
Given the weak regulatory environment, undertaking a legal battle with Telmex was considered to have an uncertain outcome with regard to its usefulness, magnitude and the timeframe in which the problem of the cost of interconnection could be solved. In this sense, it was decided that emphasis should be placed on actions involving creativity and talent in effecting change.2.
It was considered that the young, professional and competent profile of the organization facilitated collaboration between departments in order to modify processes and work methods to benefit the customer. Therefore, it was determined that by enriching the value proposition, the competencies of the organization would evolve so as to guarantee the delivery of value based on the promise made to the customer.3.
Since the original business plan was no longer viable and the debt capital structure produced an unbearable financial burden compared to the expected operational results, a decision was made to redimension the company in such a way that its annual sales level would be 500 million dollars instead of a billion dollars. To achieve this, it was necessary to begin a process of financial restructuring, through which it would be possible to negotiate and convince investors and creditors of the existence of a viable business project, so that they would finance investments in networks, processes and equipment to support the change in direction.4.
They decided to begin a process of transforming the portfolio of solutions which would position ALESTRA as a reliable operator that would be able to adjust to the needs of the market, providing state-of-the-art world class services that enjoyed a high perception of value, particularly with high value added services like cloud computing.ALESTRA decided to undertake a process of transformation of its sales strategy; its orientation was changed in two ways: special emphasis was given to the business-to-business market, which was attractive because it involved high-consuming customers, requiring specific solutions that were world class, more complete and comprehensive. In addition, different initiatives were created in the development of internet services, private lines and frame relay or data networks.
The development of these services demanded a scrupulous analysis of customer needs and expectations, urgent observation of market tendencies, objective evaluation of the company's own strengths, and the formulation of a sales strategy. From
the total market size, the massive market for final users was 80%, ALESTRA focused on a business niche, representing the remaining 20%; this business segment was interested in quality and service and ALESTRA had the capabilities and competences to develop and to deliver this service.
Data Sources for the Case Study
The Top Management Team was interviewed in two occasions, with an agenda than included: the CEO to document the company’s vision and markets, the CFO to cover the financial challenge, the Marketing and Commercial VP to integrate the customer-led approach, the COO to cover the value chain domain; the Human Resources VP to include the human capital resources, the External Relations with Government and Industry VP to include regulatory domains, the Strategic Planning and New Business Models VP to identify the business innovation opportunities
Data Collection and Analysis
Data collection took place between May 2013 and July 2014 and was primarily personal face-to-face interviews, to allow more elaborated and deep discussions to document factors of importance (Oppenheim, 1992; Yin, 2003). The interviews lasted between 50 and 100 minutes with an average of 12 interviews. The questions were open-ended to invite for a space to elaborate in each domain of interest and to convey their experiences and views, and expression of the socially complex contexts that underpin value creation in cloud computing (Oppenheim, 1992; Yin, 2003). All the interviews were videotaped, and conducted with a constructive approach, allowing the researcher to follow up on insights uncovered mid-interview, and open the possibility to reschedule a follow-up interview
To improve the reliability and repeatability of the research, a traceable, video and audit documentation of the research process, from data collection through to the drawing of conclusions, was followed. As part of the protocol the researcher identified and selected who to interview and how the interviews were to be conducted. An interview protocol for the TMT executives was prepared based on all elements of the business model framework discussed in Table 12, such as the value proposition, customer segments, channels, customer relationship, key activities, key resources and key partners, cost structure and revenue streams. Additionally, the author asked questions around perceived challenges to business value with cloud computing. In order to verify data and analysis of the data after the interviews, all were recorded via audio and video, with each interviewee’s consent, and were subsequently transcribed, proof-read and annotated by the researcher. The documentation of the findings were continuously presented and discussed with the company executives, academics and practitioners.
Complementary articles and files relating to the cloud computing technologies and their use were also collected. These information included a comprehensive review of digital library in terms of peer review articles, white papers and industry/market analysis and trends from major consultant firms.
Business Model Generation (Osterwalder et al., 2005).
The Osterwalder et al., (2005) business model framework was used as a strategy to assess value creation with cloud computing adoption. The results are summarized in Table 12, classified as per the pillars of the framework, and discussed in more detail below.
Table 12: ALESTRA’s Business Model on Cloud Computing
8.
Key PartnersBuilding win-win partner relationships with IBM, SAP, CISCO, EMC, Universities. Sourcing for expertise and flexibility while reducing costs and capital.
Strengthen coordination capabilities to secure social and relational value
7.
Key Activities Organizational Readiness, Technology Innovation, and Environment Awareness Best practices to secure pragmatic value Governance and compliance, solution design, marketing one-to-one, commercial, service, business model innovation2.
Value Proposition: Solutions of end-to-end services that include SaaS, PaaS, and IaaS. The solution is open to private clouds, community clouds, public clouds, and hybrid clouds. Five characteristics: on-demand self-service, broad network access, resource pooling, rapid elasticity, and measured service.4.
Customer Relationships Personalized customer service, brand, customer service rating, SLA1.
Customer Segment Broad range of SMEs customers in service and manufacturing business, financial, education, health, legal and public sector6.
Key ResourcesTalent with technical and empowerment capabilities, infrastructure on demand, innovative, scalable and flexible solutions: cloud computing, financial structure, collaboration platform for innovation
3.
Channels Account executives, customer referrals and web marketing9.
Cost StructureInfrastructure, talent and commercial and administrative affaires
5.
Revenue StreamsMonthly billing base on demand of service, platform and infrastructure to secure value creation
Value Proposition
The analysis revealed that service providers create value for their customers in different ways. Value propositions include the provision of transparent and auditable systems that facilitate better communication and enable companies to save money, time and improve their business processes. For example, managers at ALESTRA described how their value proposition was quite unique from other competitors in that they provide end-to-end services from initial audits that assess customer “viability for the cloud”, as well as the actual migration to the cloud, disaster recovery plans and professional consultancy services. They further elaborated that their cloud computing services enable companies to reduce IT costs, while increasing security, efficiency and scalability. The CEO pointed out that its system gives clients a standardized way of managing their quality systems.
The CEO further elaborated “because we can standardize the implementation, this allows us to spend less time on repeating work that we would have done in the past with other clients, and gives us more time to actually concentrate on core values, and implementing the processes in a lean way, so that we are just not going in and documenting a process. We are actually going in and looking at a process from a value proposition and actually coming out with improvements on that process” The CFO also explained that the move away from the capital expenditure (CAPEX) intensive model to the operating expenditure (OPEX) one has resulted in lower infrastructural costs for clients. Customers pay ALESTRA for the capacity they need, when they need it, instead of acquiring a fixed capacity based on the traditional model. The VP of Marketing and Commercial Services further elaborated, “Now when moving to a cloud infrastructure we have this sort of elastic resourcing in which we can provide services ad hoc on the scale that we need for that particular time. Also cloud computing is beneficial in that customers don’t have to invest as much money up front.”
Customer Segment
Target customers for cloud computing include both public and private sectors. For example, ALESTRA has built up clients in sectors ranging from healthcare, education and banking to manufacturing, retail, services and transportation in Mexico. Channels
Distribution channels include account executives, customer referrals and web marketing. Nonetheless, VP of Marketing and Commercial Services was enthusiastic when commenting that once signing up with new companies, ALESTRA gets further exposure to a lot of potential new customers. He pointed out that in order to sustain competitive advantage, it is critical to to keep marketing the brand based on branding the customer experience.
Customer Relationships
In terms of the relationship with customers, ALESTRA believes to follow a service centric approach in the way the company engages and work with customers.
According to the COO, security and privacy are two aspects that customers worry about, with the public sector, there is a concern to cloud computing. For the VP of Marketing and Commercial Services, there is a generational bias, for digital natives SMEs is easier to adopt than for digital exiles SMEs, and when traditionally the idea is to have a computer site, with servers, and the virtual network is being seen as a lack of control. For the younger generations the possibility to have data centers scattered and decentralized globally, particularly when disaster recovery and business continuity is an issue. Key Resources
Regarding ALESTRA’s key resources, the Human Resources VP identified the people, their skills, talent, leadership and experience within the market and customers. For him the company has people with the right mix of skills: technical, commercial and service orientation. Another main asset mentioned was the business and IT knowledge combination.
For the Marketing and Commercial Services VP, the brand recognition and reputation with clients were considered core competencies. For the COO, the company capabilities in terms of standardized processes receiving recognized certifications and awards were also a key resource.
Key Activities
For the COO the key activities are the integration of ALESTRA’s value chain from: I+D, marketing, commercial, customer service, strategic networking, compliance, business process management, change management, business innovation, planning, and governance to execute the plans and getting the expected results, including identifying the process owners, the sponsors, the customers (internal and external), and including roles, responsibilities, deadlines and deliverables.
Key Partners
For ALESTRA’s CEO, the key value is the network of strategic alliances with partner organizations to build the capabilities and to deliver the value narrative to the customer. Elaborating more on this issue, the CEO explained that in order to attend the market needs, ALESTRA built up a massive network of vendors and suppliers. The COO mentioned key partners: EMC, CISCO, SAP, IBM, EGADE. With the universities the company collaborates in strategic research, like cloud computing; also collaborate in academic forums, conferences lectures, and articles around cloud computing; also in opening an space for internships and field projects. Similarly, the Marketing and Commercial VP believed that the external and internal networking that occurred as a result of cloud offerings was very beneficial, and he considered that there is now more collaboration going on between public sector agencies.
Cost Structure
Regarding cost structure, the Human Resources VP explained that the most significant cost to the company was human resources – employees who operate and manage the cloud offering. According to the CFO an important investment is being channel to build a flexible and scalable infrastructure (plug and play) and to cover the company administrative affairs. Revenue Streams
The revenue model of ALESTRA consists of a pay-per use model either monthly or yearly. For example, the infrastructure service puts clients in control of flexible computing environments that are hosted in a secure ALESTRA’s Network datacenter and provided on a monthly billing basis on demand, pay-as-you-use.
Conclusions
Based on the quantitative results, the research built a model that explains how technology innovation, organizational readiness and environment affect the cloud computing adoption level for SMEs, proving a more efficient and effective way to leverage from technology, globalization, standardization and modularity, based on demand.
The research model explains also how the cloud adoption level influences the value creation for SMEs in economic, pragmatic and social terms to secure a sustainable business model.
Based on the qualitative results, and in support of research from Iyer and Henderson (2012) and Leimester et al. (2010), the case study found that to form partner networks to be of utmost importance for value creation, to collaborate with customers, universities, research institutes and partner organizations. The network provided for ALESTRA a means for utilizing business intelligence and analytical applications to look for better ways to understand customer expectations.
This case study has responded to the need to expand our understanding of the business model aspects of the cloud computing phenomenon, the adoption level and business value creation for SMEs. Moreover, employing the perspective of both service provider and customers proved highly effective, as existing studies tend to focus on adopter companies. Overall, the findings suggest that ALESTRA needs to give more thought to how best they can employ cloud-enabled business models that promote more differentiation in terms of their offering and enable competitive advantage in the long term. The case also examined how ALESTRA created value by developing new capabilities and competencies that enable them to create and sustain competitive advantages with cloud offerings over time.
Finally, conducting research with ALESTRA showed the importance to leveraged networks of complementors around cloud that may help SME companies (new to the cloud landscape) to find new ways in which value can be realized from ecosystem participation.
References
Armbrust, M., Fox, A., Griffith, R., Joseph, A.D., Katz, R., Konwinski, A., Lee, G., Patterson, D., Rabkin, A., Stoica, I. and Zaharia, M. (2010). A view of cloud computing, Communications of the ACM, Vol. 53, pp. 50-58.
Chesbrough, H. and Rosenbloom, R.S. (2002). The role of the business model in capturing value from innovation: evidence from Xerox corporation’s technology spin-off companies, Industrial and Corporate Change, Vol. 11 (3), pp.529-555. Chesbrough, H. (2004). Managing open innovation, Research and Technology Management, 47(1), pp. 23-26.
Corrales, M. (2013). From Knowledge Management to Absorptive Capacity: ECITON Case on Business Model Innovation. BALAS Annual Conference: Free Markets and Social Inclusion Towards a Common Goal, Lima, Peru.
Hair, J.F., Anderson, R.E., Tatham, R.L. and Black, W.C. (1998). Multivariate Data Analysis, Prentice-Hall, Upper Saddle River, NJ.
Iyer, B. and Henderson, J.C. (2010). Preparing for the Future: Understanding the Seven Capabilities of Cloud Computing. MIS Quarterly Executive, Vol. 9(2).
Iyer, B. and Henderson, J.C. (2012). Business Value from Clouds: Learning from Users, MIS Quarterly Executive, Vol. 11(1).
Keen, P.G.W. and Williams, R. 2012. Making Innovation part of Everyday Business Life. EGADE Business Press.
Lazonick, W. (1993). Learning and the Dynamics of International Competitive Advantage. Learning and Technological Change, Thomson R. (Eds), St. Martin’s Press, New York, pp. 172-197.
Leimester S, Riedl, K., Krcmar, H. 2010. The Business Perspectives of Cloud Computing: Actors, Roles and Value Networks”, Proceedings of 18th European Conference on Information Systems (ECIS).
Mell, P. and Grance, T. (2009). The NIST Definition of Cloud Computing, National Institute of Standards and Technology. Morris, M., Schindehutte, M. and Allen, J. (2005). The entrepreneur’s business model: toward a unified perspective,
Journal of Business Research, Vol. 58(6), pp. 726-735.
Nelson, M.J. and Shaw, M.L. (2003). The Adoption and Diffusion of Interorganizational Systems Standards and Process Innovation. Proceedings of MIS Quarterly Special Issue Workshop on : Standard Making: A Critical Research Frontier for Information Systems, Seattle, December, pp. 12-14.
Oliveira, T. and Martins, M.F. (2010). Understanding e-business adoption across industries in European countries, Industrial Management and Data Systems, Vol. 110, pp. 1337-1354.
Oppenheim, A. (1992). Questionnaire Design, Interviewing and Attitude Measurement, Continuum, New York.
Osterwalder, A., Pigneur, Y. and Tucci, C.L. (2005). Clarifying Business Models: Origins, Present and Future of the Concept, Communications of AIS, Vol. 15, pp. 751-775.
Pan, M.J. and Jang, W.Y. (2008). Determinants of the adoption of enterprise resource planning within the technology-organization-environment framework: Taiwan’s communications industry, Journal of Computer Information Systems, Vol. 48, pp. 94-102.
Porter, M.E. (1985). Competitive Advantage. The Free Press, New York.
Prahalad, C. and Ramaswamy, V. (2002). The Co-Creation Connection, Strategy and Business, Vol. 27, pp. 1-12. Rogers, E.M. (1983). Diffusion of Innovation, The Free Press, New York, NY.
Teece, D.J., Pisano, D. & Shuen, A. (1997). Dynamic capabilities and strategic management, Strategic Management Journa, Vol. (18), pp. 509-533.
Tornatzky, L. and Fleischer, M.(1990). The process of technology innovation, Lexington, MA, Lexington Books.
Wang, Y.M., Wang, Y.S. and Yang, Y.F. (2010). Understanding the determinants of RFID adoption in the manufacturing industry, Technological Forecasting and Social Change, Vol. 77, pp. 803-815.
West, J. (2007). Value Capture and Value Networks in Open Source Vendor Strategies”, in Proceedings of the 40th Annual Hawaii International Conference on System Sciences (HICSS 07), Hawaii, pp. 176-186.