R E S E A R C H
Open Access
Feature-based multiple models improve
classification of mutation-induced stability changes
Lukas Folkman
1,2*, Bela Stantic
1, Abdul Sattar
1,2From
SNP-SIG 2013: Identification and annotation of genetic variants in the context of structure, function,
and disease
Berlin, Germany. 19 July 2013
Abstract
Background:Reliable prediction of stability changes in protein variants is an important aspect of computational protein design. A number of machine learning methods that allow a classification of stability changes knowing only the sequence of the protein emerged. However, their performance on amino acid substitutions of previously unseen non-homologous proteins is rather limited. Moreover, the performance varies for different types of mutations based on the secondary structure or accessible surface area of the mutation site.
Results:We proposedfeature-based multiple modelswith each model designed for a specific type of mutations. The new method is composed of five models trained for mutations in exposed, buried, helical, sheet, and coil residues. The classification of a mutation as stabilising or destabilising is made as a consensus of two models, one selected based on the predicted accessible surface area and the other based on the predicted secondary structure of the mutation site. We refer to our new method asEvolutionary, Amino acid, and Structural Encodings with Multiple Models(EASE-MM). Cross-validation results show that EASE-MM provides a notable improvement to our previous work reaching a Matthews correlation coefficient of 0.44. EASE-MM was able to correctly classify 73% and 75% of stabilising and destabilising protein variants, respectively. Using an independent test set of 238 mutations, we confirmed our results in a comparison with related work.
Conclusions:EASE-MM not only outperformed other related methods but achieved more balanced results for different types of mutations based on the accessible surface area, secondary structure, or magnitude of stability changes. This can be attributed to using multiple models with the most relevant features selected for the given type of mutations. Therefore, our results support the presumption that different interactions govern stability changes in the exposed and buried residues or in residues with a different secondary structure.
Background
A non-synonymous single nucleotide polymorphism (SNP) in a coding region of DNA results in a single amino acid polymorphism (a mutation) in a protein sequence. The ability to predict how such an amino acid substitution affects the stability of a protein is an impor-tant aspect of computational protein design. Moreover, it has been shown that disease-associated protein variants are often characterised by mutation-induced stability
changes [1]. Therefore, an improved prediction of stabi-lity changes may help us deepen our understanding of the relationship between protein mutations and inherited diseases.
With the immense amounts of data about protein var-iants coming from the genome sequencing projects, com-putational methods, being fast and inexpensive, became convenient tools to study stability changes. These compu-tational approaches can be categorised asenergy-based andtraining-basedmethods. Whileenergy-basedmethods use physical, statistical, or empirical energy functions to estimate the stability change from the protein’s three-dimensional structure [2-9],training-basedmethods are * Correspondence: [email protected]
1
Institute for Integrated and Intelligent Systems, Griffith University, Brisbane, Australia
Full list of author information is available at the end of the article
© 2014 Folkman et al.; licensee BioMed Central Ltd. This is an Open Access article distributed under the terms of the Creative Commons Attribution License (http://creativecommons.org/licenses/by/2.0), which permits unrestricted use, distribution, and reproduction in any medium, provided the original work is properly cited. The Creative Commons Public Domain Dedication waiver (http://creativecommons.org/publicdomain/zero/1.0/) applies to the data made available in this article, unless otherwise stated.
trained on the experimental data from the ProTherm data-base [10] employing machine learning algorithms [11-26]. Interestingly, a number of the training-based methods allow for a prediction knowing only the sequence of a pro-tein [17-26]. Since there is a large gap between the num-ber of known protein sequences and experimentally determined three-dimensional structures, we devote our interest to thesesequence-basedmethods in this work.
While a number of the sequence-based methods were able to report a high prediction accuracy, the results from an assessment study showed that the performance of three evaluated methods was much lower on an independent test set [27]. There, only the mutations from new additions to the ProTherm database were used for testing. This find-ing correlates with the results reported in our recent work [26]. We found that the prediction performance of three methods in our comparison was relatively low when evalu-ated solely on mutations in proteins with low sequence similarity to the training set. To improve prediction per-formance on non-homologous proteins, we proposed a method based on evolutionary and structural encodings with amino acid parameters. While the new method was able to outperform related work, the analysis revealed that the performance for exposed residues was considerably lower than for buried ones. Similarly, mutations in coil residues appeared to be more difficult to predict than the ones ina-helices andb-sheets.
In this work, we followed the observation that prediction performance differs among various types of mutations based on the accessible surface area or secondary struc-ture. By employing feature selection, we built specialised feature-based multiple models, each dedicated to a specific type of mutations. Our results show that this methodology improves two-class prediction of stability changes. Moreover, a consensus approach combining two methods with multiple models (one based on the accessible surface area and the other on the secondary structure) yielded further improvements. Analysis of our results revealed that the new method delivers more balanced predictions than our previous work for mutations in residues with a different secondary structure and solvent accessibility as well as for different magnitudes of stability changes. Finally, our new method achieved a favourable perfor-mance in a comparison with related work using an inde-pendent test set of 238 mutations. We refer to the new method as Evolutionary, Amino acid, and Structural Encodings with Multiple Models(EASE-MM).
Methods
Feature-based multiple models
We built and compared four different machine learning methods for the two-class (stabilising and destabilising) prediction of stability changes. The first one (referred to as EASE-AA2) was an extension of our previous work
(EASE-AA:Evolutionary And Structural Encodings with Amino Acid parameters[26]). EASE-AA2employed a sin-gle support vector machine (SVM) model with predictive features selected using a greedy feature selection algo-rithm. We used a range of features describing evolutionary conservation, amino acid parameters, and structural prop-erties. Next, we developed two methods, each composed of several SVM models. The motivation here was to make each model specialised for different types of mutations. The first method (EASE-ASA) was composed of two models based on different accessible surface area (ASA) categories (exposed and buried). The second method (EASE-SS) was composed of three models based on differ-ent secondary structure (SS) types (a-helix,b-sheet, and coil). Finally, we built a consensus method combining the predicted probabilities of the two methods with multiple models. We refer to the consensus method as EASE-MM.
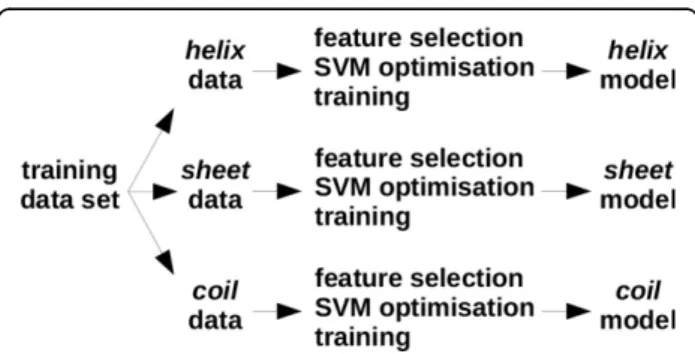
Figure 1 illustrates the design of EASE-SS, however, the same applies to EASE-ASA. First, we partitioned the train-ing data accordtrain-ing to the secondary structure (accessible surface area) of the mutation site. Second, we used feature selection to select a relevant combination of features for the given data partition. Next, the SVM parameters were optimised and the model was trained for classification of stability changes. Since we aimed to design strictly sequence-basedmethods, the secondary structure and two categories of accessible surface area were predicted with SPINE-X [28] and ACCpro [29], respectively. A solvent accessibility threshold of 25% was used for classifying resi-dues as exposed or buried. This threshold resulted in a well-balanced partitions of 785 exposed and 891 buried mutations. Further discussion on the solvent accessibility thresholds can be found in the next section (Results and discussion).
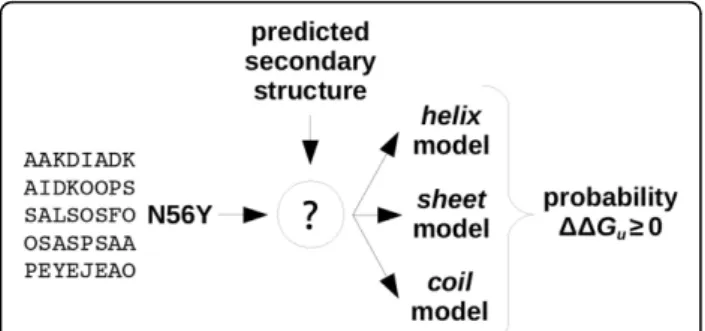
Figure 2 illustrates how a prediction is performed using EASE-SS (the same applies to EASE-ASA). Given the
Figure 1Design of feature-based multiple models. The design of EASE-SS is shown, however, the same applies to EASE-ASA. First, the data was divided according to the predicted secondary structure (accessible surface area). Then, relevant predictive features were selected using a greedy feature selection algorithm. SVM parameters were optimised using a grid search. Finally, the predictive models were trained.
inputs (protein sequence and amino acid substitution), the secondary structure (accessible surface area) is pre-dicted first. Then, the relevant model is selected. That is, if the mutation is in a helical (exposed) residue, only the helix(exposed) model is used. The output is a predicted probability of the mutation to be stabilising. Finally, for the case of the consensus method (not shown in the figure), prediction probabilityP is the average of the probabilities predicted with EASE-ASA and EASE-SS:
PEASE−M M= 12(PEASE−ASA+PEASE−SS) (1) Predictive features
For machine learning classification of stability changes, each mutation needs to be encoded with a number of predictive features. We considered a range of features describing the evolutionary conservation, amino acids parameters, and structural properties.
Evolutionary features
We used two evolutionary features: SIFT score (also employed in our previous work [25,26]) and thedifference of mutation and conservation likelihood(ΔM). SIFT [30] predicts whether a mutation affects the function of a pro-tein. It is calculated from a scaled probability matrix of possible amino acid substitutions generated from a multi-ple sequence alignment of related sequences. SIFT scores range from 0 to 1 where scores below 0.05 are predicted as deleterious mutations. We ran SIFT using the Swiss-Prot and TrEMBL databases with sequences more than 90% identical to the query removed.
FeatureΔMexpresses the difference of likelihoods of the introduced and deleted amino acids to appear in the align-ment of homologous sequences of the target protein. To calculate this feature, three iterations of PSI-BLAST [31] in default configuration were used to search the NCBI non-redundant database. Then, the likelihood scores were extracted from the last position specific scoring matrix
(PSSM). The scores were divided by 10 for normalisation so that most values fell within the range of−1 and 1. Amino acid parameters
A variety of different amino acid parameters were intro-duced for the prediction of stability changes [12,14,16, 20,23]. In our previous work [26], we adopted seven repre-sentative parameters includinghydrophobicity, volume, polarisability, isoelectric point, helix tendency, sheet ten-dency, and asteric parameter(graph shape index). These parameters were first introduced in [32] and later applied to prediction of secondary structure [28]. In this work, we included another 4 parameters:flexibility[33], compressibil-ity, bulkiness, andequilibrium constant with reference to the ionisation property of COOH group[34]. We included these parameters because they were found as one of the best determinants to stability changes in the study of 48 physi-cal-chemical, energetic, and conformational amino acid properties [12,14]. We normalised all 11 parameters to fall within the range of−0.9 and 0.9. The normalised values of the 11 parameters are available in Additional file 1.
We encoded each of the amino acid parameters as two distinct predictive features. The first one was equal to the difference between the amino acid parameters for the introduced and deleted amino acids (denoted asΔ). The other predictive feature described the mutation site envir-onment as the mean, minimum, and maximum of the parameter values for a window of six neighbouring resi-dues. We considered neighbourhood windows of up to a length of 18 and found that six neighbours performed optimally.
Structural features
Since structural information is not available in the case of sequence-based prediction of stability changes, we employedpredictedstructural features. We used the mul-tistep neural network method SPINE-X [28] for the pre-diction ofsecondary structure probabilities. Also, the real value of therelative accessible surface areaof each muta-tion site was predicted with SPINE-X. For the predicmuta-tion of thedisorder probability, we used the neural network method SPINE-D [35]. These three predicted structural features were also used in our previous work [25,26]. Feature selection
We considered a range of predictive features and applied feature selection to design specialised models for 1) exposed and buried residues (EASE-ASA), and 2) helical, sheet, and coil residues (EASE-SS). Also, the single-model method (EASE-AA2) was designed employing the same feature selection procedure. We usedsequential forward floating selection(SFFS) [36] which is a variation of a com-monly adoptedsequential forward selection(SFS) [37]. SFS works by iteratively adding the best-performing feature to a set of featuresS. Initially,Sis empty. Every iteration, the best-performing featurefis selected as the one for which
Figure 2Classification with feature-based multiple models. The prediction process is shown for EASE-SS, however, the same applies to EASE-ASA. First, the secondary structure (accessible surface area) is predicted. Next, the relevant model is selected and used for prediction. That is, if the mutation is in a helical (exposed) residue, only the helix (exposed) model is used.
S∪{f} achieves the highest prediction performance. The SFFS algorithm starts with SFS but at the end of every iteration, features are iteratively removed if this can further improve prediction performance. Thus, the number of fea-tures in Sis not monotonously increasing because the search is‘floating’up and down. We ran SFFS until 10 fea-tures were added toSand stored all visited combinations of features. Finally, we selected the ultimately best-per-forming of the visited combinations. As a measure of pre-diction performance, the area under the receiver operating characteristic curve (commonly denoted as AUC) was used.
To verify the significance of the features selected with SFFS, we performed feature selection also with the stability selectionalgorithm [38]. In stability selection, the data sample of sizenis randomly sub-sampled to sizen/2. Then, an‘inner’feature selection algorithm is applied. The whole procedure is repeatedk-times, each time with a dif-ferent data sample. Features which are repeatedly selected contribute towards the final set of predictive features. We used SFS as the‘inner’algorithm and setk= 100.
Support vector machines
Support vector machines (SVM) [39] are machine learn-ing algorithms which can approximate non-linear func-tions by mapping the inputs to a high-dimensional feature space using a kernel function and then, solving a linear problem by finding a maximum margin separating hyperplane. We used the radial basis kernel function and implemented our method with the LIBSVM library [40].
To optimise the SVM performance, the regularisation parameterCand the radial basis kernel width parameter gneed to be set. If the number of positive and negative examples in the data set is unbalanced, SVM can be further optimised by setting the weight (w) of the penalty for a training error on positive examples. We optimised these SVM parameters by running agrid searchusing 10-fold cross-validation. In the grid search, we consid-ered all possible combinations ofC∈{2−5, 2−3, . . . , 27}, g∈{2−7, 2−5, . . . , 21}, andw∈{1, 1.5, 2, 2.5, 3}.
Data sets
We compiled a data set of free energy stability changes from the ProTherm database [10] (February 2013). There, a stability change is defined as the difference in the unfold-ing free energy:ΔΔGu[kcal mol−1] =ΔGu(mutant)−ΔGu (wild-type). Hence, we designated the positive and negative examples of the classification problem as the stabilising (ΔΔGu≥ 0) and destabilising (ΔΔGu< 0) mutations, respectively.
We extracted 3,329 mutations with listed stability changes and cross-checked all the sources where the mea-surements came from. We found that incorrect values (mostly the sign ofΔΔGu) had been entered from at least
18 sources. We corrected stability changes for all relevant (>230) mutations in the extracted data set. Next, we removed all duplicate entries of the same amino acid sub-stitutions (different concentrations of chemicals, stability changes of the protein intermediate state, etc.). If several measurements of the same mutation under the same experimental conditions were present, we averaged the stability changes and kept only a single entry. If several measurements of the same mutation under different experimental conditions were present, we kept only the measurement closest to the physiological pH 7.
Finally, we identified 74 clusters of proteins with more than 25% sequence similarity using BLASTCLUST [41]. If there were several measurements of the same amino acid substitution within a single cluster, we kept only the measurement closest to the physiological pH 7. This pro-cess yielded a non-redundant data set containing 1,914 mutations of 95 different proteins grouped into 74 non-homologous clusters.
To perform an independent comparison with related work, we separated all proteins with less than 25% sequence similarity to the data set used for the training of I-Mutant2.0 [17]. This procedure yielded 25 proteins with 238 mutations which we kept as an independent test set (S238). The remaining data of 1,676 mutations in 70 dif-ferent proteins (S1676) were used for the development of our methods. Both S238 and S1676 data sets are available in Additional file 2.
Evaluation
We usedunseen-protein10-fold cross-validation on the S1676 data set to design our methods, select relevant fea-tures, and perform a comparison with our previous work (EASE-AA) [26]. In theunseen-proteincross-validation, we ensured that all mutations of any cluster of homolo-gous proteins were contained within a single fold. Also, we kept the ratio of stabilising and destabilising examples reasonably similar among the folds. We repeated our experiments 100 times (each time with randomly gener-ated folds) and averaged the results.
The unseen-proteincross-validation was previously used for the evaluation of a method for the prediction of deleterious mutations [42]. A similar procedure, unseen-residuecross-validation, was used for the evaluation of a three-statestability changes prediction method [21]. In our recent work [26], we compared bothunseen-residue andunseen-proteincross-validation with the commonly-used random cross-validation. There, we concluded that theunseen-protein cross-validation provides the most robust estimate of the prediction performance. This is because predictive features cannot be selected as‘proxies’ to specific residues or proteins.
For an independent comparison with related work, we used the S238 data set. This data was notused for the
SVM parameters optimisation nor feature selection. Importantly, the sequence similarity between S1676 and S238 was less than 25%. To achieve a fair comparison with related work, we optimised prediction thresholds of all compared methods to yield a maximum Matthews correlation coefficient (MCC). MCC is a measure of pre-diction performance that provides more relevant infor-mation than classification accuracy (Q2) in cases when the data set is severely biased towards one class of examples. Since destabilising mutations prevail in the available experimental data, 72% and 81% of mutations were destabilising in the S1676 and S238 data sets, respectively.
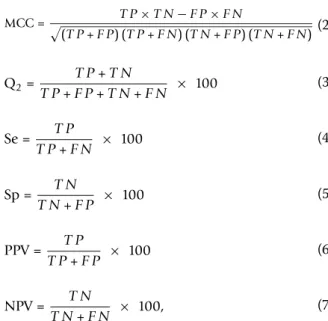
Regarding evaluation measures, we assessed the overall prediction performance in terms of the receiver operat-ing characteristic (ROC) curves and the area under the ROC curve (AUC). A ROC curve plots the true positive rate (sensitivity) as a function of the false positive rate (100% −specificity) at different prediction thresholds. Furthermore, we calculated Matthews correlation coeffi-cient (MCC), classification accuracy (Q2), sensitivity (Se), specificity (Sp), positive predictive value (PPV), and negative predictive value (NPV):
MCC = T P×T N−F P×F N (T P+F P) (T P+F N) (T N+F P) (T N+F N) (2) Q2= T P+T N T P+F P+T N+F N × 100 (3) Se = T P T P+F N × 100 (4) Sp = T N T N+F P × 100 (5) PPV = T P T P+F P × 100 (6) NPV = T N T N+F N × 100, (7)
whereTP, TN, FP, and FNrefer to the number of true positives, true negatives, false positives, and false nega-tives, respectively.
Results and discussion
Our main interest was to asses whether a method with feature-based multiple modelscan improve prediction per-formance compared to methods employing only a single model. To explore different ideas, we designed two meth-ods with multiple models: EASE-ASA (composed of two models for exposed and buried residues) and EASE-SS (composed of three models for helical, sheet, and coil
residues). We also built a consensus method (EASE-MM) of the former two. The most relevant features for each model were chosen using sequential forward floating selection (SFFS). We compared the 10-fold cross-valida-tion performance (data set S1676) of the three methods with multiple models and two single-model methods (EASE-AA and EASE-AA2). While EASE-AA is our pre-vious work [26], EASE-AA2was designed using the same feature selection procedure as the methods with multiple models. Next, we analysed the significance of the selected features and investigated performance of our methods for different types of mutations. Finally, we performed a com-parison with related work on an independent test set of 238 mutations.
Cross-validation performance
We performed 100 replications of 10-fold cross-valida-tion on the S1676 data set. Table 1 summarises the aver-aged results. Our previous work, EASE-AA, yielded the lowest prediction performance with a Matthews correla-tion coefficient (MCC) of 0.35. EASE-AA2achieved only a marginal absolute improvement of 0.03 in MCC reach-ing a value of 0.38. We observed more notable improve-ments for the methods employing multiple models. EASE-ASA and EASE-SS reached MCC values of 0.40 and 0.42, respectively. These results constitute respective relative improvements of 14% and 20% (absolute improvements of 0.05 and 0.07) compared to our previous work (EASE-AA). The consensus method com-bining the predicted probabilities of ASA and EASE-SS yielded further improvements. EASE-MM achieved an MCC of 0.44 which represents a relative improvement of 26% (an absolute improvement of 0.09) compared to EASE-AA. Compared to EASE-AA2, the relative (absolute) improvement was 16% (0.06). While EASE-MM did not improve on EASE-AA2’s specificity (the accuracy on nega-tive examples), neganega-tive predicnega-tive value was improved. This means that EASE-MM did not‘over-predict’ destabi-lising mutations as much as EASE-AA2.
The receiver operating characteristic (ROC) curves in Figure 3 compare the true positive rate of the five meth-ods as a function of the false positive rate at different
Table 1 Cross-validation performance (data set S1676) of our previous work, the single-model method, and the three methods with multiple models.
Method AUC MCC Q2 Se Sp PPV NPV EASE-AA 0.76 0.35 67.11 74.93 64.22 43.68 87.37 EASE-AA2 0.77 0.38 72.67 65.54 75.31 49.58 85.51 EASE-ASA 0.80 0.40 72.62 71.07 73.19 49.55 87.23 EASE-SS 0.80 0.42 73.57 72.13 74.11 50.79 87.77 EASE-MM 0.82 0.44 74.71 73.14 75.28 52.30 88.33
prediction thresholds. The figure demonstrates the ben-efit in terms of the number of correctly predicted posi-tive examples upon employing the methods with multiple models. EASE-ASA, EASE-SS, and EASE-MM achieved the area under the ROC curve (AUC) of 0.80, 0.80, and 0.82, while EASE-AA and EASE-AA2 yielded an AUC of 0.76 and 0.77, respectively. This represents a relative improvement of 6% (an absolute improvement of 0.05) for EASE-MM compared to EASE-AA2.
We estimated the statistical significance of the improvements yielded by the methods with multiple models over the 100 replications of cross-validation using a studentt-test. The null hypothesis stated that there was no statistical difference in the MCC (AUC) for EASE-MM (EASE-ASA, EASE-SS) compared to EASE-AA2 (EASE-AA). The p-values associated with this null hypothesis were all less than 0.0001. Also, EASE-MM’s improvements compared to EASE-ASA (EASE-SS) were statistically significant (p-values< 0.0001).
Significance of the selected predictive features
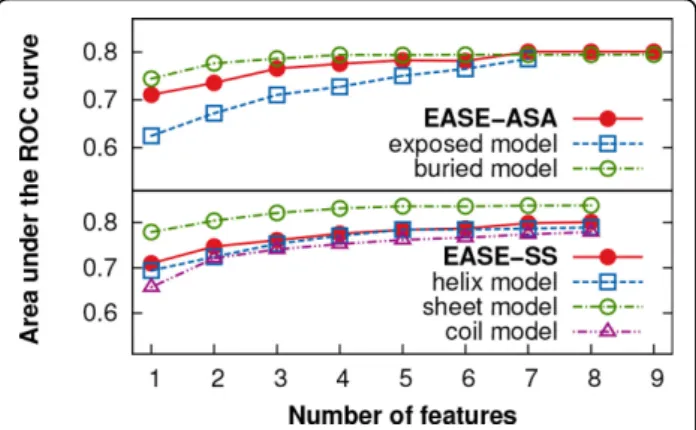
We used the sequential forward floating selection (SFFS) to automatically select the combinations of the most rele-vant predictive features. While seven and nine features were selected for the exposed and buried models of EASE-ASA, respectively, each model of EASE-SS (helix, sheet, andcoil) was composed of eight features. Figure 4 shows the area under the ROC curve (AUC) as a function of the number features selected with the SFFS algorithm. This figure illustrates the motivation for our work well. While at the early stages of feature selection, there is a notable gap between the prediction performance for mutations in the exposed and buried residues, as feature selection progresses, the performance becomes balanced
for both categories. A similar trend, however not as pro-nounced, can be seen for the case of EASE-SS. Additional file 3 lists the final combinations of features implemented in EASE-ASA, EASE-SS, and EASE-AA2.
We analysed which features were most often selected across the five different models of ASA and EASE-SS. SFFS selected feature SIFTscorefor each of the five models. FeatureΔhydrophobicitywas selected in all but thesheetmodel. The third most often occurring feature was therelative accessible surface area. It is of interest to inspect which features were the most specific for each of the models. For instance, amino acid attributesΔhelix tendencyandΔsheet tendencywere chosen for thehelix andsheetmodels, respectively. These features are indeed relevant specifically to the two models because they express the change in the preference of the given second-ary structure type. FeatureΔvolumewas selected for both helixandsheetbut not for thecoilmodel. We conjecture that an increase in the side-chain volume may induce strain in the backbone of the protein in regions with a well-defined secondary structure but can be better toler-ated in a coil region. Regarding the two models of EASE-ASA, featuresΔisoelectric pointandΔpolarisabilitywere selected for theburiedbut not for theexposedmodel.
While SFFS was effective in finding the most relevant combination of predictive features, it does not provide a ranking of the individual features. This is because, as the feature selection progresses, even a significant feature can be removed if it does not perform well in combina-tion with the others. We employed stability seleccombina-tion to analyse the significance of individual features. We imple-mented stability selection as 100 replications of the basic sequential forward selection (SFS) each time executed on a randomly sub-sampled S1676 data set (data was not partitioned for different types of mutations in this
Figure 3ROC curves performance of the three methods with multiple models, the single-model method, and our previous work. The true positive rate is shown as a function of the false positive rate at different prediction thresholds. These are cross-validation results with the S1676 data set. EASE-MM, EASE-SS, EASE-ASA, EASE-AA2, and EASE-AA achieved the area under the ROC
curve (AUC) of 0.82, 0.80, 0.80, 0.77 and 0.76, respectively.
Figure 4Feature selection progress. The area under the ROC curve (AUC) is shown as a function of the number features selected during feature selection. The prediction performance of the different models became more balanced as the feature selection progressed. These are cross-validation results with the S1676 data set.
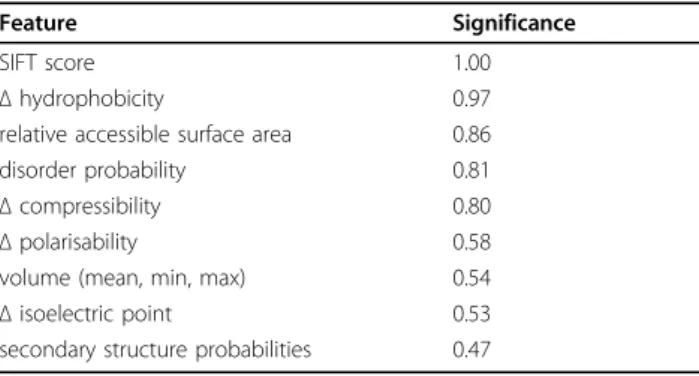
experiment). From the 100 results, we estimated the sig-nificance of each feature as the probability of being selected. Table 2 lists the nine most significant features. Evolutionary feature SIFTscore, amino acid parameterΔ hydrophobicity, and structural propertyrelative accessible surface areaseem to be the most significant. This finding agrees with the most often occurring features across the five models of EASE-ASA and EASE-SS.
Evaluation of different types of mutations
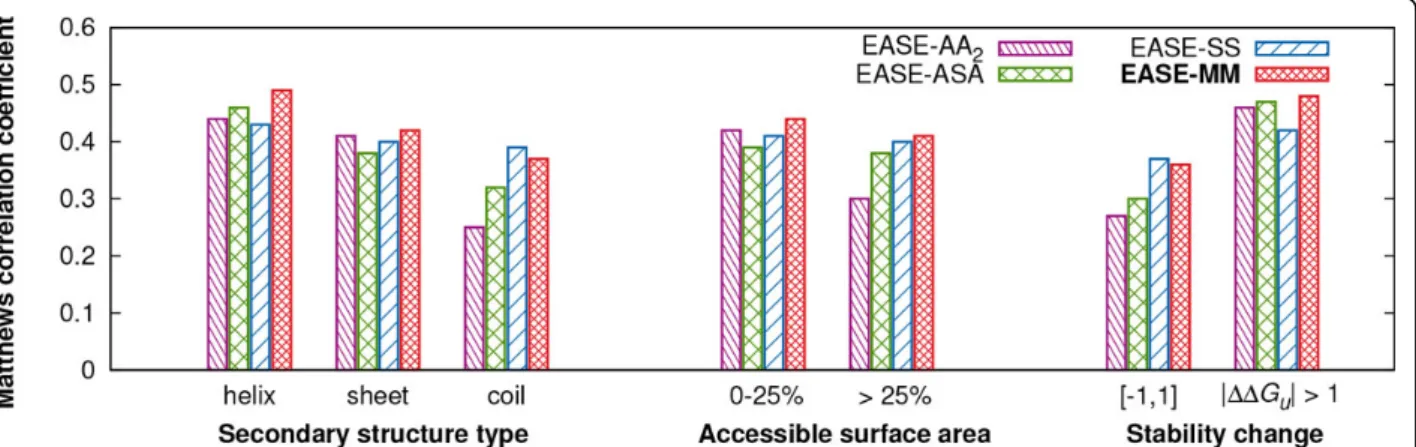
The design of the three methods combining feature-based multiple models was motivated by the observation that the prediction performance of our previous work (EASE-AA) varied considerably for different types of mutations. We found that EASE-ASA (combining two models), EASE-SS (three models), and EASE-MM (consensus of the former two) can predict stability changes more accurately than both single-model methods EASE-AA and EASE-AA2 (Figure 3). Next, we were interested what the improve-ments were for different types of mutations based on the secondary structure and accessible surface area of the mutated residue. Secondary structure and solvent accessi-bility were calculated using DSSP [43] from the experi-mentally determined structures deposited in the Protein Data Bank (PDB) [44]. We also investigated prediction performance for ‘small’(ΔΔGu∈ [−1, 1]) and‘large’ (|ΔΔGu| >1) stability changes.
Figure 5 compares the cross-validation performance (MCC) of AA2, ASA, SS, and EASE-MM for different types of mutations. We analysed the per-formance of the methods with multiple models relative to EASE-AA2because while EASE-AA2encompasses only a single model, it was designed using the same feature selec-tion procedure. Also, EASE-AA2performed marginally bet-ter than EASE-AA.
Regarding the different secondary structure types, EASE-MM achieved an MCC of 0.49, 0.42, and 0.37 for the mutations in helical, sheet, and coil residues, respectively.
The respective relative (absolute) improvements compared to EASE-AA2were 11% (0.05), 2% (0.01), and 48% (0.12). All four methods yielded the lowest performance for the category of coil residues. However, both relative and abso-lute improvements of all three methods with multiple models were the highest in this category. Thus, the meth-ods with multiple models yielded a more balanced perfor-mance for the different secondary structure types than the single-model method. This is most apparent from the performance of EASE-SS which achieved an MCC of 0.43, 0.40, and 0.39 for helical, sheet, and coil residues, respectively.
Next, we analysed our results for two categories of accessible surface area (ASA) based on a threshold of 25%. We found again that EASE-MM not only outperformed EASE-AA2but achieved a more balanced performance yielding an MCC of 0.44 and 0.41 for residues with ASA≤ 25% and>25%, respectively. These results constitute respective relative (absolute) improvements of 5% (0.02) and 37% (0.11) compared to EASE-AA2. The performance of EASE-MM in Figure 5 appears to be well balanced when we analysed only the two categories of ASA employ-ing a threshold of 25% (the same threshold as for the design of the two models of EASE-ASA). Therefore, we were interested whether the performance varied if we con-sidered a greater variety of ASA categories. Figure 6 shows the MCC of the compared methods as a function of four categories of ASA. The figure reveals that the performance of EASE-MM for residues more than 60% exposed to a solvent is on average 63% lower than for the other three categories covering ASA of 0-60%. While the performance of EASE-ASA was also very low in the>60% exposed category (an MCC of 0.05), there was a considerable improvement in the 20-40% category. Thus, it seems that the feature selection for the EASE-ASA’sexposedmodel selected mainly features which are relevant to‘partially exposed’residues. This is likely because residues with ASA >60% contribute only to 7% of the S1676 data set. For the same reason (the lack of experimental data), it would not be possible to design EASE-ASA with three models including a model trained specifically for residues with ASA>60%. An alternative way of improving the consen-sus method (EASE-MM) would be assigning a higher weight to the predicted probability by EASE-SS for muta-tions in residues predicted as>60% exposed to a solvent. EASE-SS yielded an MCC of 0.25 in this ASA category.
Finally, we analysed performance for‘small’(ΔΔGu∈ [−1, 1]) and ‘large’ (|ΔΔGu| > 1) stability changes (Figure 5). For all four methods, the category of‘small’ changes was more difficult to predict. EASE-MM reached an MCC of 0.36 and 0.48 for the ‘small’ and ‘large’ stability changes, respectively. The reason for this unba-lanced performance can be twofold. Firstly, it is naturally harder to differentiate among subtle changes. Secondly, Table 2 The nine most significant features according to
stability selection on the S1676 data set.
Feature Significance
SIFT score 1.00
Δhydrophobicity 0.97
relative accessible surface area 0.86
disorder probability 0.81
Δcompressibility 0.80
Δpolarisability 0.58
volume (mean, min, max) 0.54
Δisoelectric point 0.53
secondary structure probabilities 0.47
Δrefers to the change between the introduced and deleted amino acids; (mean, min, max) was calculated for a window of six neighbouring residues; significance denotes the probability of being selected with stability selection
as suggested elsewhere [21,20], the strict classification of the‘small’stability changes as stabilising or destabilising can be misleading since the experimental data is affected by the error of measurement which can be as large as ±0.48 kcal mol−1[45]. Nevertheless, the relative (as well absolute) improvement of EASE-MM (compared to EASE-AA2) was larger for the‘small’stability changes (33% while it was 4% for the‘large’stability changes).
Overall, EASE-ASA, EASE-SS, and EASE-MM yielded a more balanced performance for all categories of differ-ent types of mutations than the single-model method EASE-AA2. This result supports our hypothesis that building specialised models for different types of muta-tions can yield a more balanced performance. When comparing the performance of the consensus method
(EASE-MM) with EASE-ASA, we found improvements in all seven categories (Figure 5). However, compared to EASE-SS, EASE-MM performed less accurately for mutations in coil residues and for ‘small’ stability changes. This can be attributed to relatively low perfor-mance of EASE-ASA for these two types of mutations. Because the predicted probabilities from EASE-ASA and EASE-SS contribute equally to predictions made by EASE-MM, a low performance of one of the two meth-ods directly influences the consensus. A possible improvement would be to consider the confidence of the predicted secondary structure and use it for weigh-ing the contribution of the probabilities predicted with EASE-SS and EASE-ASA.
Independent test performance
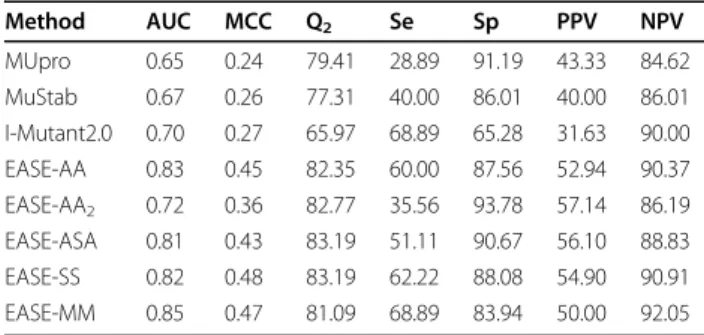
We found that EASE-MM yielded the highest cross-vali-dation prediction performance of the five compared methods (Figure 3). However, it is important to inspect its prediction performance on anindependenttest set to see if the feature selection did not result in features which do not generalise well. Using the S238 data set, we compared the performance of three currently avail-able methods (MUpro [18], MuStab [23], and I-Mutant2.0 [17]), our previous work (EASE-AA [26]), the single-model method (EASE-AA2), and the three meth-ods with multiple models (EASE-ASA, EASE-SS, and EASE-MM). Table 3 summarises the results from the independent comparison. EASE-MM was able to consid-erably outperform the three currently available methods. The absolute increase in the MCC ranged from 0.20 to 0.23. The ROC curves in Figure 7 compare the true positive rate as a function of the false positive rate at different prediction thresholds. The absolute improve-ments in terms of the AUC for EASE-MM compared to MUpro, MuStab, and I-Mutant2.0 were 0.20, 0.18, 0.15,
Figure 5Prediction performance of the single-model method and the three methods with multiple models for different types of mutations. Matthews correlation coefficient (MCC) of EASE-AA2, EASE-ASA, EASE-SS, and EASE-MM is shown as a function of the secondary
structure type of the mutated residue, relative accessible surface area of the mutated residue, and magnitude of the stability change. These are cross-validation results with the S1676 data set.
Figure 6Prediction performance of the single-model method and the three methods with multiple models for different categories of solvent accessibility. Matthews correlation coefficient (MCC) of EASE-AA2, EASE-ASA, EASE-SS, and EASE-MM is
shown as a function of four different categories of mutated residue’s relative accessible surface area. These are cross-validation results with the S1676 data set.
respectively. The performance of the three currently available methods was in agreement with the findings reported in our previous work [26]. There, we described how the evaluation is influenced when different muta-tions of proteins from the training set are used for test-ing. Since sequence similarity of the S238 data set and the data used for developing MUpro, MuStab, and I-Mutant2.0 was less than 25%, the performance of these three methods was rather low.
The three methods with multiple models (EASE-ASA, EASE-SS, EASE-MM) yielded the AUC (MCC) of 0.81 (0.43), 0.82 (0.48), and 0.85 (0.47), respectively (Table 3). All three methods were able to considerably outperform the single-model method EASE-AA2. However, when compared to our previous work (AA), only EASE-MM was able to improve the AUC value (from 0.83 to 0.85). Figure 7 compares EASE-MM and EASE-AA in terms of ROC curves. For the false positive rate of 15-45%, our new method achieved a notable improvement.
This is reflected in a 2% and 4% relative increase in the AUC and MCC, respectively.
We analysed why the improvements to our previous work (EASE-AA) on the S238 test set (Table 3) were not as high as for the cross-validation on the S1676 data set (Table 1). We found that there was a relative decrease of 19% in MCC on residues with accessible surface area (ASA) ≤ 25% for EASE-MM compared to EASE-AA. Coincidently, the accuracy of the predicted accessible surface area with ACCpro (decides which of the two models of EASE-ASA would be used) was 5 percentage points lower for the buried residues [a decrease from 85% (S1676) to 80% (S238)]. We conjecture that this might be one of the contributing factors to the relatively low prediction accuracy of EASE-MM on the residues with ASA≤ 25%. For the residues with ASA> 25%, EASE-MM provided a relative improvement of 50% which is in good agreement with a 46% improvement yielded in cross-validation. However, the abundance of the residues with ASA>25% was considerably lower in S238 (34%) compared to S1676 (48%). Therefore, despite the improvement for the >25% exposed residues, the overall relative increase in EASE-MM’s MCC was only 4% on the S238 data set.
To confirm the significance of the improvements yielded by our new method on the S238 test set, we randomly sub-sampled the data to 119 mutations and classified the stability changes with EASE-MM and EASE-AA. We repli-cated this experiment 100 times. The studentt-test’s null hypothesis stated that there was no statistical difference in the MCC (AUC) between EASE-MM and EASE-AA. The p-values associated with this null hypothesis were less than 0.0001 for both MCC and AUC.
Conclusions
In this work, we followed the observation that the predic-tion performance of our previous work [26] varies for dif-ferent types of mutations based on the accessible surface area and secondary structure. We proposed a sequence-based machine learning method, EASE-MM, which predicts stability changes as a consensus of predicted probabilities of two participating methods, EASE-ASA and EASE-SS. While EASE-ASA combines two models for exposed and buried residues, EASE-SS is composed of three models for mutations ina-helices,b-sheets, and coils. Feature selection and a range of diverse features were used to design each model.
Our cross-validation results show that EASE-MM pro-vides a notable improvement to our previous work reaching a Matthews correlation coefficient of 0.44 (Table 1). EASE-MM was able to correctly classify 73% and 75% of stabilising and destabilising protein variants, respectively, and yielded the area under the ROC curve of 0.82 (Figure 3). Using an independent test set of 238 Table 3 Independent test performance (data set S238)
of three currently available methods, our previous work, the single-model method, and the three methods with multiple models. Method AUC MCC Q2 Se Sp PPV NPV MUpro 0.65 0.24 79.41 28.89 91.19 43.33 84.62 MuStab 0.67 0.26 77.31 40.00 86.01 40.00 86.01 I-Mutant2.0 0.70 0.27 65.97 68.89 65.28 31.63 90.00 EASE-AA 0.83 0.45 82.35 60.00 87.56 52.94 90.37 EASE-AA2 0.72 0.36 82.77 35.56 93.78 57.14 86.19 EASE-ASA 0.81 0.43 83.19 51.11 90.67 56.10 88.83 EASE-SS 0.82 0.48 83.19 62.22 88.08 54.90 90.91 EASE-MM 0.85 0.47 81.09 68.89 83.94 50.00 92.05
EASE-MM is a consensus method of EASE-ASA and EASE-SS
Figure 7ROC curves performance of EASE-MM, our previous work, and three currently available methods. The true positive rate is shown as a function of the false positive rate at different prediction thresholds. These are independent test results with the S238 data set. EASE-MM, EASE-AA, I-Mutant2.0, MuStab, and MUpro achieved the area under the ROC curve (AUC) of 0.85, 0.83, 0.70, 0.67 and 0.65, respectively.
mutations, we confirmed our results in a comparison with related work (Figure 7).
EASE-MM not only outperformed our previous work and other related methods, it achieved a more balanced results for different types of mutations based on the acces-sible surface area, secondary structure, and magnitude of stability changes (Figures 5 and 6). This can be attributed to using multiple models with the most relevant features selected for the given type of mutations. Therefore, our results support the presumption that different interactions govern stability changes in the exposed and buried residues [8] or in residues with a different secondary structure. Similar observations have been made about pathogenic protein variants [46]. Therefore, we aim to extend the con-cept of thefeature-based modelsto prediction of disease-associated mutations [42,47-55] in our future work. Availability of supporting data
The data sets supporting the results of this article are included within the article and its additional files. The source code of our method is available for download from www.ict.griffith.edu.au/bioinf/ease.
Additional material
Additional file 1: Amino acid parameters. The file containing the values of the 11 normalised amino acid parameters is available in a white-space-delimited tabular text format.
Additional file 2: Data sets S1676 and S238. The files containing both the S1676 and S238 data sets are available in a white-space-delimited tabular text format. All files are compressed in a single zip archive.
Additional file 3: Final combinations of predictive features. The list of the final combinations of predictive features implemented in the single model of EASE-AA2, two models of EASE-ASA, and three models of
EASE-SS is available in PDF format.
Competing interests
The authors declare that they have no competing interests.
Authors’contributions
LF designed the study, developed the methods, and conducted the data analysis under the guidance of BS. LF drafted the manuscript. BS and AS contributed to the manuscript preparation.
Acknowledgements
Helpful discussion with Yaoqi Zhou and Yuedong Yang is gratefully acknowledged. NICTA is funded by the Australian Government as represented by the Department of Broadband, Communications and the Digital Economy, and the Australian Research Council through the ICT Centre of Excellence program.
Declarations
The publication costs for this article were funded by the Institute for Integrated and Intelligent Systems, Griffith University, and NICTA. This article has been published as part ofBMC GenomicsVolume 15 Supplement 4, 2014: SNP-SIG 2013: Identification and annotation of genetic variants in the context of structure, function, and disease. The full contents of the supplement are available online at http://www.biomedcentral.com/ bmcgenomics/supplements/15/S4
Authors’details
1Institute for Integrated and Intelligent Systems, Griffith University, Brisbane,
Australia.2NICTA - National ICT Australia.
Published: 20 May 2014
References
1. Laskowski RA, Thornton JM:Understanding the molecular machinery of genetics through 3D structures.Nature Reviews Genetics2008,9(2):141-151. 2. Zhou H, Zhou Y:Distance-scaled, finite ideal-gas reference state
improves structure-derived potentials of mean force for structure selection and stability prediction.Protein Science2002,11(11):2714-2726. 3. Guerois R, Nielsen JE, Serrano L:Predicting changes in the stability of
proteins and protein complexes: A study of more than 1000 mutations.
Journal of Molecular Biology2002,320(2):369-387.
4. Bordner A, Abagyan R:Large-scale prediction of protein geometry and stability changes for arbitrary single point mutations.Proteins: Structure, Function, and Bioinformatics2004,57(2):400-413.
5. Yin S, Ding F, Dokholyan NV:Eris: An automated estimator of protein stability.Nature Methods2007,4(6):466-467.
6. Deutsch C, Krishnamoorthy B:Four-body scoring function for mutagenesis.Bioinformatics2007,23(22):3009.
7. Benedix A, Becker CM, de Groot BL, Caflisch A, Bockmann RA:Predicting free energy changes using structural ensembles.Nature Methods2009,
6(1):3-4.
8. Dehouck Y, Grosfils A, Folch B, Gilis D, Bogaerts P, Rooman M:Fast and accurate predictions of protein stability changes upon mutations using statistical potentials and neural networks: PoPMuSiC-2.0.Bioinformatics 2009,25(19):2537.
9. Kellogg EH, Leaver-Fay A, Baker D:Role of conformational sampling in computing mutation-induced changes in protein structure and stability.
Proteins: Structure, Function, and Bioinformatics2011,79:830-838. 10. Kumar M, Bava KA, Gromiha MM, Prabakaran P, Kitajima K, Uedaira H, Sarai A:
ProTherm and ProNIT: Thermodynamic databases for proteins and protein-nucleic acid interactions.Nucleic Acids Research2006,34(Suppl 1):204. 11. Capriotti E, Fariselli P, Casadio R:A neural-network-based method for
predicting protein stability changes upon single point mutations.
Bioinformatics2004,20(Suppl 1):63.
12. Huang LT, Saraboji K, Ho SY, Hwang SF, Ponnuswamy M, Gromiha MM:
Prediction of protein mutant stability using classification and regression tool.Biophysical Chemistry2007,125(2-3):462-470.
13. Masso M, Vaisman II:Accurate prediction of stability changes in protein mutants by combining machine learning with structure based computational mutagenesis.Bioinformatics2008,24(18):2002. 14. Kang S, Chen G, Xiao G:Robust prediction of mutation-induced protein
stability change by property encoding of amino acids.Protein Engineering Design and Selection2009,22(2):75.
15. Tian J, Wu N, Chu X, Fan Y:Predicting changes in protein thermostability brought about by singleor multi-site mutations.BMC Bioinformatics2010,
11(1):370.
16. Yang Y, Chen B, Tan G, Vihinen M, Shen B:Structure-based prediction of the effects of a missense variant on protein stability.Amino Acids2013,
44(3):847-855.
17. Capriotti E, Fariselli P, Casadio R:I-Mutant2.0: Predicting stability changes upon mutation from the protein sequence or structure.Nucleic Acids Research2005,33(Suppl 2):306-310.
18. Cheng J, Randall A, Baldi P:Prediction of protein stability changes for single-site mutations using support vector machines.Proteins: Structure, Function, and Bioinformatics2006,62(4):1125-1132.
19. Huang LT, Gromiha MM, Ho SY:iPTREE-STAB: Interpretable decision tree based method for predicting protein stability changes upon mutations.
Bioinformatics2007,23(10):1292.
20. Shen B, Bai J, Vihinen M:Physicochemical feature-based classification of amino acid mutations.Protein Engineering Design and Selection2008,
21(1):37-44.
21. Capriotti E, Fariselli P, Rossi I, Casadio R:A three-state prediction of single point mutations on protein stability changes.BMC Bioinformatics2008,
9(Suppl 2):6.
22. Ozen A, Gonen M, Alpaydin E, Haliloglu T:Machine learning integration for predicting the effect of single amino acid substitutions on protein stability.BMC Structural Biology2009,9(1):66.
23. Teng S, Srivastava A, Wang L:Sequence feature-based prediction of protein stability changes upon amino acid substitutions.BMC Genomics 2010,11(Suppl 2):5.
24. Chen CW, Lin J, Chu YW:iStable: off-the-shelf predictor integration for predicting protein stability changes.BMC Bioinformatics2013,14(Suppl 2):5. 25. Folkman L, Stantic B, Sattar A:Sequence-only evolutionary and predicted
structural features for the prediction of stability changes in protein mutants.BMC Bioinformatics2013,14(Suppl 2):6.
26. Folkman L, Stantic B, Sattar A:Towards sequence-based prediction of mutation-induced stability changes in unseen non-homologous proteins.
BMC Genomics2014,15(Suppl 1):4.
27. Khan S, Vihinen MA:Performance of protein stability predictors.Human Mutation2010,1(1):675.
28. Faraggi E, Zhang T, Yang Y, Kurgan L, Zhou Y:SPINE X: Improving protein secondary structure prediction by multistep learning coupled with prediction of solvent accessible surface area and backbone torsion angles.Journal of Computational Chemistry2012,33(3):259-267. 29. Pollastri G, Baldi P, Fariselli P, Casadio R:Prediction of coordination
number and relative solvent accessibility in proteins.Proteins: Structure, Function, and Bioinformatics2002,47(2):142-153.
30. Ng PC, Henikoff S:Predicting deleterious amino acid substitutions.
Genome research2001,11(5):863-874.
31. Altschul SF, Madden TL, Schaffer AA, Zhang J, Zhang Z, Miller W, Lipman DJ:Gapped BLAST and PSI-BLAST: A new generation of protein database search programs.Nucleic Acids Research1997,25(17):3389. 32. Meiler J, Muller M, Zeidler A, Schmaschke F:Generation and evaluation of
dimension-reduced amino acid parameter representations by artificial neural networks.Molecular modeling annual2001,7(9):360-369. 33. Vihinen M, Torkkila E, Riikonen P:Accuracy of protein flexibility predictions.Proteins: Structure, Function, and Bioinformatics1994,
19(2):141-149.
34. Gromiha MM, Oobatake M, Kono H, Uedaira H, Sarai A:Relationship between amino acid properties and protein stability: buried mutations.
Journal of Protein Chemistry1999,18(5):565-578.
35. Zhang T, Faraggi E, Xue B, Dunker AK, Uversky VN, Zhou Y:SPINE-D: Accurate prediction of short and long disordered regions by a single neural-network based method.Journal of Biomolecular Structure and Dynamics2012,29(4):799-813.
36. Pudil P, Novovicova J, Kittler J:Floating search methods in feature selection.Pattern Recognition Letters1994,15(11):1119-1125.
37. Whitney AW:A direct method of nonparametric measurement selection.
IEEE Transactions on Computers1971,100(9):1100-1103.
38. Meinshausen N, Buhlmann P:Stability selection.Journal of the Royal Statistical Society: Series B (Statistical Methodology)2010,72(4):417-473. 39. Cortes C, Vapnik V:Support-vector networks.Machine Learning1995,
20(3):273-297.
40. Chang CC, Lin CJ:LIBSVM: A library for support vector machines.ACM Transactions on Intelligent Systems and Technology2011,2(3):27-12727. 41. Altschul SF, Gish W, Miller W, Myers EW, Lipman DJ:Basic local alignment
search tool.Journal of Molecular Biology1990,215(3):403-410. 42. Adzhubei IA, Schmidt S, Peshkin L, Ramensky VE, Gerasimova A, Bork P,
Kondrashov AS, Sunyaev SR:A method and server for predicting damaging missense mutations.Nature Methods2010,7(4):248-249. 43. Kabsch W, Sander C:Dictionary of protein secondary structure: pattern
recognition of hydrogen-bonded and geometrical features.Biopolymers 1983,22(12):2577-2637.
44. Berman HM, Westbrook J, Feng Z, Gilliland G, Bhat T, Weissig H, Shindyalov IN, Bourne PE:The protein data bank.Nucleic Acids Research 2000,28(1):235-242.
45. Khatun J, Khare SD, Dokholyan NV:Can contact potentials reliably predict stability of proteins?Journal of Molecular Biology2004,336(5):1223-1238. 46. Khan S, Vihinen M:Spectrum of disease-causing mutations in protein
secondary structures.BMC Structural Biology2007,7(1):56. 47. Thomas PD, Kejariwal A:Coding single-nucleotide polymorphisms
associated with complex vs. Mendelian disease: evolutionary evidence for differences in molecular effects.Proceedings of the National Academy of Sciences2004,101(43):15398-15403.
48. Capriotti E, Calabrese R, Casadio R:Predicting the insurgence of human genetic diseases associated to single point protein mutations with support vector machines and evolutionary information.Bioinformatics 2006,22(22):2729-2734.
49. Yue P, Melamud E, Moult J:SNPs3D: candidate gene and SNP selection for association studies.BMC Bioinformatics2006,7(1):166.
50. Bromberg Y, Yachdav G, Rost B:SNAP predicts effect of mutations on protein function.Bioinformatics2008,24(20):2397-2398.
51. Thusberg J, Vihinen M:Pathogenic or not? And if so, then how? Studying the effects of missense mutations using bioinformatics methods.
Human Mutation2009,30(5):703-714.
52. Li B, Krishnan VG, Mort ME, Xin F, Kamati KK, Cooper DN, Mooney SD, Radivojac P:Automated inference of molecular mechanisms of disease from amino acid substitutions.Bioinformatics2009,25(21):2744-2750. 53. Wainreb G, Ashkenazy H, Bromberg Y, Starovolsky-Shitrit A, Haliloglu T,
Ruppin E, Avraham KB, Rost B, Ben-Tal N:MuD: an interactive web server for the prediction of non-neutral substitutions using protein structural data.Nucleic acids research2010,38(Suppl 2):523-528.
54. Zhao H, Yang Y, Lin H, Zhang X, Mort M, Cooper DN, Liu Y, Zhou Y: DDIG-in: discriminating between disease-associated and neutral non-frameshifting micro-indels.Genome Biology2013,14(3):23. 55. Bendl J, Stourac J, Salanda O, Pavelka A, Wieben ED, Zendulka J,
Brezovsky J, Damborsky J:PredictSNP: robust and accurate consensus classifier for prediction of disease-related mutations.PLoS Computational Biology2014,10(1):1003440.
doi:10.1186/1471-2164-15-S4-S6
Cite this article as:Folkmanet al.:Feature-based multiple models improve classification of mutation-induced stability changes.BMC Genomics201415(Suppl 4):S6.
Submit your next manuscript to BioMed Central and take full advantage of:
• Convenient online submission
• Thorough peer review
• No space constraints or color figure charges
• Immediate publication on acceptance
• Inclusion in PubMed, CAS, Scopus and Google Scholar
• Research which is freely available for redistribution
Submit your manuscript at www.biomedcentral.com/submit