Evaluating the sustainable intensification
of arable farms
Article
Accepted Version
Gadanakis, Y., Bennett, R., Park, J. and Areal, F. (2015)
Evaluating the sustainable intensification of arable farms.
Journal of Environmental Management, 150. pp. 288298.
ISSN 03014797 doi:
https://doi.org/10.1016/j.jenvman.2014.10.005 Available at
http://centaur.reading.ac.uk/37916/
It is advisable to refer to the publisher’s version if you intend to cite from the
work.
To link to this article DOI: http://dx.doi.org/10.1016/j.jenvman.2014.10.005
Publisher: Elsevier
All outputs in CentAUR are protected by Intellectual Property Rights law,
including copyright law. Copyright and IPR is retained by the creators or other
copyright holders. Terms and conditions for use of this material are defined in
the
End User Agreement
.
www.reading.ac.uk/centaur
CentAUR
Central Archive at the University of Reading
Reading’s research outputs online
pg. 1
Evaluating the Sustainable Intensification of arable farms
Yiorgos Gadanakis*a, Richard Bennett, Julian Parka, Francisco Jose Areala
a School of Agriculture, Policy and Development, University of Reading, Whiteknights, PO Box 237,
Reading, RG6 6AR, UK
e-mail addresses: Richard Bennett - r.m.bennett@reading.ac.uk, Julian Park - j.r.park@reading.ac.uk, Francisco Jose Areal - f.j.areal@reading.ac.uk
* Corresponding Author. Tel. +44 118378 6056 Mobile: +44 7799041241 - e-mail addresses:
g.gadanakis@reading.ac.uk, grgadanakis@gmail.com (Y. Gadanakis)
Abstract
Sustainable Intensification (SI) of agriculture has recently received widespread political attention, in both the UK and internationally. The concept recognises the need to simultaneously raise yields, increase input use efficiency and reduce the negative environmental impacts of farming systems to secure future food production and to sustainably use the limited resources for agriculture. The objective of this paper is to outline a policy-making tool to assess SI at a farm level. Based on the method introduced by Kuosmanen and Kortelainen (2005), we use an adapted Data Envelopment Analysis (DEA) to consider the substitution possibilities between economic value and environmental pressures generated by farming systems in an aggregated index of Eco-Efficiency. Farm level data, specifically General Cropping Farms (GCFs) from the East Anglian River Basin Catchment (EARBC), UK were used as the basis for this analysis. The assignment of weights to environmental pressures through linear programming techniques, when optimising the relative Eco-Efficiency score, allows the identification of appropriate production technologies and practices (integrating pest management, conservation farming, precision agriculture, etc.) for each farm and therefore indicates specific improvements that can be undertaken towards SI. Results are used to suggest strategies for the integration of farming practices and environmental policies in the framework of SI of agriculture. Paths for improving the index of Eco-Efficiency and therefore reducing environmental pressures are also outlined.
Keywords: Sustainable Intensification, Agriculture, Data Envelopment Analysis, Eco-Efficiency, Environmental Pressures, Double Bootstrapped Truncated Regression
pg. 2
1.
Introduction
Climate change and increased food demand are two of the most important challenges for the future growth of agricultural systems. The need for securing food supply, managing natural resources efficiently, building resilience to more frequent extreme weather phenomena and developing adaptation strategies for farmers has prioritised the need for a Sustainable Intensification (SI) of agriculture (FAO, 2011; Foresight Report, 2011).
Firbank et al. (2013), define SI at a farm level as the process of increasing agricultural production per unit of input whilst at the same time ensuring that environmental pressures generated at a farm level are minimised. SI of agriculture can therefore be considered not only as a practice but also as a mechanism of farm management that serves the balance between sustainability and intensification of production. This relies on the engagement of integrated methods and technologies to manage limited natural resources (soil and water), pests and nutrients (Pretty, 1997). Garnett et al. (2013) suggest that food security requires as much attention to be focussed on increasing environmental sustainability as to raising productivity. This means that, farmers, not only need to simultaneously increase yields to meet food demand, but also need to reduce environmental pressures generated by the production process. Therefore, from an environmental perspective this means reducing any additional conversion of land to agriculture (maintain existing land ecosystems and biodiversity), increasing productivity and improving input use efficiency (e.g. water, energy, agrochemicals) (Garnett et al., 2013; Garnett and Godfray, 2012).
Agriculture in the UK is a major contributor in determining and enhancing the viability of rural economies and preserving rural landscapes but also is the main source of degradation in a range of ecosystems services (Firbank et al., 2008). Sustainable farming systems therefore, are characterised as those that are able to be productive and to maintain their contribution to society in the long term. These agricultural systems by definition will be using natural resources efficiently, be competitive in the commercial market and environmentally protective (Rigby and Caceres, 1997).
For UK agriculture to meet the future challenges of food demand and climate change, SI can therefore be a management option especially for areas that are experiencing a stasis in productivity growth, where a more efficient use of natural resources, production inputs and new technologies may be able to move production onto an upward trajectory and at the same time reduce the negative environmental impacts (Barnes and Thomson, 2014; Firbank et al., 2013; Garnett et al., 2013). Recent research has sought evidence of SI among farming systems in the UK (Areal et al., 2012; Barnes and Poole, 2012; Barnes and Thomson, 2014; Firbank et al., 2013). Firbank et al. (2013) suggest that a farm is practising SI when it has managed to increase the food production per unit area in the study period and at the same time none of the environmental indicators selected has deteriorated.
pg. 3
1.1. Using Eco-Efficiency to measure sustainable intensification
One of the challenges in measuring SI is to find appropriate measures of the environmental dimensions. One variable that may give some indication of change in supply of ecosystem services is the level of rough grazing area to total area used, a criterion for identifying Higher Nature Value farming systems (Barnes et al., 2011), and also as a proxy for environmental outputs (Areal et al., 2012). Firbank et al. (2013) underlines the need for the development of metrics that can simultaneously account for both environmental pressures and economic output of farming systems in order to evaluate SI at farm level in temperate regions. As an example, composite indicators have been used to assess sustainability and production efficiency (Gomez-Limon and Riesgo, 2009) in the agricultural sector since it is possible, with the appropriate weighting of the different dimensions of the indicator, to assess progress on the three common dimensions of sustainability (economic, social and environmental) in order to produce an integrated performance output for evaluation. According to Barnes and Thomson (2014), most composite indicators have focused on country or regional level while only a few focus specifically on the agricultural sector. However, there is no evidence for the existence of an agreed set of indicators or a composite indicator for evaluating and measuring SI (Barnes and Thomson, 2014; Firbank et al., 2013; Westbury et al., 2011).
As such a composite indicator, the Economic-Ecological Efficiency, frequently known as Eco-Efficiency, emerged as a practical approach for evaluating progress towards sustainability and economic efficiency (Schaltegger et al., 1996). The OECD (1998) defines Eco-Efficiency as a ratio of an output (value of products) over the inputs used (the sum of environmental pressures generated by the firm, the sector or the economy) which measures the efficiency with which ecological resources are used to meet human needs. Using Eco-Efficiency as a measure of the economic value added over the environmental pressure generated is a potential method of evaluating progress towards the SI of agricultural systems. Therefore, an improvement in the Eco-Efficiency index can be translated as a decrease in environmental impact while the value of production is maintained or increased (de Jonge, 2004; European Environment Agency (EEA) 2010; Gomez-Limon et al., 2012) and the reverse in the case of deterioration.
However, as emphasised by the WBCSD (2000), improvements in the index of Eco-Efficiency do not automatically lead to improvements in sustainability. Given that sustainability is usually concerned with the absolute pressure that an economic activity is generating rather than the relative pressure, the main pitfall in the Eco-Efficiency ratio is that high levels of environmental pressures (e.g. soil erosion, pesticides risk, water use, fertiliser risk, CO2 emissions) generated at a farm level can be
compensated by high levels of Net Farm Income (Gomez-Limon et al., 2012; Kuosmanen and Kortelainen, 2005; Picazo-Tadeo et al., 2011).
These shortcomings however, do not invalidate the use of Eco-Efficiency as a concept to stimulate innovation and enhance the SI of farming systems. Kuosmanen and Kortelainen (2005) suggest at least two basic reasons for using an Eco-Efficiency index for assessing the impacts of production
pg. 4 systems. First, in the context attempting to reduce environmental pressures, improvements in Eco-Efficiency can be shown to be cost-effective and second, from a policy perspective, improvements in the efficient use of inputs are more attractive and easier to adopt than policies that directly restrict the level of economic activity. This win-win outcome of policies promoting efficient use of inputs encourages sustainable agriculture without the need for even greater environmental regulation as it leads to a reduction in the level of damaging inputs, such as fertilisers, pesticides, fossil fuels etc., will increase environmental efficiency and also improve net cost savings (de Jonge, 2004).
Therefore SI can be viewed as a trade-off between economic and ecological performance characterised by an Eco-Efficient frontier (Mahlberg and Luptacik, 2014) that aims to reduce environmental pressures in agriculture. In other words, a farm lying on the frontier cannot increase output without increasing the intensity of production which results in increasing waste and emissions. Eco-Efficiency frontiers can be estimated with the use of the Data Envelopment Analysis (DEA) method, a non-parametric frontier based modelling approach. A detailed literature review on integrated ecological-economic analysis in a production context is presented in Lauwers (2009). One of the approaches suggested by Korhonen and Luptacik (2004) for modelling and assessing Eco-Efficiency in a DEA based modelling is to account simultaneously for economic and ecological performance given that the objective is to increase the desirable outputs and minimise the environmental pressure generated by the production process. According to Picazo-Tadeo et al. (2012) this provides a base for developing a broad range of models depending on the treatment of the economic output and/or the environmental pressures.
Various research papers have used DEA techniques to discuss the notion of Eco-Efficiency in different industries (Hua et al., 2007; Korhonen and Luptacik, 2004; Kuosmanen and Kortelainen, 2005; Lauwers, 2009; Zhang et al., 2008). Although DEA techniques have been widely used for the assessment of the environmental performance of farms (Asmild and Hougaard, 2006; Buckley and Carney, 2013; D’Haese et al., 2009; de Koeijer et al., 2002) and the agricultural sector (Barnes et al., 2009) only a few research papers have applied the method for the assessment of farming Eco-Efficiency (Gomez-Limon et al., 2012). Picazo-Tadeo et al. (2011) have used DEA techniques for the assessment of potential environmental pressure reductions in a set of 171 farms in rain-fed agriculture systems of Valencia, Spain. Further examples include Picazo-Tadeo et al. (2012) Gomez-Limon et al. (2012), and Iribarren et al. (2011).
Other alternatives are the integration of the Sustainable Value (SV) method in a production framework approach (Ang and Van Passel, 2010; Ang et al., 2011; Kuosmanen and Kuosmanen, 2009; Mondelaers et al., 2011; Van Passel et al., 2009). The method integrates the efficiency in respect to the triangular dimension of sustainability (i.e. economic, social and environmental) into a monetary value. However, a substantial debate has developed after its introduction as a measure of strong sustainability by Figge and Hahn (2004).
pg. 5 Here, it is suggested that environmental pressures generated at a farm level, as defined by Picazo-Tadeo et al. (2011), can be interpreted as an indication of the level of intensification of agricultural production in an effort to secure yields and maximise profit. Higher levels of inputs for individual farms in a benchmarked sample indicate that these farmers are using more intensive production methods when compared with others in the same sample. The objective of this paper is to measure the SI of farming systems, which can be used by both farmers and policy makers to identify excess input use and explore the different levels of intensification between farms of the same type. Little, if any, previously published research has so far applied DEA estimates of Eco-Efficiency for the assessment of SI in agricultural systems.
The main objective of the paper is to use an estimated Eco-Efficiency index to assess the SI of General Cropping Farms (GCFs) in the East Anglian River Basin Catchment of England (EARBC). Moreover, it aims to identify the characteristics of the farming systems that may have an impact on Eco-Efficiency and subsequently to the balance between sustainable production and intensification.
2.
Material and methods
2.1. Dataset and variablesData for the empirical application of the model was obtained from the Farm Business Survey (FBS) which is a comprehensive and detailed database that provides information on the physical and economic performance of farm businesses in England1.
Initially data for 83 GCFs2 were extracted from the FBS. These GCFs, geographically located in the
EARBC were surveyed for the FBS in 2011. Ten farms were excluded due to missing data or zero values. Because DEA methods are quite sensitive to the presence of outliers in the data when measuring efficiency (Sexton et al., 1986), the remaining 73 farms were tested for outliers using the graphical method of Wilson (1993) presented in detail on the online appendix of this paper.
This resulted in a sample of 61 GCFs after detecting and excluding outliers, based on the EARBC from the FBS 2011/2012 database. The GCF type was selected because of the mixture of crops (potatoes, sugar beet, cereals, horticulture) that requires intensive use of machinery (especially potatoes and sugar beet), irrigation of the crops to secure (under drought conditions) yield and also because it is one of the most representative agricultural systems in the EARBC.
1 For further information about the Farm Business Survey, including data collection, methodology and Farm
Business Survey results, please visit the Defra Farm Business Survey website:
http://www.defra.gov.uk/statistics/foodfarm/farmmanage/fbs/
2 As GCFs are classified holdings on which arable crops (including field scale vegetables) account for more than
two thirds of their total Standard Output (SO) excluding holdings classified as cereals; holdings on which a mixture of arable and horticultural crops account for more than two thirds of their total SO excluding holdings classified as horticulture and holdings on which arable crops account for more than one third of their total SO and no other grouping accounts for more than one third. (FBS 2009-2010).
pg. 6 The production technology in the case of GCFs in the EARBC is described through the economic costs of fertilisers, crop protection, water use, and machinery fuel and energy requirements. Each variable is expressed on a per hectare basis when used as input in the model. These are described in detail by the Farm Business Survey Instructions for data collection (Farm Business Survey, 2011)3. Additional
descriptive statistics in regards to the area farmed, machinery costs and total hours spend for farming (labour and farmer hours) are available in Table 1.
Table 1: Descriptive statistics of the inputs and the outputs used in the DEA linear programming models No of farms 61 Area Farmed (ha) Machinery cost (£/ha) Labour (annual hours) Fertiliser cost (£/ha) Crop protection cost (£/ha) Water cost (£/ha) Machinery fuel cost (£/ha) Energy cost (£/ha) Gross Margin (£/ha) Mean 447 84 7405 142 133 7 70 18 1,231 St. Deviation 697 101 11,367 46 61 5 42 14 386 Minimum 23 10 10 15 6 1 5 1 491 Maximum 44,207 710 62,950 241 293 21 194 75 2,724 2.1.1. Study area
More than half of the EARBC land surface is used for agriculture and horticulture (approximately 1.5 million hectares). Also, it is recognised as one of the most productive agricultural landscapes in England, known for its cereal crops and the production of potatoes and sugar beet. In particular, in the counties of Cambridgeshire, Lincolnshire, Norfolk and Suffolk over half of the total sugar production in England is harvested. In addition, the EARBC is characterised as an area with high risk of drought and increased demand for direct abstraction of water (Charlton et al., 2010).
pg. 7
2.2. Assessing sustainable intensification of agriculture with Data Envelopment Analysis
2.2.1. DEA approach4
The DEA method (Charnes et al., 1985; Charnes et al., 1978; 1979; 1981) was used to assess the SI of the GCFs in the EARBC. DEA is a linear-programming method which calculates the most efficient Decision Making Units (DMUs) or the best-practice frontier in a given set of firms, here in relation to GCFs. DEA is a non-parametric method in the sense that it requires only a limited number of a-priori assumptions regarding the functional relationship between inputs and outputs. Instead, the production frontier is constructed as a piecewise linear envelopment of the observed data points. Different units of measurement can be used for the various inputs and outputs and knowledge of their relative prices is not required. The DMUs enclosed by the envelope are the ones considered to be inefficient and, depending on the model of DEA used (either input or output oriented), should adjust their inputs or outputs to move on the frontier. In output oriented DEA the frontier represents the maximum output which could be obtained using a given input level, while input-oriented DEA minimizes inputs for a given level of output. While using DEA two different approaches can be considered based on the assumptions taken on returns to scale: Constant Returns to Scale (CRS) (the Charnes, Cooper and Rhodes (CCR) model (Charnes et al., 1978)) and Variable Returns to Scale (VRS) (the Banker, Charnes and Cooper (BCC) model (Banker et al., 1984)).
DEA, as opposed to adopting weighing schemes for indicators estimation, does not use subjective judgement, which may be considered an advantage (Cooper et al., 2006; Kuosmanen and Kortelainen, 2005). DEA techniques has been used to assess the environmental impacts associated with agricultural production process (Aldanondo-Ochoa et al., 2014; Asmild and Hougaard, 2006; de Koeijer et al., 2002; Gerdessen and Pascucci, 2013). In particular, DEA has been used to jointly evaluate the economic and environmental potential improvement of production systems by incorporating environmentally undesirable or unwanted outputs such as, nutrient leaching from the soil, emissions and diffuse pollution.
4For the purposes of this paper and to keep consistent with the previous literature, symbols and formulations of
pg. 8 Here, Eco-Efficiency is defined as the ratio of economic value added over the environmental pressures generated. Let us assume that we observe a set of homogenous farms and that this set of farms is generating economic value denoted by variable . Furthermore, the agricultural production process generates a set of damaging environmental pressures similarly observed at a farm level which are denoted by the matrix
. The Intensified Production Technology5 set (IPT) representing all the feasible combinations of value
added , and environmental pressures , is defined as:
a e a e a e e e a e ess es (1)
where . Following Kuosmanen and Kortelainen (2005) and Picazo-Tadeo et al. (2011) Eco-Efficiency of farm is formally defined as:
(2)
where is the pressure function that aggregates the environmental pressures into a single environmental pressure score.
The economic value added is calculated as follows:
(3)
The value added on the numerator of the Eco-Efficiency ratio can be calculated either through direct primary data collection or indirectly by using published information (secondary data) on prices and quantities of outputs. Secondary data obtained from consistent and robust databases, such as the UK’s Farm Business Survey (FBS) or the Farm Accountancy Network (FADN) of the European Union, can provide a reliable source of information (Barnes and Thomson, 2014). The difficulty in the assessment of Eco-Efficiency arises in deciding about the weighting scheme required for the calculation of the aggregated composite indicator of environmental pressures (i.e. the denominator). The various dimensions of an environmental pressure composite indicator require the adoption of a weighting scheme to assign relative importance to each pressure. Common practices for this purpose are the use of workshops, expert panels, arbitrary equal weighting schemes and also weightings based on a selection of subjective valuations or judgements. Workshops have been used by Ripoll-Bosch et al. (2012) to generate a weighting scheme on a farm by farm basis with respect to intensification. However, the use of a subjective weighting scheme can lead to bias and conflicting
5 The term Intensified Production Technology is preferred in this paper rather than the Pressure Generating
Technology (PGT) introduced by Picazo-Tadeo et al. (2011) since we have argued that excessive use of inputs is related to the effort of farming systems to intensify the production process.
pg. 9 weights assigned to the different dimensions within the framework of SI strategies (Barnes and Thomson, 2014). Furthermore, in order to avoid any bias, Picazo-Tadeo et al. (2011) and Kuosmanen and Kortelainen (2005) are suggesting the use of DEA as the preferred aggregation method. Instead of assigning a common scheme of weights for each input in the sample, the solution of the Linear Programme (LP) through DEA techniques allows the identification of a set of optimal weights to be determined at a farm level. Specifically, a set of weights for farm is chosen so that it maximises the relative Eco-Efficiency score of this farm when it is benchmarked with the other farms in the sample (Picazo-Tadeo et al., 2011).
To compute the composite environmental pressure indicator of farm , a weighted sum of the environmental pressures generated by farm to the environment is required. This is expressed as:
(4)
where is the weight with which pressure enters into the computation of the composite
environmental pressure indicator for farm .
More specifically, and according to expression (4)
(5)
At this point it is useful to emphasize that the optimal weight assigned for each environmental pressure can differ among different farms under evaluation. This can be overcome by assigning a restriction to weights through linear programming techniques. For the purpose of this research it was decided not to use any weight restrictions and to use DEA to assign the optimal weights for the environmental pressures in each farm as suggested in the literature (Kuosmanen and Kortelainen, 2005; Picazo-Tadeo et al., 2011).
The Eco-Efficiency score for each farm belonging to the benchmarking sample of farms is computed from the following fractional programme to obtain values for the aggregated environmental pressure weights . Eco-Efficiency for the farm is
maximised subject to the constraint that all efficiency measures must be less than or equal to one. This is because the ratio is formed relative to the Euclidean distance from the origin over the production possibility set.
pg. 10 a e - e e (6)
Since the above formulation yields infinite solutions, it is necessary to reformulate the calculation and express the DEA problem using duality. Therefore, the fractional programme (6) has an equivalent envelopment form, which is expressed as:
e - e e
(7)
Where is a scalar, representing the Eco-Efficiency score for each of the farms. The estimate will satisfy the restriction with the value indicating an Eco-Efficient farm. Moreover, a set of intensity variables 6 representing the weighting of each observed farm in the composition of the eco-efficient frontier, is introduced.
The interpretation of the envelopment model results can be summarized as:
a) If , then the farm under evaluation is on the frontier (100% efficient) and has achieved a balance between intensified production technology and economic value added. Otherwise, if then the farm under evaluation is less than 100% efficient i.e. there is a potential proportional reduction of environmental pressures which would decrease the intensification of production and would improve the balance between environmental pressures and economic value added generated at a farm level.
b) The left hand side of the envelopment models is the reference set while the right hand side represents the specific farm under evaluation. The non-zero optimal represents the benchmarks for a specific farm. The reference set will provide coefficients for the to define the hypothetically efficient farm. The reference set or the efficient target reveals how environmental pressures can be reduced to make the farm more efficient where the sustainable intensification of agriculture, (as
6Symbols
and are used for notation purposes in order to distinguish between the weights in a) fractional and b) envelopment form of the DEA model
pg. 11 defined by a balance between environmental pressure and economic value added) is seen as a desirable outcome.
By adding the constraint in (7) we solve the envelopment form of the DEA model under the VRS7 assumption to measure the technical efficiency performance of the GCFs in the sample in
order to explore the relationship between technical efficiency and Eco-Efficiency. Inputs used in the model are area farmed, machinery costs, total hours spent on farming (labour and farmer hours), fertiliser costs, crop protection costs, water costs, machinery fuels and energy costs. Output used in the model is the gross margin per hectare. A ea a ’s e a es s e e a purpose.
2.2.2. Slack considerations within DEA models
The efficiency scores derived from expression (7) assess the radial reductions of environmental pressures required for a farm to attain Eco- e ase Fa e ’s e e a a (Farrell, 1957). However, this is not Pareto-Koopmans efficient (Koopmans, 1951). For example, although a farm can have efficiency score of one additional reductions might be feasible in some pressure directions, while the economic value added is maintained. This is called in the DEA literature as “ eek D A e e a ” (Sherman and Zhu, 2006) in the sense that some inputs could be reduced or some outputs could be expanded without affecting the need for other inputs or the production of other outputs. A solution to this drawback is to penalise for this excess in inputs and shortfall in outputs (“slacks”) in the DEA model formulation (Charnes et al., 1985). Following the traditional DEA framework (Cooper et al., 2006; Tone, 2001) these pressure-specific reductions, or pressure slacks, can be obtained from the following optimising program (Ali A. and Seiford L. M., 1993; Picazo-Tadeo et al., 2011).
7This is because a farmer cannot change all the inputs used for the production (limited resources land, water) as
a constant returns to scale assumes (CRS). In other words, the conservative VRS approach is preferred because CRS implies linearity between inputs and outputs meaning that doubling the inputs used will double the outputs which is obviously not the case in agriculture.
pg. 12 (8)
The slack variables and represent the shortfalls in economic value added and the excess in environmental pressures generated, respectively. The objective of expression (8) is to maximise the sum of pressure excess and value added shortfalls at a farm level while keeping their radial Eco-Efficiency scores at the level calculated from expression (7) (Picazo-Tadeo et al., 2011). If there is positive slack, we can say that the farm is Farrell efficient but that there is additional saving potential associated with some inputs and/or the opportunity for expansion associated with some outputs. Thus, expression (8) is used to assess the economic inefficiency of a farm by a slacks based efficiency score after environmental pressures are adjusted to their minimum level.
Additionally, excess in use of resources identified by slacks (e.g. fertiliser costs, labour, fuels) are used to identify and estimate the causes of economic inefficiency (Sherman and Zhu, 2006; Zhou et al., 2006). In this sense, any excess in environmental pressures identifies an intensified agricultural production unit that could reduce its environmentally-damaging inputs. In the framework of SI, the identification of pressure specific reductions as defined by Picazo-Tadeo et al. (2011) stimulates inefficient farmers to further improve their productivity while simultaneously focusing on the reduction of excess in the use of environmentally-damaging inputs.
We applied T e se ’s e , as it is presented below, to estimate the potential reductions in the intensified production technology towards the improvement of the economic and environmental efficiency of the farm in the framework of SI (Torgersen et al., 1996).
The aggregate reduction of pressure needed to bring farm into a Pareto – Koopmans efficient status is computed by adding together radial reductions and pressure specific excess.
(9)
is representing pressure slacks (excesses)
The left side of the equation is the proportional reduction of pressure while the right side is the pressure specific excess.
pg. 13 In order to measure the pressure specific Eco-Efficiency it is necessary to also measure the Pareto-Koopman efficient level of pressure .
(10)
Finally the pressure specific measure of co- fficiency8 for farm and pressure is computed as the
ratio between the Eco-Efficient le e a ess e a ’s actually observed level in order to account for the total proportional reduction in that pressure needed to bring farm into a Pareto – Koopmans efficient status.
ess e s e e e e (11)
The importance of slacks in explaining pressure specific Eco-Efficiency can be assessed by computing the weighting of potential pressure reductions due to slacks, on total pressure potential reductions. The above relationship can be expressed formally for pressure as:
(12)
being the pressure that would result from the radial contraction of all
environmental pressures of farm towards its eco-efficient reference on the frontier.
Information on radial Eco-Efficiency and slack values for each farm are then used through expressions (11) and (12) in order to reveal the aggregated reduction in each environmental pressure to achieve Eco-Efficiency and consequently to improve the performance of the farm towards SI.
2.3. Econometric estimation of drivers of Eco-Efficiency
Beyond the analysis of specific environmental pressures for each farm, a regression model at a second stage was used to assess the impact of various managerial and farm characteristics on the level of Eco-Efficiency.
The selection of potential determinants of farm Eco-Efficiency was based in the consideration of previously published literature (Barnes, 2008; Barnes and Thomson, 2014; Basset-Mens et al., 2009; Gomez-Limon and Sanchez-Fernandez, 2010; Meul et al., 2008; Picazo-Tadeo et al., 2011; Van Passel et al., 2007)
8
The concept of pressure specific Eco-Efficiency should not be confused with the DEA sub-vector efficiency model as it used for example by Speelman et al. (2008). The main difference is that the latter is used to measure input specific efficiency (i.e. water use efficiency, energy efficiency, etc.) for a given level of inputs and outputs in the DEA model.
pg. 14 The hypotheses to be tested via these variables are the following:
Farm size: It is expected that larger farms operate more efficiently since they have developed economies of scale that improve productivity and efficiency.
Farmer’s education level and experience: It is expected that farmers with higher educational levels and experience, manage and allocate resources more efficiently. That is farmers are able to allocate inputs and manage excess better through innovative management techniques on the field (precision agriculture). Moreover, it is expected that farms with better ratios between inputs and outputs have better managerial skills and can allocate resources better in the production process and therefore potentially improve the ratio between economic value added and the environmental pressures generated at farm level.
In addition the participation of the farmer into the Linking Environment and Farming (LEAF) organisation as well as to Agri-Environmental payment schemes (Entry Level Stewardship, Higher Level Stewardship, Countryside Stewardship Scheme, etc) promotes sustainable food and farming with high environmental standards and therefore enhances Eco-Efficiency, (Agri-Environmental payments and cost variables in the model).
Following the above description of the variables, the following econometric model is estimated:
Where, EcoEff is the biased corrected Eco-Efficiency, Dsmall and Dmedium are dummy variables (1=Small, 0=Otherwise and 1=Medium, 0=Otherwise respectively) for the small and medium farm sizes respectively 9, Edu is a dummy variable defining the level of education (1=Higher (e.g. college or
above and 0=Basic (e.g. Only school, A level, etc.), LeafMemb is a variable indicating the membership of a farmer in the LEAF organisation, (1=Membership and 0 otherwise), the AgriEnP and AgriEnC define the environmental payments received and the costs related to these (a eas e £) by each individual farm and finally, the age of the farmer is indicated by the variable FarmerAge.
The descriptive statistics of the explanatory variables are presented in Table 2.
9 In order to classify farms in the FBS into different sizes the Standard Labour Requirements (SLR) for different
enterprises are calculated which are then used to find the total amount of standard labour used on the farm. Once the total annual SLR has been calculated the number of hours can be converted to an equivalent number of full time workers (on the basis that a full-time worker works a 39 hour week and so 1900 hours a year). This leads to the classification of farms by number of full time equivalent (FTE) workers as follows:
pg. 15 Table 2: Descriptive statistics of the variables used in the truncated regression model
Mean/No of cases St. Deviation
Bias Corrected Eco - Efficiency 0.449 0.192
Agri-Environmental Payments £‘000 22.64 41.26
Agri-Environmental Costs £’000 6.58 16.24
Farmer Age 55.23 9.51
Large Farm Size 33
Medium Farm Size 22
Small Farm Size 6
LEAF Membership 13
No LEAF Membership 48
Basic Education 18
Higher Education 43
Studies measuring productivity and efficiency using DEA to investigate the impact of environmental factors at a second stage analysis have suffered from two problems. 1) serial correlation among the DEA estimates and 2) correlation of the inputs and outputs used in the first stage with second-stage environmental variables (Simar and Wilson, 2007). A solution to these problems consists of bootstrapping the results to obtain confidence intervals for the first stage productivity or efficiency scores (Simar and Wilson, 1998; 2007).
The significance of the Simar and Wilson (2007) double bootstrap procedure derives from the bias corrected efficiency estimation of (estimated by expression (7)). These estimates are used as parameters in a truncated regression model. The selection of the model was based on the fact that the outcome variable is restricted to a truncated sample of a distribution. Since the dependent variable can take values between zero and one, we have a e a e sa e (0≤ ase corrected Eco-Efficiency). It must be noted that a censored model (e.g. Tobit) would not have been appropriate in this case since Eco-Efficiency data have the characteristics of truncated data – limited in the sample of interest. Furthermore, according to Simar and Wilson (2007) and Banker and Natarajan (2008) Tobit estimation in the second stage yields biased and inconsistent estimators. The main reason for the selection of the truncated model by Simar and Wilson (2007) is that the true efficiency estimates are unobserved and are replaced with DEA estimates of efficiency. A detailed presentation of the double bootstrapped procedure and the Algorithm 2 used in this paper is available in Simar and Wilson (2007) and the adaptation of this methodology for explaining Eco-Efficiency in Picazo-Tadeo et al. (2011).
pg. 16
3.
Results
3.1. Measuring Eco-Efficiency in the East Anglian River Basin Catchment 3.1.1. Summary of Eco-Efficiency
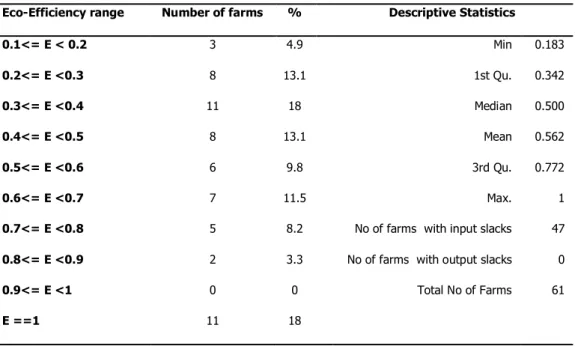
In relation to radial Eco-Efficiency - 18% of the farms are on the frontier with the remaining 82% of the farms being characterised as Eco-Inefficient. Additionally, from the 61 farms in the sample, 47 farms were identified as having input slacks (i.e. there is additional saving potential associated with some of the environmental pressures) while there were no output slacks (i.e. there is no opportunity for expansion associated the economic value added). Table 3 presents a summary of the radial Eco-Efficiency scores as they have been calculated from expression (7)10.
Technical efficiency of the farms was estimated through a VRS DEA input oriented model. The results of the analysis illustrate that farmers in the sample are also relatively technical inefficient with an a e a e e a e e 0.79 a 66% e a s e e e e . A s , a ea s ’s correlation coefficient of 0.67 reveals a positive correlation between technical efficiency and Eco-Efficiency. A summary of the results and technical efficiency estimates per farm can be found as supplementary material in the online appendix of this paper.
Table 3: Summary of Eco-Efficiency scores for the farms in the sample
Eco-Efficiency range Number of farms % Descriptive Statistics
0.1<= E < 0.2 3 4.9 Min 0.183 0.2<= E <0.3 8 13.1 1st Qu. 0.342 0.3<= E <0.4 11 18 Median 0.500 0.4<= E <0.5 8 13.1 Mean 0.562 0.5<= E <0.6 6 9.8 3rd Qu. 0.772 0.6<= E <0.7 7 11.5 Max. 1
0.7<= E <0.8 5 8.2 No of farms with input slacks 47
0.8<= E <0.9 2 3.3 No of farms with output slacks 0
0.9<= E <1 0 0 Total No of Farms 61
E ==1 11 18
10 To solve the DEA linear programme both in expression (7) and (8) we have used the package Benchmarking
pg. 17
3.1.2. Pressure specific Eco-Efficiency
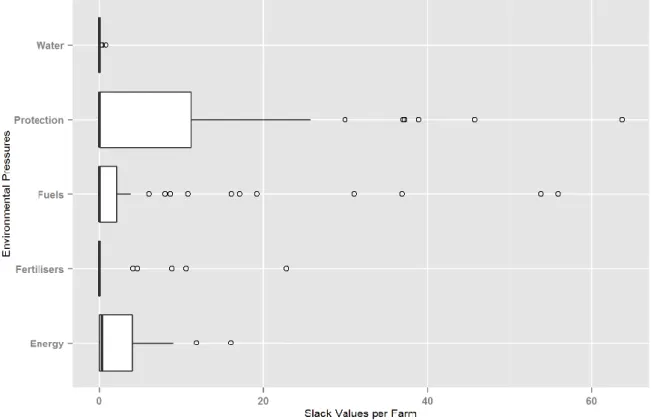
Figure 1 provides a visualisation of the slack values in relation to the specific environmental pressure generated. Costs related to crop protection, machinery fuel and energy are the three environmental pressures that require the highest extra proportional reduction per farm. That is the reduction in excess of specific inputs whilst keeping efficiency at its maximum level.
Figure 1: Slack values for each individual farm per environmental pressure category
To illustrate the interpretation of radial Eco-Efficiency, and pressure specific Eco-Efficiency generated by each component of the intensified production technology set, the case of farm ID 22, is considered in more detail as an example.
Farm 22 has initially = fertiliser costs (£170) + crop protection costs (£144.7) + water costs (£1.1) + machinery fuel costs (£49.8) + energy costs (£5.5) = £371.2 per ha and its radial Eco-Efficiency score is =0.7787. Therefore, it could reach the frontier if the input values are reduced radially by the ratio and the input excess recorded (slack) (Cooper et al., 2006). If we only consider the radial Eco-Efficiency each environmental pressure must be reduced by 22.13% (1-0.7787) while maintaining value added which implies a total £82.1 cost reduction per ha. Using the information of slacks in DEA, the computed excess for specific pressures for this farm would allow for further reductions. Specifically, crop protection costs and machinery fuels costs have slack values equal to £8.9 a £8.7 respectively. That a s e a e e e e s £17.6. Therefore, adding together radial reduction and pressure specific excess, the aggregate reduction in cost necessary to achieve Eco-E e a s £99.7 per ha, such that the efficient pressure would
pg. 18 e £271.5 per ha. Accordingly, the pressure specific score of Eco-Efficiency for this farm on crop protection costs is 0.7172, and 0.6064 for machinery fuel costs which stems from the comparison of eco-efficient pressure to actually observed environmental pressure. Table 4 presents a summary of the pressure specific Eco-Efficiency scores for the GCFs in the EARBC. For the measurement of pressure specific Eco-Efficiency expression (11) has been used.
Table 4: Mean pressure specific Eco-Efficiency
Mean Pressure specific
Eco-efficiency
St. Deviation
Minimum Maximum Percentage of farms with slack Fertiliser Cost 0.556 0.264 0.183 1 8.20% Crop Protection 0.514 0.289 0.126 1 40.98% Water Cost 0.561 0.269 0.178 1 4.92% Machinery Fuels 0.511 0.278 0.180 1 26.23% Energy Costs 0.481 0.317 0.033 1 50.82%
When solving for maximum efficiency, the non-binding environmental pressures constraints indicate that the amount of slack in inputs is the unnecessary expenditure and can be avoided without sacrificing efficiency. The extent to which slacks are explaining the aggregate potential reduction of environmental pressures, the weights assigned for each environmental pressure per farm, slack values per environmental pressure and per farm as well as the relevant summaries are available as online supplementary material for the paper.
3.2. Explaining Eco-Efficiency
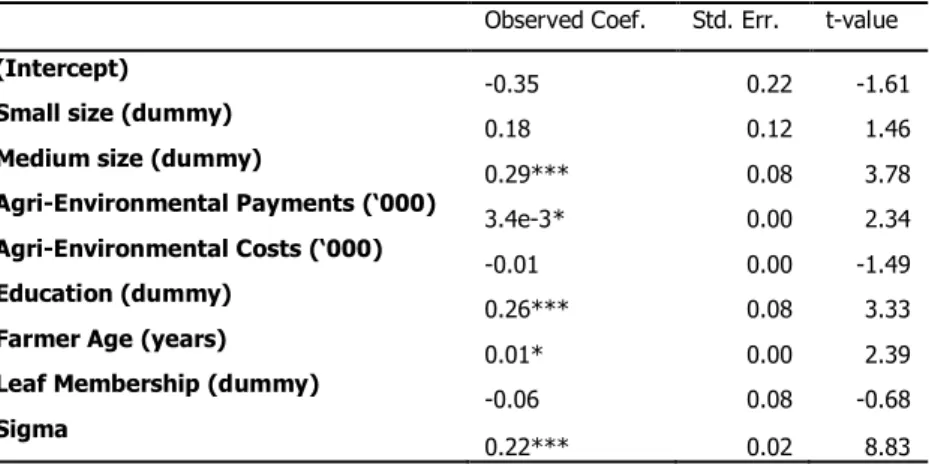
For the 61 GCF in the sample the average ordinary DEA input orientated Eco-Efficiency score was 0.562, while the bias corrected Eco-Efficiency score was 0.449. The 95% confidence intervals of the bias-corrected Eco-Efficiency score ranged between 0.393 (Lower bound) and 0.542 (Upper Bound). Table 5 presents a summary of the results of the truncated regression. From the initial results it can be stated that the model is a good fit with the data (Wald Chi-square=28.54, P<0.01).
The impact of farm size, agri-environmental payments, education and age are statistically significant. The assumption that higher levels of managerial skills and experience can improve input use efficiency is sustained from the results. Specifically, this is supported by the education variable which is also positive and significant at the 1% level . Therefore, when farmers with higher education levels are compared with farmers qualified with basic education skills then the predicted Eco-Efficiency score increases by 0.26. This effect can also be related to the improved technical and also managerial skills of the farmers due to the years of experience as revealed by
pg. 19 a e s’ a e a a e as a s s e a model 11. Considering farm size, medium and small farms are indicated to be more eco-efficient than large farms, but only medium size is significant at the 1% level . That is medium size farms perform better than large farms and their Eco-Efficiency scores is 0.29 greater on average than large farms.
A farm being a member of the LEAF organisation was not found to be statistically significant (p-value>0.05). Environmental payments have a positive and statistically significant impact on the improvement of Eco-Efficiency ( , while on the other hand environmental costs have a negative impact on the improvement of Eco-Efficiency, although it is not statistically significant. The positive coefficient for Agri-Environmental payment indicates that an annual increase £1000 ease he Eco-Efficiency score by 0.0034.
Table 5: Determinants of Eco-Efficiency
Observed Coef. Std. Err. t-value
(Intercept)
-0.35 0.22 -1.61
Small size (dummy)
0.18 0.12 1.46
Medium size (dummy)
0.29*** 0.08 3.78 Agri-Environmental Payments (‘000) 3.4e-3* 0.00 2.34 Agri-Environmental Costs (‘000) -0.01 0.00 -1.49 Education (dummy) 0.26*** 0.08 3.33
Farmer Age (years)
0.01* 0.00 2.39
Leaf Membership (dummy)
-0.06 0.08 -0.68 Sigma 0.22*** 0.02 8.83 . es ‘***’ 0.001, ‘**’ 0.01, ‘*’ 0.05, ‘.’ 0.1, ‘ ’ 1 – No of Bootstraps 2000 Log likelihood=15.055 Wald (7) = 28.54, Prob > = 0.000 11
Other model specifications were estimated (e.g. including age and age2) and compared with the current model using likelihood ratio test. However, these did not outperform the model presented here.
pg. 20
4.
Discussion
According to the results, the farms in our sample are rather eco-inefficient. This means that there is a potential for a proportional reduction of environmental pressures in the EARBC area and therefore improvement of the Eco-Efficiency of the GCF. In terms of the intensified production technology, this reveals the potential for a reduction in the use of environmentally-damaging inputs for the farms in the benchmarking sample which thus improves their performance towards SI (i.e. farms can maintain the level of production but simultaneously reduce the negative impact to the ecosystem).
Previous research found a strong correlation between technical inefficiency and eco-inefficiency which is also confirmed here. Further, it has been found that the lack of managerial skills is associated with excess use of production inputs. Adopting and promoting best farming techniques was found to be associated with environmental performance improvement as found in previous research (G á e et al., 2003; Picazo-Tadeo et al., 2011; Picazo-Tadeo and Reig- a í e , 2006; 2007). Based on this evidence similar analysis could be used for the evaluation of farms in the context of the SI of agriculture.
One of the key characteristics of SI is the adoption of new innovative technologies that lead to more efficient production methods with less impact on the environment (Garnett and Godfray, 2012). Improvements in technical efficiency and Eco-Efficiency would promote the SI of agriculture. According to the results, the pressure specific Eco-Efficiency analysis suggests that farmers in the research sample could introduce new strategies and technologies to reduce wastage in energy, machinery fuels and crop protection in order to improve their environmental performance. Inputs slacks in the model can be used to measure the specific input excess in order to direct farm management towards the improvement of efficiency and SI. The greatest eco-inefficiency in the model is observed for crop protection (slack value = 63.75). The maximum attainable reduction of this pressure while maintaining value added stands at 77.24%. Integrated pest management practices could be used to control pests or their damage through a combination of available technologies and techniques (biological control, pest monitoring against economic thresholds, habitat manipulation, use of resistant varieties crops etc.). More generally, precision agriculture practices can help maximise the productivity of inputs whereby the use of a global positioning system matches input application and agronomic practices with soil attributes, seasonal conditions and crop requirements as they vary across a field. Practices such as controlled traffic farming can potentially improve the use of machinery fuel and reduce energy consumption. In relation to climate change, available technologies (such as drip or sprinkler irrigation, heat and drought tolerant varieties) can also be used for the reduction of environmental pressures generated by the intensified production technology. However, both the optimal weights and the input slacks have shown that farms in our sample are quite efficient with respect to the management of water resources and fertilisers.
From a SI policy perspective, these results suggest the need for the introduction of incentives that reduce the excess use of crop protection expenditure and encourage farmers to install renewable
pg. 21 energy technology. Moreover, policy agendas should seek to internalise the costs and benefits in the prices of production inputs and improve price mechanisms, for example for irrigation water, and aim to reduce soil erosion and land degradation, to provide regulatory systems and incentives to minimise negative externalities from agricultural production and processing. The techniques presented here have the potential to be used for desk based studies using a validated database such as the FBS (or equivalent datasets such as the FADN) in order to identify areas of intervention and improvement. Moreover, Barnes and Thomson (2014) stress that such secondary data can be a rich source for creating environmental, economic and social indicators to measure sustainable intensification.
As has been emphasised by Barnes and Thomson (2014), the choice of weights for the construction of a composite index for SI is a significant challenge. Here, by using DEA to assign the optimal weights to the environmental pressures that define the intensified production technology, we have avoided any bias resulting from subjective judgements. Furthermore, the optimal weights assigned to the farms on the frontier can be used as indicators of performance for farms that would like to develop a strategy to reduce environmental pressures and also to improve their economic output.
In addition, medium farms are more Eco-Efficiency than large sized farms. This is an interesting finding of our study since we would have expected that large farms in the sample would have performed better than smaller size farms in terms of managing inputs and improving efficiency12.
An important aspect that should also be considered in the discussion of the results is the extreme weather in the spring of 2011. Especially in East Anglia, the lack of rainfall had an adverse effect on farms. Parts of the study area have been declared as areas under high risk of future drought (Lincolnshire, Cambridgeshire, and Norwich) (Kendon et al., 2013). Therefore, the increased environmental pressure due to crop protection costs according to the results may be explained as the effort of farmers to mitigate yield losses due to drought conditions. Also, the subsequent wet harvesting conditions in 2011 for crops and the heavy machinery dependence for potatoes and sugar beet explain the excess use of machinery fuel and energy for drying crops, leading to higher than average costs in the season.
5.
Conclusions
This paper has presented an approach for the assessment of SI of farming systems based on the index of Eco-Efficiency. The common goals of the two concepts – improving the environmental performance of farming systems while simultaneously increasing production efficiency- allows the consideration of the index of Eco-Efficiency for the evaluation of the performance of farms towards SI. The use of a well-established Eco-Efficiency index provides policy makers and farmers with valuable information for the development of targets and strategies towards the improvement of the SI of agriculture.
pg. 22 This research builds on the approach introduced by Picazo-Tadeo et al. (2011) where DEA techniques are used to assess farming Eco-Efficiency at a farm level. The consideration of slack values in the DEA model has enabled levels of pressure specific Eco-Efficiency to be defined and also allowed assessment of the intensified production technology for each farm.
Previous research on SI of agriculture in the UK concluded that there is evidence of intensification of agricultural production (Barnes, 2012; Barnes and Thomson, 2014; Firbank et al., 2013). The slack based DEA model combined with the assessment of the environmental pressures generated at a farm level, allows policy makers and farmers to quantify the level of intensification and identify where there is potential to reduce negative impacts emerging from the intensified production technology. For instance, farmers can avoid unnecessary crop protection costs by 11.21% to reduce the intensified production technology and improve their performance towards SI. Also, the consideration of the importance of slack values in the total proportional reduction of environmental pressures and the measurement of pressure specific Eco-Efficiency could aid policy makers in designing targets and legislation focused on a specific environmental pressure, such as the development of policies to protect biodiversity through the controlled use of pesticides.
The main advantages of this approach are:
a) the flexibility of DEA techniques and the simplicity in the calculation of the index of Eco-Efficiency that enable policy makers to assess SI at a micro-farm-level;
b) the use of a representative and validated source of secondary data such as the FBS which could potentially be used to develop a persistent monitoring mechanism towards the SI of different farm systems in the UK; and
c) the identification of specific areas of further reduction in the environmental pressures generated by the intensified production technology.
The latter is important because it incorporates the environmental dimensions of agricultural production into the consideration of technical and economic efficiency and hence, it could provide a further insight into the design of policy options to enable the improvement of farms in terms of both environmental and economic efficiency. For example, according to the results, attention is required in the design of regulations and application of crop protection inputs and energy consumption at a farm level.
One limitation of this analysis is the lack of information on specific amounts of fertilisers and pesticides used at a farm level through the FBS. In this paper we have used the cost of each input as a proxy indicator of the pressure that is generated on the environment. Further research will consider the inclusion of this information in the DEA model. Moreover, a dynamic approach of Eco-Efficiency is required in order to evaluate the progress of farming systems towards SI. Kortelainen (2008) and Picazo-Tadeo et al. (2013) have developed a dynamic approach based on DEA methods to evaluate Efficiency over time. That will enable the consideration of other determinants to explain
Eco-pg. 23 Efficiency, such us technological change over time, the influence of current policy instruments and specific management practices.
Finally, we would like to emphasise that the design of agricultural policy which aims to achieve sustainable intensification is a difficult and complex procedure because a) it requires encouraging farmers to change their attitudes and behaviours such as adopting new management practices; and b) there are unpredictable external factors such as weather, disease and input costs variability. In terms of policy goals related to SI, a holistic approach to the topic should involve an integrated analysis of the impacts on biodiversity and land use, animal welfare, human nutrition and rural economies. Future policy relevant research in this area should consider these aspects and incorporate their impacts in the assessment of SI.
pg. 24
Acknowledgments
The authors wish to thank the University of Reading for funding this research and also the Agriculture, Food and Investigation Team of the University of Reading for providing technical assistance and guidance over the use of FBS data.
pg. 25
References
Aldanondo-Ochoa, Casasnovas-Oliva, and Arandia-Miura. (2014). Environmental efficiency and the impact
of regulation in dryland organic vine production. Land Use Policy, 36, 275-284. doi:
http://dx.doi.org/10.1016/j.landusepol.2013.08.010
Ali A., and Seiford L. M. (1993). The mathematical programming approach to efficiency analysis. In Fried H., Knox C. A. K. and Schmidt S. (Eds.), The measurement of productive efficiency: techniques and applications. Oxford University Press: Oxford University Press, 1993.
Ang, and Van Passel. (2010). The Sustainable Value approach: A clarifying and constructive comment.
Ecological Economics, 69(12), 2303-2306. doi: http://dx.doi.org/10.1016/j.ecolecon.2010.05.016
Ang, Van Passel, and Mathijs. (2011). An aggregate resource efficiency perspective on sustainability: A Sustainable Value application to the EU-15 countries. Ecological Economics, 71(0), 99-110. doi: http://dx.doi.org/10.1016/j.ecolecon.2011.08.008
Areal, Tiffin, and Balcombe. (2012). Provision of environmental output within a multi-output distance
function approach. Ecological Economics, 78(0), 47-54. doi:
http://dx.doi.org/10.1016/j.ecolecon.2012.03.011
Asmild, and Hougaard. (2006). Economic versus environmental improvement potentials of Danish pig
farms. Agricultural Economics, 35(2), 171-181. doi:
http://dx.doi.org/10.1111/j.1574-0862.2006.00150.x
Banker, Charnes, and Cooper. (1984). Some Models for Estimating Technical and Scale Inefficiencies in
Data Envelopment Analysis. Management Science, 30(9), 1078-1092. doi:
http://dx.doi.org/10.1287/mnsc.30.9.1078
Banker, and Natarajan. (2008). Evaluating Contextual Variables Affecting Productivity Using Data
Envelopment Analysis. Operations Research, 56(1), 48-58. doi:
http://dx.doi.org/10.1287/opre.1070.0460
Barnes. (2008). Technical efficiency estimates of Scottish agriculture: A note. Journal of Agricultural
Economics, 59(2), 370-376. doi: http://dx.doi.org/10.1111/j.1477-9552.2008.00156.x
Barnes. (2012). Sustainable Intensification in Scotland: A Discussion Document. Rural Policy Centre, SAC, Edinburgh (March).
Barnes, Moran, and Topp. (2009). The scope for regulatory incentives to encourage increased efficiency of
input use by farmers. Journal of Environmental Management, 90(2), 808-814. doi:
http://dx.doi.org/10.1016/j.jenvman.2008.01.017
Barnes, and Poole. (2012). Applying the concept of sustainable intensification to Scottish Agriculture. Paper presented at the AES 86th Annual Conference, April 16-18, 2012 Warwick University, Coventry, UK. http://purl.umn.edu/134710
Barnes, Schwarz, Keenleyside, Thomson, Waterhouse, Polakova, McCracken, and Stewart. (2011). Alternative payment approaches for non-economic farming systems delivering environmental public goods. Final Report for Scottish Natural Heritage, Scottish Environment Protection Agency, Countryside Council for Wales and Northern Ireland Environment Agency, May 2011. Scottish Agricultural College, Institute for European Environmental Policy, Johann Heinrich von Thünen Institut.
Barnes, and Thomson. (2014). Measuring progress towards sustainable intensification: How far can
secondary data go? Ecological Indicators, 36(0), 213-220. doi:
http://dx.doi.org/10.1016/j.ecolind.2013.07.001
Basset-Mens, Ledgard, and Boyes. (2009). Eco-efficiency of intensification scenarios for milk production in
New Zealand. Ecological Economics, 68(6), 1615-1625. doi:
http:/dx.doi.org/10.1016/j.ecolecon.2007.11.017
Bogetoft, and Otto. (2010). Benchmarking with DEA, SFA, and R (Vol. 157). New York: Springer.
Buckley, and Carney. (2013). The potential to reduce the risk of diffuse pollution from agriculture while improving economic performance at farm level. Environmental Science & Policy, 25(0), 118-126.
doi: http://dx.doi.org/10.1016/j.envsci.2012.10.002
Charlton, Bailey, and Arnell. (2010). Water for Agriculture - Implications for Future Policy and Practice: Reviewing and modelling the impacts of climate change in future food production: Royal Agricultural Society of England.
Charnes, Cooper, Golany, Seiford, and Stutz. (1985). Foundations of data envelopment analysis for
Pareto-Koopmans efficient empirical production functions. Journal of Econometrics, 30(1–2), 91-107. doi:
pg. 26
Charnes, Cooper, and Rhodes. (1978). Measuring the efficiency of decision making units. European Journal
of Operational Research, 2(6), 429-444. doi: http://dx.doi.org/10.1016/0377-2217(78)90138-8
Charnes, Cooper, and Rhodes. (1979). Measuring the Efficiency of Decision-Making Units. European Journal
of Operational Research, 3(4), 339-339. doi: http:/dx.doi.org/10.1016/0377-2217(79)90229-7
Charnes, Cooper, and Rhodes. (1981). Evaluating Program and Managerial Efficiency - an Application of
Data Envelopment Analysis to Program Follow Through. Management Science, 27(6), 668-697. doi:
http://dx.doi.org/10.1016/0377-2217(79)90229-7
Cooper, Seiford L. M, and Tone K. (2006). Data Envelopment Analysis: A Comprehensive Text with Models, Applications, References and DEA-Solver Software: Springer.
D’Haese, Speelman, Alary, Tillard, and D’Haese. (2009). Efficiency in milk production on Reunion Island:
Dealing with land scarcity. Journal of Dairy Science, 92(8), 3676-3683. doi:
http://dx.doi.org/10.3168/jds.2008-1874
de Jonge. (2004). Eco-efficiency improvement of a crop protection product: the perspective of the crop
protection industry. Crop Protection, 23(12), 1177-1186. doi:
http://dx.doi.org/10.1016/j.cropro.2004.05.002
de Koeijer, Wossink, Struik, and Renkema. (2002). Measuring agricultural sustainability in terms of
efficiency: the case of Dutch sugar beet growers. Journal of Environmental Management, 66(1), 9-17.
doi: http://dx.doi.org/10.1006/jema.2002.0578
European Environment Agency (EEA) (2010). The European environment — state and outlook 2010: synthesis. Luxembourg: Publications Office of the European Union, 2010.
FAO. (2011). Save and Grow: A policymaker's guide to the sustainable intensification of smallholder crop
production: Food and Agriculture Organization of the United Nations, Rome.
Farm Business Survey. (2011). Instructions for collecting the data and completing the farm return: Department for Environment Food & Rural Affairs, Agricultural Market Economics, with Rural Business Research
Farrell. (1957). The Measurement of Productive Efficiency. Journal of the Royal Statistical Society. Series A
(General), 120, 253-290. doi: http://dx.doi.org/10.2307/2343100
Figge, and Hahn. (2004). Sustainable Value Added—measuring corporate contributions to sustainability
beyond eco-efficiency. Ecological Economics, 48(2), 173-187. doi:
http://dx.doi.org/10.1016/j.ecolecon.2003.08.005
Firbank, Elliott, Drake, Cao, and Gooday. (2013). Evidence of sustainable intensification among British
farms. Agriculture Ecosystems & Environment, 173, 58-65. doi:
http://dx.doi.org/10.1016/j.agee.2013.04.010
Firbank, Petit, Smart, Blain, and Fuller. (2008). Assessing the impacts of agricultural intensification on biodiversity: a British perspective. Philos Trans R Soc Lond B Biol Sci, 363(1492), 777-787. doi: http://dx.doi.org/10.1098/rstb.2007.2183
Foresight Report. (2011). Foresight. The Future of Food and Farming. Final project report: The Government Office for Science, London.
Garnett, Appleby, Balmford, Bateman, Benton, Bloomer, Burlingame, Dawkins, Dolan, Fraser, Herrero, Hoffmann, Smith, Thornton, Toulmin, Vermeulen, and Godfray. (2013). Agriculture. Sustainable
intensification in agriculture: premises and policies. Science, 341(6141), 33-34. doi:
http://dx.doi.org/10.1126/science.1234485
Garnett, and Godfray. (2012). Sustainable intensification in agriculture. Navigating a course through competing food system priorities: Food Climate Research Network and the Oxford Martin Programme on the Future of Food, University of Oxford, UK.
Gerdessen, and Pascucci. (2013). Data Envelopment Analysis of sustainability indicators of European
agricultural systems at regional level. Agricultural Systems, 118(0), 78-90. doi:
http://dx.doi.org/10.1016/j.agsy.2013.03.004
Gomez-Limon, Picazo-Tadeo, and Reig-Martínez. (2012). Eco-efficiency assessment of olive farms in Andalusia. Land Use Policy, 29(2), 395-406. doi: http://dx.doi.org/10.1016/j.landusepol.2011.08.004 Gomez-Limon, and Riesgo. (2009). Alternative approaches to the construction of a composite indicator of agricultural sustainability: An application to irrigated agriculture in the Duero basin in Spain.
[Research Support, Non-U.S. Gov't]. Journal of Environmental Management, 90(11), 3345-3362. doi:
http://dx.doi.org/10.1016/j.jenvman.2009.05.023
Gomez-Limon, and Sanchez-Fernandez. (2010). Empirical evaluation of agricultural sustainability using
composite indicators. Ecological Economics, 69(5), 1062-1075. doi: