Is the European Union Emissions Trading Scheme (EU ETS)
Informationally Efficient? Evidence from Momentum-Based
Trading Strategies
Jarrod Crossland
a, Bin Li
b*, Eduardo Roca
ba
Origin Energy, Milton, Queensland 4064, Australia b
Griffith Business School, Griffith University, Nathan, Queensland 4111, Australia
Abstract
Since 2005, the European Union Emissions Trading Scheme (EU ETS) has seen a rapid growth in trading volume activity, with 1.44 billion tons of CO2 traded in 2007. The total value of these trading transactions was €24.1 billion in 2007, confirming the EU ETS as the largest emissions trading system by transaction value. In this paper, we test whether this market exhibits predictability of prices in terms of momentum (i.e., positive/negative changes continuing) and overreaction (i.e., positive/negative changes reversing). We test whether momentum and overreaction exist in the carbon price, and if they do, whether they result in profitable trading strategies. We document a robust short-term momentum and medium-term overreaction within the EU ETS. We also find statistically significant returns in a number of strategies tested. The strategies employed provide excess returns that remain achievable in a practical sense even after transaction costs have been taken into consideration. Our results therefore provide evidence that the EU ETS is not informationally efficient.
Keywords: Emissions Trading Scheme, market efficiency, time-series momentum, overreaction
JEL Classifications: G14, Q56
_____________________________________________
* Corresponding author: Department of Accounting, Finance and Economics, Griffith Business School, Griffith University, Queensland 4111, Australia. E-mail: b.li@griffith.edu.au; Tel: +61 7 3735 7117; Fax: +61 7 3735 3719.Bin Li is grateful to Griffith Business School for financial support under the 2012 GBS Internal Research Grant.
Is the European Union Emissions Trading Scheme (EU ETS)
Informationally Efficient? Evidence from Momentum-Based
Trading Strategies
1. Introduction
In this paper, we test whether the European Union Emissions Trading Scheme (EU ETS) is informationally efficient. The issue of market efficiency has very important implications for investors in the carbon market. If markets are not efficient, it opens a door for investors in this market to achieve abnormal returns. According to Fama (1970), a market is efficient, at least in the weak form, if prices do not exhibit predictability. Through an examination of momentum, we investigate whether or not prices in the EU ETS exhibit predictability. First described by De Bondt and Thaler (1985), “overreaction” refers to the circumstance where investors overreact to new information and drive asset prices beyond their fundamentals before they reverse predictably through time. Researchers advocate a strategy of buying past losers and selling past winners to profit from this behavior. Momentum, on the other hand, describes the apparent behavior of asset returns continuing in their current direction (either positive or negative). Momentum strategies advocate buying past winners and selling past losers to generate abnormal profits. Momentum and overreaction indicate predictability of prices based on past information which is a violation of the tenet of one of the most important theoretical foundations in financial economics – the efficient market hypothesis (EMH).
Since Jegadeesh and Titman (1993), many studies have found momentum to exist and persist in many different asset classes and markets including foreign equities, currencies and commodities (Asness et al., 2008; Bianchi et al., 2005; Grinblatt and Moskowitz, 2004). In this paper, we aim to investigate whether these two phenomena also exist in the carbon market – a new market that is relatively unique compared to other asset markets. We examine whether profitable trading strategies based on momentum and overreaction can be identified in this market. Though there are studies relating to market efficiency in the carbon market, to the best of our knowledge, our paper is the first to investigate momentum and overreaction within the market.
We undertake our investigation of momentum and overreaction with respect to the EU ETS. The EU ETS is the most mature CO2 emission-trading market and largest market for
emissions trading, accounting for more than 90% of the world’s transaction volume and value for CO2 allowances (Capoor and Ambrosi, 2009). However, it is only in its 8th year having commenced only on January 1st, 2005 with all 15 then members of the European Union participating. The first phase (Phase I) of the EU ETS – regarded as a trial period – ran from 2005 to 2007 covering more than 12,000 installations responsible for approximately 40% of the European Union’s CO2 emissions. The second phase (Phase II) of the EU ETS covers the period from the beginning of 2008 to the end of 2012 with all 27 current member states participating.
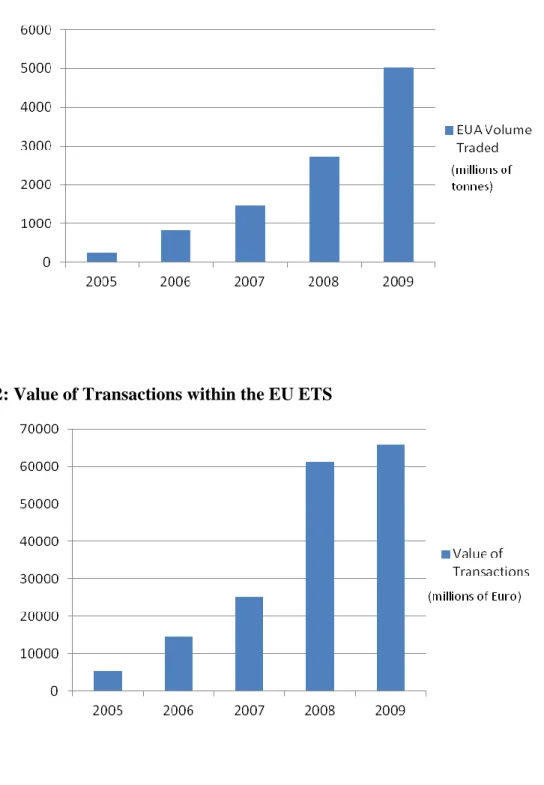
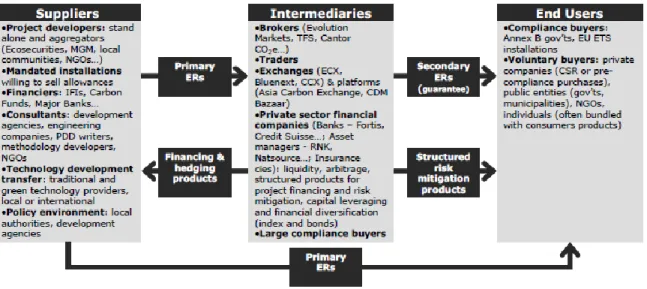
Since the commencement of the EU ETS in 2005, the market has seen dramatic growth in both the volume of EUA permits traded and the value of transactions. Table 1 shows the evolution and growth of this emerging market, where the volume and value of transactions have increased greater than ten times from 2005 to 2009, although the growth from 2008 to 2009, corresponding to the GFC period, was relatively flat. This dramatic growth in the market is further illustrated in Figures 1 and 2.
[Insert Table 1 about here] [Insert Figure 1 about here] [Insert Figure 2 about here]
Our paper not only adds theoretical insight into the concepts of momentum and overreaction, but also provides practical strategies that investors can implement when entering the EU carbon markets. Research into existing trading systems will advance essential experience and understanding of the dynamics and mechanisms involved in this new and emerging market.
The remainder of our paper is organized as follows. Section 2 introduces the institutional background, explaining the formation and function of the EU ETS. Section 3 reviews relevant literature regarding emissions trading and the efficient market hypothesis, specifically, momentum and overreaction. Section 4 develops testable hypotheses, and presents our research methodologies and sample data. Section 5 provides the empirical results while Section 6 concludes.
2. Institutional Background
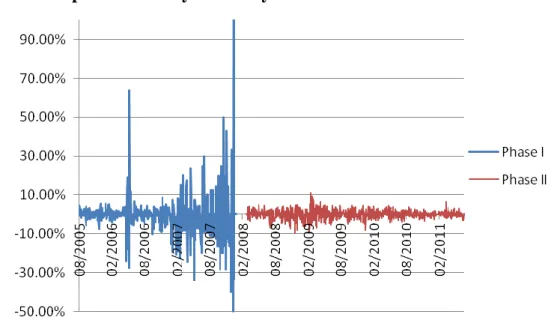
One of the primary functions of the EU ETS is to facilitate the interaction between four main participants, for the purpose of efficiently connecting the suppliers of carbon credits EU Emission Allowances (EUAs), Certified Emission Reductions (CERs) and
Emission Reduction Units (ERUs) with buyers. Figure 3 illustrates the relationship between these groups. The market participants are classified as suppliers, intermediaries, end users and regulators. The intermediaries in this market, consisting of brokers, traders and organized exchanges, work very similarly to those within other asset markets facilitating the transfer of emission credits between suppliers and buyers. The market as a whole operates within a legal framework, under the supervision of several regulatory bodies such as the UNFCCC, the EU Commission, and various European financial regulators.
[Insert Figure 3 about here]
A major feature of the EU ETS is the importance of organized exchanges. Trading on organized exchanges first appeared on the Nord Pool Exchange in February 2005, and has grown rapidly with the opening of exchanges in Leipzig, London, Paris, and Vienna (Ellerman and Joskow, 2008). In comparison to U.S. allowance markets where virtually all trades are conducted in over-the-counter (OTC) markets, Ellerman and Joskow (2008) illustrate that the EU ETS now boasts one-third of all trades taking place on organized exchanges. They contend that the appearance and continuance of these exchanges provides evidence that the law of one price emerged early in the EU ETS, because exchanges could not continue to operate if there were no convergence of prices. Bataller, Tornero, and Micó (2007) provide further evidence of prices converging very closely across all marketplaces, with cross-correlations at 0.943 or higher.
The EU ETS is a cap-and-trade system which is influenced by policy decisions (through regulators) and external economic variables. Regulators decide the total amount of EUAs available, whether they are auctioned or allocated, the allowable usage of CERs and ERUs, the penalties for non-compliance and the extent of banking and borrowing of permits between each year and phase (Rickels et al., 2010). Demand for EUAs, on the other hand, is driven primarily by the European Union’s macro-economic factors, energy prices – particularly electricity, natural gas and oil prices – and weather events (Christiansen et al., 2005; Convery and Redmond, 2007; Kanen, 2006; Springer, 2003).
During Phases I and II, the National Allocation Plans (NAP) were used to determine the EU ETS supply through the allocation of EUAs, and also to decide the amount of CERs and ERUs that could be used for compliance. The ability for installations to bank and borrow EUAs between periods can significantly influence supply. During Phase I, installations were able to borrow permits from future allocations to meet current shortfalls or to bank current excess permits for use in following years. However, this banking and borrowing was limited to Phase I allocations only, and could not be carried over into Phase II. From Phase II
onwards unlimited banking and borrowing is allowed (Rickels et al., 2010). This prohibition on banking permits between phases is said to be one of the causes of extreme price volatility in Phase I and which ultimately led to a collapse in prices to near zero (Alberola and Chevallier, 2009; Convery and Redmond, 2007). Daskalakis, Psychoyios, and Markellos (2009) provide evidence that the prohibition on banking EUAs between Phase I and II had a significant impact on derivative pricings in their study of the Powernext, the Nord Pool and the European Climate Exchange (ECX). They argue that the prohibition on banking permits between phases resulted in additional uncertainty and hedging costs for market participants. This additional uncertainty runs counter to one of the primary goals of emissions trading; that emission reductions are achieved at the lowest possible cost.
In April 2006, it became clear that the EU ETS had been over-supplied resulting in a surplus of EUAs (Austin, 2007). As a consequence, the EUA spot price fell from around €30 a ton to €11 in a week before collapsing to near zero during 2007. Figure 4 illustrates this collapse in price beginning in April 2006. While the reasons for the surplus are open to debate, Austin (2007) contends that the prime culprit was the historical emissions data submitted by each country under their NAP. Under the NAP for both Phases I and II, member states determined the total amount of permits to be issued to them, and how these would be allocated to the installations concerned (subject to EU Commission acceptance). However, this approach was argued to have created significant differences in the allocation rules within the region, given the incentive for member states to favor their own industries by overstating historical emissions (EUROPA, 2008). In response to these complexities it was announced that NAPs will no longer be used for Phase III (2013-2020) onwards, and allowances will be determined and allocated centrally by the European Commission (International Energy Agency, 2008). It can also be seen that there was a significant drop in price during the 2008 to 2009 period when the Global Financial Crisis (GFC) occurred.
[Insert Figure 4 about here]
3. Related Literature
3.1 Literature on Carbon Markets
Due to its relatively recent introduction (in 2005) and the resulting short sample periods, research on the carbon market to date has mainly focused on the operating mechanisms and the economic effects of the EU ETS and dealt with the structure and function of the market, its operating mechanisms and its economic effect on energy-intensive
industries (Zhang and Wei, 2010). The literature examining the EUA price from a risk management or econometric perspective, according to Benz and Trück (2009), is ‘‘rather sparse”.
Most of the econometric research into the EU ETS has centered on the relationships between the EUA price and related economic variables. These studies attempt to understand the fundamental drivers influencing the carbon price. A key driver of the EUA price identified on the demand side is the cost of energy prices (oil, natural gas and coal) and especially the electricity price. Nevertheless, Bunn and Fezzi (2008) illustrate that these energy prices and the EUA price can mutually influence each other. Convery and Redmond (2007) identify increases in the oil and natural gas price as significant contributors to increases in the EUA price. This relationship also works in reverse, as higher EUA prices can lead power generators to switch from coal to natural gas installations (Alberola et al., 2008). This in turn leads to an increase in demand and price for natural gas. This relationship is determined by the dispatch order power companies employ to minimize their costs.
Power companies switch between different generating fuels (oil, natural gas or coal) depending on the costs of those fuels and the current power price. This ability for power generators to switch their dispatch order is considered one of the crucial steps in minimizing short-run carbon emissions (Rickels et al., 2010). By incorporating the price of EUAs into their cost structure, power generators are given the economic incentive to switch from coal to less CO2 intensive fuels, as natural gas and alternative energy become relatively more competitive. Changing from coal to natural gas installations reduces a power generator’s carbon emissions by 40 to 60% per Megawatt-hour (MWh) (Rickels et al., 2010).
Several critical studies have also identified weather events and temperature as significant factors affecting the price of carbon, through their effect on electricity prices. The effect is described as non-linear (U-shaped), as temperatures below a certain threshold lead to an increase in electricity and heating demands, while temperatures above a certain threshold also lead to an increase in electricity demand for cooling purposes (Alberola et al., 2008). Both these events can result in greater emissions and therefore a greater demand and price for EUAs (Rickels et al., 2010). The effect of weather events and temperature on the electricity price has been well documented in numerous studies (see e.g., Considine, 2000; De Cian et al., 2007; Mideksa and Kallbekken, 2010). Considine’s (2000) study shows how short-run weather fluctuations affect monthly energy demands, identifying additional heating-degree days as having a greater impact on energy consumption and emissions than cooling-degree days.
Alberola, Chevallier, and Chèze (2008) take this analysis further by showing evidence that EUA price changes respond more to unanticipated temperature changes than to the temperatures themselves during extreme weather conditions. Again they find that extremely cold events have a greater impact on energy consumption and emissions than extremely hot events. Weather events are also identified as having an increasing influence on the EUA price, through the effect on carbon-free renewable energy. Rickels, Görlich, and Oberst (2010) provide evidence that unusually high wind speeds in Germany are associated with a declining EUA price, as higher amounts of wind power enter the grid. In contrast, unusually low reservoir levels in Spain and the Nordic countries are associated with an increasing EUA price as lower amounts of hydropower are available to the grid.
Recently, researchers examined the efficiency of the EU ETS market from different perspectives. For example, Feng, Zou and Wei (2011) use random walk models and methods derived from physics and mechanical research, such as chaos theory to examine the nonlinear dynamic behavior of the carbon price. Feng, Wei and Wang (2012) use extreme value theory and value at risk to study the risk behavior of the carbon price and find that the carbon market exhibits higher downside risk than upside risk. On the other hand, Palao and Pado (2012) study price clustering in the carbon futures markets. They find the carbon price is more like to end in digits 0 and 5, than any other digits.
3.2 Literature on Momentum and Overreaction
The above studies illustrate some of the fundamental drivers and dynamics of short-term changes within the EUA price. Here we extend the carbon market literature with an investigation as to whether or not momentum and overreaction on the EUA price exist, and correspondingly, whether profitable strategies can be identified. As stated earlier, momentum and overreaction represent a violation of the EMH. The EMH, formalized by Fama (1970), forms one of the foundations of finance theory. It provides a theoretical framework for understanding whether asset prices ‘‘fully reflect” all available information. An efficient market implies non-predictability of prices. Following his comprehensive and critical review of the evidence and literature on the behavior of markets, Fama (1970) concludes that ‘‘with but a few exceptions, the efficient markets model stands up well”. However, this confidence now appears premature, because as the empirical research develops it has begun to increasingly document anomalies and violations of the EMH. The observation of momentum and overreaction in asset prices is one such anomaly.
The concept of momentum and overreaction in asset prices has been consistently identified in the academic literature. In a general sense, momentum and overreaction in asset markets refer to the idea that the future price of an asset can be predicted using its historical price information. One of the earliest studies that identify this market behavior is that of De Bondt and Thaler (1985), which highlights a phenomenon in the stock market where investors overreact to negative information and drive an asset’s price excessively in a negative direction. As the market becomes aware of this overreaction, the price is corrected over the coming months. De Bondt and Thaler find that this correction is predictable and illustrate a strategy that profits simply from exploiting the publicly available historical pricing behavior. The strategy they outline is referred to as a ‘‘contrarian strategy”, whereby investors seek to profit by selling past over-performers and buying past under-performers.
As Miffre and Rallis (2007) describe, contrarian strategies tactically allocate wealth toward long-term underpriced ‘‘losers” and away from long-term overpriced ‘‘winners”. The importance of De Bondt and Thaler’s discovery is that it provides some of the earliest evidence of a violation of the EMH. By illustrating a profitable trading strategy that relies simply on historical pricing information, De Bondt and Thaler (1985) provide direct evidence of ‘‘weak-form” market inefficiency. While De Bondt and Thaler have identified profitable contrarian strategies within the stock markets over longer-term horizons, this behavior has not been found to be as pervasive as momentum.
Momentum in asset prices has proven to be one of the most persistent challenges to the EMH. Momentum in stock prices, first identified by Jegadeesh and Titman (1993), poses an arguably unexplainable phenomenon to efficient market theorists. Momentum describes the observable and sustained drift of asset prices in a particular direction (either positive or negative) over time. Jegadeesh and Titman (1993) identify profitable trading strategies yielding mean monthly profit of 0.32–1.49% simply by exploiting historical pricing information. The momentum effect observed in many repeated studies (Chan et al., 1996; Hong et al., 2000; Jegadeesh and Titman, 2001; Rouwenhorst, 1998) has drastic implications for the weak-form efficiency hypothesis as it shows that current stock prices do not fully reflect historical pricing information.
The persistence of momentum has led researchers to consider human behavioral biases and their effects on stock market prices (Shiller, 2002; Subrahmanyam, 2007). Some have suggested that momentum profits persist simply because they are in fact unachievable due to transaction cost constraints (Grundy and Martin, 2001; Lesmond et al., 2004). While
the cause of momentum is still under debate, it remains, however, a persistent anomaly in violation of weak-form market efficiency.
Researchers in behavioral finance have sought to offer their own models to explain the existence of momentum and overreaction. An important contribution to the discussion was provided by a behavioral model by Hong and Stein (1999). Hong and Stein explain momentum and overreaction in a unified account that does not rely on the psychology of market participants. They rather describe these behaviors as a direct result of interactions between two types of heterogonous agents. The first – ‘‘newswatchers” – adjust prices slowly as private information diffuses slowly throughout the market, leading to underreaction and momentum. The second group is the ‘‘momentum traders”, who seek to profit from the underreaction by accelerating price movements toward fundamentals. This has the ‘‘perverse outcome” of creating an eventual overreaction to any new information. As the overreaction is perceived, it too is corrected over time.
The study of momentum has continually developed with the identification of similar behavior in markets outside the US stock exchange (Bianchi et al., 2005; Miffre and Rallis, 2007; Novy-Marx, 2012; Okunev and White, 2003). The evidence of momentum in foreign currency markets provided by Bianchi et al. (2005) and Okunev and White (2003) indicate that momentum cannot be considered an anomaly of the stock market only, but rather a more consistent behavior observable in many markets. Miffre and Rallis (2007) show evidence of momentum in the commodities market, which provides an important precedent as CO2 emissions trading are considered a commodity. Miffre and Rallis (2007) describe 13 profitable momentum strategies of 1-12 months that cover a range of different commodities; however, they do not include CO2 or emissions trading in their analysis.
The literature on momentum typically refers to the continued relative performance of securities in the cross-section. These momentum strategies identify securities that have outperformed their peers over the look-back formation period (3‒12 months) and find a portfolio of these high performers continue to outperform their peers over the next month. An interesting development in the study of momentum is a recent documentation of ‘‘time-series momentum” by Moskowitz, Ooi, and Pedersen (2012). Moskowitz et al. (2012) identify profitable trading strategies that rely solely on the security’s own past returns. The strategies outlined are found to be profitable across asset classes and markets, including currencies, commodities and sovereign bonds over 25 years of data. While Moskowitz et al. (2012) agree that time-series momentum is related to the literature on autocorrelation, they illustrate that autocorrelation predictability is typically limited by the formation period and holding period
being held constant. By allowing flexibility in the holding period versus the formation period, significant predictability (and therefore profitability) is uncovered. These momentum strategies remain analogous with those created by Jegadeesh and Titman (1993), where information on returns for the previous J-months provides a signal on whether to long or short a security and hold that position for the following K-months.
It is important to consider the impacts of trading costs on the profits of momentum strategies. One of the strongest critiques of momentum strategies comes from Lesmond et al. (2004), who investigate the full effect of trading-costs on momentum profits. A critical element of success in trading strategies is that profits must exceed the cost of trading. This is particularly relevant to momentum strategies as they require high-levels of portfolio turnover; averaging 84.8% every six-months. However one of the fundamental flaws in Jegadeesh and Titman’s (1993) work is their assumption of a transaction cost estimated at a ‘‘conservative” 0.5%. As Lesmond et al. (2004) illustrate, this considerably underestimates the explicit cost of transacting a momentum strategy, as well as disregards implicit market costs.
This underestimation of transaction cost is also a symptom of Jegadeesh and Titman’s (1993) oversight of implicit market costs, such as the bid-ask spread, taxes, holding cost, and short-sale constraints. While Lesmond et al. (2004) concede that it is empirically challenging to capture all the components of trading-costs, they do however point to a volume of literature on alternative cost-estimation techniques (Lee and Ready, 1991; Lesmond et al., 1999; Roll, 1984; Stoll and Whaley, 1983). To support their claim of underestimation of transaction costs, Lesmond et al. (2004) employ a comprehensive trading-cost estimate based on limited dependant variable procedures. This trading-cost measure is described as ‘‘implicitly including not only the spread component but also the implied commissions, immediacy costs, short sale costs, and at least some of the price impact costs” (Lesmond et al., 2004). When these additional costs are considered and included in the trading-cost estimate, it has a dramatic effect on the perceived profitability of momentum strategies.
Lesmond et al. (2004) report the mean profit of a 6-month momentum strategy at 7.826% before trading costs; however, after accounting for trading-costs, profit is only 0.128%. This implies a mean trading-cost of 7.698%, which is significantly greater than the transaction costs assumed by Jegadeesh and Titman (1993). Following the analysis of the various trading-cost estimates and their effect of momentum returns, Lesmond et al. (2004) conclude that the profits of momentum investing strategies do not exceed trading costs. While the analysis by Lesmond et al. (2004) is often cited as a significant flaw in the Jegadeesh and Titman (1993) findings, his study itself is not short of criticism. Miffre and Rallis (2007)
disputes Lesmond et al. (2004) transaction cost estimate as ‘‘unlikely”, while Novy-Marx (2012) claims his estimates as ‘‘significantly overstated”. Despite the evidence against the profitability of momentum strategies due to trading costs, anecdotal and empirical evidence continues to show fund managers regularly employ these strategies (Chen et al., 2000; Grinblatt et al., 1995; Menkhoff and Schmidt, 2005). The implication of these studies is that while trading costs may be significant, momentum strategies remain profitable.
Miffre and Rallis (2007) highlight an important gap in the current momentum research with their omission of emissions trading. To the best of our knowledge there is no available research investigating the potential for momentum or overreaction within emissions-trading markets. This glaring gap in the research can be considered a symptom of the carbon market’s relatively recent appearance on the world stage. The world’s largest emissions trading program, the EU ETS, has only been in existence since 2005 with its first 3 years constituting a trial period (Phase I) which was of considerable volatility. While this market is still very new, it cannot be understated how important it is to continue research to provide a greater understanding of the market’s dynamics. It is in this direction where we seek to identify whether the EU ETS, like many other markets, contains a momentum or overreaction effect.
4. Hypotheses, Research Methodology and Data
4.1 Hypotheses
In this study, we focus our investigation on time series momentum and overreaction. In momentum, asset prices continue in their current direction (positive returns lead to positive returns) while in overreaction, the prices reverse (positive returns lead to negative returns). Given the persistence of momentum within various asset markets around the world, as documented in the existing literature, we hypothesize that – H1: momentum exists in the EU-ETS and profitable trading strategies based on this also exist. On the other hand, given the short history of the EU ETS and its relative volatility in price movements (shown in Figure 4), it is plausible that a reversal effect may be evident within the EUA price as the market corrects excessive price movements. Therefore, we hypothesize that – H2: overreaction also exists in the EU-ETS.
4.2 Methodology
We seek to replicate the time-series momentum and overreaction study by Moskowitz et al. (2012), in order to identify whether profitable strategies are observable within the
pricing data of the EU ETS. Momentum can be described as the continuation of asset returns in either a positive or negative direction over a period of time. Momentum strategies seek to profit through buying assets that have outperformed in the past (winners), and selling assets that have underperformed (losers). Overreaction strategies, on the other hand, are contrarian strategies in this regard running polar to momentum strategies, which involve the selling of past winners and buying of past losers.
The strategies employed in our study use the daily EUA excess return data over the previous J = 1, 3, 6, 9, 12 and 15 months (‘‘look-back period”). In keeping with the literature, the risk-free rate is incorporated into the time-series to provide daily excess returns. To investigate the profitability of momentum in the EU ETS, each strategy will assess whether the excess return of the EUA over the previous J-months is positive (or negative) and long (or short) the position, holding the position for the following K = 1, 3, 6, 9 or 12 months (‘‘holding period”). Jegadeesh and Titman (1993) refer to these as the ‘‘J-month/K-month” strategies, where the EUA excess returns are recorded for the previous J-months and then the asset is held for the following K-months.
It is important to note that Jegadeesh and Titman’s (1993) study uses cross-sectional data, while our study more closely resembles the analysis done by Moskowitz et al. (2012), with the use of time-series data. Given the idiosyncratic nature of the EU ETS and its relatively short sample period, the time-series analysis by Moskowitz et al. (2012) is selected as the most appropriate method.
To develop the strategies, we follow Moskowitz et al. (2012) by indexing the daily excess returns over the relevant J-month look-back period. This indexed series can then be used to determine whether the EUA return was positive or negative over any period. If the indexed excess return is positive, our strategy is to buy and hold the EUA at the current price for the following K-months. Similarly if the indexed excess return is negative, our strategy is to short the EUA at the current price for the following K-months. Similarly, in identifying possible contrarian profits, the strategy requires an opposite one in which we short the EUA if the past indexed return was positive, and long the EUA if the past returns were negative. Both the momentum and contrarian analysis provide a total of 30 strategies each, comprising of the various iterations of the J = 1, 3, 6, 9, 12 or 15 months and K = 1, 3, 6, 9 or 12 months strategies.
The impact of transaction costs, as shown in the literature, is significant in the study of momentum (Lesmond et al., 2004). In order to ensure the scientific rigor of the results, transaction costs have also been included in our analysis. Our study includes both zero
trading cost strategies to identify the theoretical profits achievable, and secondly includes market stated transaction costs to identify if these profits are achievable in practical terms.
Although fixed transaction costs are accounted for in the analysis, brokerage fees or slippage costs are not considered due to lack of relevant data. This can be expected to produce some upward bias in the profitability results. The transaction costs are quoted at 0.008 € per EUA on the BlueNext Exchange (‘‘BlueNext Spot Fees”, 2011) and 0.005€ per EUA on the European Energy Exchange (EEX) (European Energy Exchange Fees, 2011).
Lastly, in order to overcome the fact that short positions cannot be made directly in the EU ETS spot market, we assume that short positions are possible via ‘‘over-the-counter” (OTC) lending of EUAs by carbon funds, emission emitters or other holders of long EUA positions (Daskalakis and Markellos, 2008). However without data on short-sale borrowing costs, these have been excluded from the analysis. An alternative to shorting borrowed EUA permits is effectively available to individual installations, which are able to borrow EUAs from their next year’s allocation (Ellerman and Joskow, 2008). In this instance, short-sale borrowing costs would not be relevant.
We employ a multi-factor model to measure the profitability of each strategy after accounting for risk and passive exposure to major asset-classes1:
,
1( , ,) 2( , ,) 3( , ,)
TS J K
t M t f t B t f t C t f t t
R R R R R R R (1)
where RtTS J K , is the excess return on each strategy (Momentum or Contrarian) with J-months look-back period and K-months holding period. RM t, ,RB t, and RC t, are the returns on the MSCI World Index, the Barclays Euro Aggregate Bond Index and the Goldman Sachs Commodity Index, respectively. Rf t, is the risk-free rate proxied with the LIBOR 3-month middle rate, and εt is an error term. These returns are retrieved from DataStream.
This model proposed by Moskowitz et al. (2012) controls for passive exposure to the three major asset classes: the stock market MKT, the bond market BOND, and the commodity market GSCI.
Once these risk factors have been taken into consideration, we are left with the intercept alpha (α). This intercept describes the active return on the strategy. Alpha illustrates the return in excess of the compensation for risk. This indicates whether the returns of the strategy are due to compensation for exposure to the risk factors, or if they are indeed due to
1 The model follows Moskowitz et al. (2012). However we delete the Fama-French size factor (SMB), value
factor (HML) and cross-sectional momentum factor (UMD) in our analysis as these factors are shown to be insignificant in most regressions.
the strategy itself. Positive and statistically significant alphas, illustrate the robustness of the strategies profits.
4.3 Data
Our data consist of the daily spot-prices for the EUA for Phase II of the EU ETS. The daily spot-price data are from the BlueNext Exchange. BlueNext is a major exchange for the EU ETS covering approximately 75% of the market (Montagnoli and de Vries, 2010). The daily spot-price used is the BlueNext EUA Spot Index for EUAs, established in the closing three hours on the Spot Market of BlueNext every trading day.
The BlueNext Exchange, together with European Climate Exchange (ECX), the Nord Pool, and the EEX represent the dominant EUA marketplaces. The use of the BlueNext EUA Spot Index over any other exchange should not expose the results to any inconsistencies in the overall market for EUAs, as the prices are found to develop very closely across all marketplaces (Bataller et al., 2007).
Daily futures prices from the BlueNext Exchange for Phase II were initially considered in this analysis, in order to keep consistency with the literature (Moskowitz et al., 2012). However due to a significantly shorter sample period, daily spot prices are preferred. The use of spot prices over daily futures is not expected to result in any discrepancies in the results due to the high cross-correlation between spot and futures prices. Bataller et al. (2007) report the cross-correlation between the markets for EUA futures and spot prices at 0.943 or higher.
The data on Phase II come from DataStream, with the sample covering the period February 26, 2008 to June 22, 2011. These data provide a time-series of the spot prices in Phase I, represented by 867 daily observations. Given the relatively short sample period at 3.5 years (Phase II), daily data is considered the only realistic frequency for our econometric approach. Oberndorfer (2009), faced with the same issue of relatively short sample periods, acknowledges that lower frequency data (i.e. weekly or monthly data) is generally preferred over daily data in order to minimize errors-in-variables problems. However, the use of weekly or monthly data would provide too few observations to conduct a meaningful time-series analysis.
While Phase II remains the focus of our study, the data from Phase I was initially considered in the analysis. However, it is important to be aware that Phase I of the EU ETS is considered a trial period and was thus subject to several difficulties. Firstly, the EUA spot price saw a significant slump in April 2006, falling 54% over four days before collapsing to
near zero during 2007 (Ellerman and Buchner, 2008). While several reasons are cited in the literature review to explain the collapse in Phase I prices, Zhang and Wei (2010) contend that it was an over-allocation of emission permits as well as the inability to bank and carry these permits into Phase II, that lead to the significant downward pressure on price.
As such these issues resulted in anomalous Phase I data, with wild swings in volatility, making it difficult to draw concrete inferences from those results. While the Phase I prices were included in the initial analysis of this study, they have been excluded due to the issues mentioned above. We view that the more mature Phase II period with over 3 years of data, is better able to provide substantial conclusions and is therefore the focus of our study.
Table 2 provides the descriptive statistics for both Phase I and Phase II of the EU ETS. Although only Phase II of the data is used when applying the momentum and reversal strategies, Phase I data is included here for comparison. Phase I of the EU ETS period is represented by 628 observations from the EEX Carbix spot price index. This data series exhibits an average daily excess-return of 0.59% (median: -0.02%) with a standard deviation of 11.71%. The average EUA price over the Phase I sample period is $11.20, with the price ranging between a maximum of $29.78 and a minimum of $0.01.
The Phase II series of data is represented by 867 observations from the BlueNext EUA Spot Index. Over this sample period the data series exhibits an average daily excess return of -0.02% (median: -0.0017%) with a standard deviation of 2.26%. The average EUA price over the Phase II sample period is $16.17 (median: $14.80), with the price ranging between a maximum of $28.73 and a minimum of $7.96.
[Insert Table 2 about here]
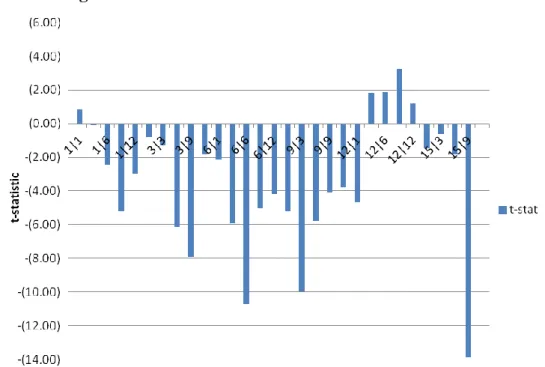
Compared to Phase II, Phase I has significantly greater volatility. This can also be evidenced by the spread of returns with the maximum daily excess return at 199.98% and the minimum excess return at -50.02%, further illustrated in Figure 5. This extreme volatility of returns in the Phase I dataset makes it difficult to draw concrete inferences. This significant and excessive volatility has since been investigated and found to be primarily the result of an over-allocation of EUA permits within the EU ETS and an inability to bank permits into Phase II (Zhang and Wei, 2010). These two external policy driven variables affected the pricing of EUAs during Phase I so greatly, that any momentum or overreaction factors that may normally influence price are may now be undetectable.
[Insert Figure 5 about here]
As can be seen in Figure 5 which illustrates the daily volatility in the spot market, of particular concern is the large jump in volatility beginning in April 2006 and its continued
increase toward the end of Phase I. While Phase II was subjected to an early period of slight volatility in 2008 coinciding with the GFC, the overall volatility appears to have since stabilized.
The volume of trading activity also varies considerably between the two phases, as shown in Figure 6. The volume during Phase I can be considered patchy and irregular, with an average daily volume of 23,413 EUAs traded (median: 13,594) and a standard deviation of 28,516 EUAs. With the beginning of Phase II the market began to develop and mature with an average daily volume of 2,034,422 EUAs traded (median: 1,045,000) during the sample period, and a standard deviation of 2,781,547 EUAs. Taken together, the significant volatility and thin trading volumes of Phase I result in the formation of a difficult and anomalous dataset. It is for these reasons that we focus on the more mature and developed Phase II of the EU ETS.
[Insert Figure 6 about here]
5. Empirical Results
5.1 Regression Analysis: Predicting Momentum and Overreaction
We first begin our analysis by examining the time-series predictability of the excess returns across different horizons. For each strategy we regress the K-month holding period excess returns on the previous J-months excess returns:
t K t J t K
r r (2)
By regressing the excess returns from the previous J-months with the following K-month returns we are able to calculate the significance of the predictability with t-statistics. The regressions are run for the returns covering months J = 1, 3, 6, 9, 12 and 15 months with the led returns for months K = 1, 3, 6, 9 and 12 months. The results from this regression are presented in Table 3. Table 3 provides the first indication of whether we can expect momentum or overreaction within the EU ETS. Positive and significant t-statistics for the previous J-months return variable indicate possible momentum, while negative and significant t-statistics provide an indication of reversal within the various J-month/K-month strategies.
[Insert Table 3 about here]
Figure 7 plots the t-statistics for the regressed excess returns and the lagged excess returns. It shows that the majority of the t-statistics are negative indicating a significant reversal (overreaction) in excess returns. This is the first indication that profitable contrarian
strategies may be possible in the EU ETS. Where the t-statistics are positive for month J = 12 months and led months returns K = 3, 6, 9 and 12 months, this indicates a continuation or trend in the excess returns and the potential for some profitable momentum strategies (Moskowitz et al., 2012).
[Insert Figure 7 about here]
As illustrated by Moskowitz et al. (2012), a simpler way to look at time-series predictability is to focus on the sign of the excess returns. This identifies simply if positive returns over the previous J-months will lead to positive or negative accumulated returns over the following K-months. In the regression, we can capture this strategy from the following specification:
( t K) (t J) t K
sign r sign r (3)
where the K-month and J-month return are equated to either +1 or -1 if the returns are positive or negative, respectively. Figure 8 shows that the majority of the t-statistics are again negative, which indicates significant reversal in excess returns and the potential for successful contrarian strategies. However, we can also see a number of positive t-statistics, which may indicate the potential for momentum in returns.
[Insert Table 4 about here] [Insert Figure 8 about here]
The results from these two regressions are fairly similar, with stronger indications of a reversal in excess returns for the look-back periods J = 1, 3, 6, 9, and 15 months. Both Figure 7 and 8 indicate potential momentum within the excess returns for look-back periods J=12 months. Additionally, positive t-statistics in Figure 8 for J = 3 and 9 months indicate the potential for momentum in those excess returns. Following this analysis, the success of these predictions is tested by evaluating the profitability of both momentum and contrarian strategies.
5.2 Profitability of Strategies
After identifying the potential for both reversals as well as momentum within the excess returns of the EU ETS, the next step is to investigate the profitability of strategies based on these results. Using the methodology based on Moskowitz et al. (2012), we formulate investment strategies that identifies buy or sell signals based on the previous indexed J-month excess returns. Once the buy or sell signal is identified, the position is opened and held for the following K-months, in an overlapping portfolio. In the momentum
strategies, the buy (sell) signal is identified by a positive (negative) indexed return over the previous J-months. Once the strategies have been assembled, a return series is calculated reporting the gains and losses from each investment decision over the relative holding period. After the return series is constructed for the entire sample period, the average monthly and cumulative returns are calculated for each strategy, as well as annualized returns and t -statistics.
Table 5 presents the monthly excess returns and t-statistics (in parentheses) for the various momentum strategies. Panel A in Table 5 provides the results for zero transaction cost strategies, while Panel B gives the results after transaction costs have been included. As expected, the inclusion of transaction costs has a downward effect on profitability of the strategies; however the effect can be considered negligible with an average monthly decrease of approximately 0.01%. This table shows that the momentum profits are not consistent across all strategies. Momentum was, however, documented with statistically significant and robust profits for portfolios with J = 1 and 3 months look-back periods and K = 1, 3 and 6 months holding periods. Additional statistically significant profits are achieved with J = 3 and 12 months look-back periods and K = 12 and 3 months holding periods, respectively. While these initial findings provide satisfactory evidence to support the first null hypothesis (H1), we will continue to analyze the results to further understand the profitability through time.
[Insert Table 5 about here]
Table 6 describes the profits for the contrarian strategies over the same sample period. Panel A in Table 6 provides the results for zero transaction cost strategies, while Panel B provides the results after market stated transaction costs have been considered. Again the inclusion of transaction costs has a downward effect on profitability of the strategies; however, the effect can be considered negligible with an average monthly decrease of approximately 0.04%. As predicted by the negative t-statistics in Figure 7 and 8, the contrarian strategies provide positive excess returns consistently across a broad range of strategies. Overreaction (reversal) is widely identified within the dataset, with statistically significant profits in 20 of the 30 strategies tested (see Table 6). The only statistically significant negative return is found in J = 12 months/K = 3 months strategies. While several other contrarian strategies display negative average returns, they are not statistically significant at the 5% level. These findings provide satisfactory evidence to support the second null hypothesis (H2).
5.3 Multifactor Analysis
To further explore the structure of each strategy’s return, a three-factor model is used in the spirit of Moskowitz et al. (2012). In order to further evaluate the performance of the relative momentum and contrarian strategies, each return series is regressed with the following factors: , , 1 2 3 TS J K i t t t t t r MKT BOND GSCI (4)
where ri tTS J K, , is the return on strategy i (either Momentum or Contrarian) with J-months look-back period and K-months holding period. Table 7 and 8 report the coefficient estimates, t-statistics and R-squares from these time-series regressions. These regressions provide an intercept (alpha) which can be interpreted as the residual return to each strategy after accounting for its exposure to the asset classes and risk factors described above.
[Insert Table 7 about here] [Insert Table 8 about here]
Table 7 demonstrates the positive and significant abnormal-returns (alpha) that are achieved through the momentum strategies, particularly with look-back periods of J = 1 and 3-months. These positive alphas indicate that returns are not compensation for passive exposure to the risk factors, but are a result of the strategy itself (Moskowitz et al., 2012). Table 8, on the other hand, demonstrates the positive and significant alphas of the contrarian strategies, particularly for the J = 6 and 9 month look-back periods. These results indicate the robustness of excess-returns for the contrarian strategies at those periods.
One concern is that the above time-series regressions might be spurious if the variables are non-stationary. To overcome this potential issue, we test the stationarity of each variable using the Phillips-Perron and Dickey–Fuller tests. The results suggest that all variables are stationary, and thus our multifactor analysis result will not be subject to the spurious regression issue.
We see a negative relationship between the momentum strategies and the commodity factor, indicated with negative beta coefficients through the dataset. This tells us that rising commodity prices may support a reversal in carbon prices. This relationship has a diminishing effect as the strategy look-back periods extend.
As expected, we find the inverse is true with regard to the contrarian strategies and the commodity factor, with positive beta coefficients for the commodity factor. These are
statistically significant particularly around the shorter-term strategies, again indicating that a strengthening commodity market may provide support for a reversal in carbon prices.
From our factor analysis, we find a positive relationship between the market factor and the momentum strategies. This is indicative of the positive relationship between the stock prices (particularly energy stocks) and EUA prices as evidenced by Oberndorfer (2009).
6. Concluding Remarks
We investigate the behavior of momentum in EU ETS markets. We document short-term time-series momentum for strategies with look-back periods of J = 1 and 3 months, with holding periods of K = 1, 3 and 6 months. These returns are statistically significant, and importantly all six of these strategies contain positive and statistically significant alphas. This illustrates the robustness of the strategies and returns at these time horizons.
Longer-term momentum is also identified with profitable strategies for look-back periods of J = 12 months and holding periods of K = 3 and 6 months, respectively. Again the factor analysis finds that the alpha for these strategies as positive and statistically significant. This longer term momentum is consistent with the literature; with many studies finding momentum with 12-month look-back periods (Jegadeesh and Titman, 1993; Moskowitz et al., 2012).
While the momentum profits are significant and robust at the time horizons indicated, medium-term reversals also appear to be dominant drivers in the EUA price. This reversal pattern allows for contrarian strategies to produce significant profits. The medium term reversals identified here are consistent with overreaction theories, where investors are excessively sensitive new information and drive prices beyond fundamental values before being corrected over time. This overreaction and following correction provides a predictable and consistent pattern within the EUA price allowing for contrarian strategies to profit. Medium-term reversals are not entirely consistent with Moskowitz et al. (2012); however our study does support Moskowtiz’s findings with long-term reversals at look-back periods greater than 12-months. The findings of Moskowitz et al. (2012) do however represent an amalgamation of returns from 58 different assets, without detailing each specifically, making it difficult to offer direct asset comparisons.
Our final result is that this market is characterized with short-term momentum (underreaction), followed in the medium term with overreaction and reversals before switching again to underreaction and momentum at the 12-month mark. It is possible that the
varying behavior through time is related to the immaturity of the market, where participants tend to ‘‘follow the market” in the short-term while inclined to hyper-sensitivity and overreaction to new information in the medium term.
The cause of momentum and overreaction in asset markets is typically discussed with references to behavioral finance theories. The characteristics of these findings – with short-term momentum followed by medium-short-term overreaction – are consistent with the behavioral model offered by Hong and Stein (1999). They describe the existence of momentum and overreaction as a direct result of interactions between two types of agents. The first type adjusts prices slowly as private information diffuses slowly throughout the market, leading to underreaction (momentum) within the market. The second type seeks to profit from the underreaction by accelerating price movements toward fundamentals. This underreaction then eventuates in an overreaction, which we see in the results provided. As this overreaction is perceived, it too is corrected over time allowing for contrarian strategies to profit.
It is important to be aware that the objective of our study is not necessarily to ascertain whether EUA prices exhibit particular momentum or reversal behavior, but rather to identify whether this behavior is at all present, measurable and exploitable in a practical sense. At the heart of this study is an investigation into the information content of historical prices, and whether it is possible to profit through exploitation of this information. The ability to profit through the exploitation of historical price information provides evidence of a violation of weak-form EMH. Our study conclusively confirms that information is contained within the historical prices that provide statistically significant profits for both momentum and contrarian strategies over varying time-horizons. We find that not only are the excess-returns of the successful strategies positive, but that these returns remain achievable after considering the effect of transaction costs.
We conclude that both the null hypotheses H1 and H2 are supported – meaning, there is evidence of both momentum and reversals within the EUA price. The inference from this documentation is that the EU ETS is not informationally-efficient and in violation of the weak-form EMH. However, as the sample period of the dataset is relatively short (approximately 3.5 years), future research is required to test whether these findings are consistent with out-of-sample studies.
The significant time-series momentum and reversal (overreaction) effect documented in this study has potentially important implications for theories of asset pricing. As Moskowitz et al. (2012) explain, from an efficient markets perspective, the existence of time-series momentum rejects the random walk hypothesis. In order to reconcile time-time-series
predictability with the EMH, a time-varying risk premia must be present. While Moskowitz et al. (2012) could not rule out time-varying risk premia contributing to the results, the magnitude of his time-series momentum and this study’s reversal profits posts a significant challenge to existing risk-based theories.
The results of our study indicate that time-series momentum and reversal offer a promising topic that requires further investigation. In light of our findings and those of Moskowitz et al. (2012), time-series momentum and overreaction behaviors may well be identified within various asset markets around the world. Additionally, as the EU ETS market continues, future research will need to reconfirm or deny the results of this study with out-of-sample data. As the EU ETS market and the information regarding its price-drivers develop, it is possible that the behavior of the market participants will develop and change and this will require future study to confirm. Additional research including carbon emissions (EUAs) within a cross-sectional momentum investigation would also add further insights, allowing for discussion and comparison with traditional momentum studies. The characteristics of this new and emerging market, while challenging, present a unique opportunity for researchers to explore the foundations of finance theory.
References
Alberola E, Chevallier J. European carbon prices and banking restrictions: Evidence from Phase I (2005-2007). The Energy Journal 2009; 30:51-80.
Alberola E, Chevallier J, Chèze BI. Price drivers and structural breaks in European carbon prices 2005-2007. Energy Policy 2008; 36:787-97.
Asness CS, Moskowitz T, Pedersen LH. Value and momentum everywhere. AQR, Booth, and NYU 2008; working paper.
Austin M. The business of carbon trading. Renewable Energy Focus 2007; 8:60–2.
Barberis JJ, Prada M, Tignol A. La régulation des marchés de CO2. Ministère de l'Écologie 2010; Mongraphie 18730. (In French)
Bataller M, Pardo Tornero Á, Valor i Micó E. CO2 prices, energy and weather. The Energy Journal 2007; 28:67-86.
Benz E, Trück S. Modeling the price dynamics of CO2 emission allowances. Energy Economics 2009; 31:4–15.
Bianchi RJ, Drew ME, Polichronis J. A test of momentum trading strategies in foreign exchange markets: evidence from the G7. Global Business and Economics Review 2005; 7:155–79.
BlueNext - the earth’s exchange 2011. Retrieved September 27, 2011, from http://www.bluenext.fr/products/feesSpot.html
Bunn D, Fezzi C. A vector error correction model of the interactions among gas, electricity and carbon prices: an application to the cases of Germany and the United Kingdom. Markets for carbon and power pricing in Europe: theoretical issues and empirical analyses. Edward Elgar Publishing; 2008, p. 145–59.
Capoor K, Ambrosi P. State and trends of the carbon market 2008. Washington, D.C.: The World Bank 2008.
Capoor K, Ambrosi P. State and trends of the carbon market 2009. Washington, D.C.: The World Bank 2009.
Chan LK, Jegadeesh N, Lakonishok J. Momentum strategies. The Journal of Finance 1996; 51:1681–714.
Chen HL, Jegadeesh N, Wermers R. The value of active mutual fund management: An examination of the stockholdings and trades of fund managers. Journal of Financial and Quantitative Analysis 2000; 35:343–68.
Christiansen AC, Arvanitakis A, Tangen K, Hasselknippe H. Price determinants in the EU emissions trading scheme. Climate Policy 2005; 5:15-30.
Considine TJ. The impacts of weather variations on energy demand and carbon emissions. Resource and Energy Economics 2000; 22:295-314.
Convery FJ, Redmond L. Market and price developments in the European Union emissions trading scheme. Review of Environmental Economics and Policy 2007; 1:88-111. Daskalakis G, Markellos R. Are the European carbon markets efficient? Review of Futures
Markets 2008; 17:103-28.
Daskalakis G, Psychoyios D, Markellos RN. Modeling CO2 emission allowance prices and derivatives: Evidence from the European trading scheme. Journal of Banking and Finance 2009; 33:1230-41.
De Bondt W, Thaler R. Does the stock market overreact? The Journal of Finance 1985; 40: 793-805.
De Cian E, Lanzi E, Roson R. The impact of temperature change on energy demand: a dynamic panel analysis. Fondazione Eni Enrico Mattei 2007; Working Papers No. 49. EUROPA. Questions and Answers on the revised EU Emissions Trading System. Press
Releases MEMO/08/796 2008. Retrieved September 15, 2011, from http://europa.eu/rapid/pressReleasesAction.do?reference=MEMO/08/796
Ellerman AD, Buchner BK. Over-allocation or abatement? A preliminary analysis of the EU ETS based on the 2005–06 emissions data. Environmental and Resource Economics 2008; 41:267-87.
Ellerman AD, Joskow P. The European Union’s emissions trading system in perspective. Massachusetts Institute of Technology: Pew Center on Global Climate Change 2008. European Energy Exchange Fees. 2011. Retrieved September 27, 2011, from
http://www.eex.com/en/EEX/Products%20%26%20Fees/Fees
Fama E. Efficient capital markets: A review of theory and empirical work. The Journal of Finance 1970; 25:383-417.
Feng ZH, Wei YM, Wang K. Estimating risk for the carbon market via extreme value theory: An empirical analysis of the EU ETS. Applied Energy 2012; 99: 97-108.
Feng ZH, Zou LL, Wei YM. Carbon price volatility: Evidence from EU ETS. Applied Energy 2011; 88: 590-8.
Grinblatt M, Moskowitz T. Predicting stock price movements from past returns: the role of consistency and tax-loss selling. Journal of Financial Economics 2004; 71:541–79.
Grinblatt M, Titman S, Wermers R. Momentum investment strategies, portfolio performance, and herding: A study of mutual fund behavior. The American Economic Review 1995; 85:1088-105.
Grundy B, Martin J. Understanding the nature of the risks and the source of the rewards to momentum investing. The Review of Financial Studies 2001; 14:29-78.
Hong H, Stein J. A unified theory of underreaction, momentum trading, and overreaction in asset markets. The Journal of Finance 1999; 54:2143-84.
Hong H, Lim T, Stein JC. Bad news travels slowly: Size, analyst coverage, and the profitability of momentum strategies. The Journal of Finance 2000; 55:265-95.
International Energy Agency. IEA energy policies review: the European Union - 2008. OECD/IEA 2008. Retrieved at http://books.google.com.au/books?id=1TyXCd6ziXQC. Jegadeesh N, Titman S. Returns to buying winners and selling losers: Implications for stock
market efficiency. The Journal of Finance 1993; 48:65-91.
Jegadeesh N, Titman S. Profitability of momentum strategies: An evaluation of alternative explanations. The Journal of Finance 2001; 61:699-720.
Kanen J. Carbon trading and pricing. Environmental Finance Publications; 2006.
Lee CM, Ready MJ. Inferring trade direction from intraday data. The Journal of Finance 1991; 46:733–46.
Lesmond DA, Ogden J, Trzcinka C. A new estimate of transaction costs. The Review of Financial Studies 1999; 12:1113-41.
Lesmond DA, Schill MJ, Zhou C. The illusory nature of momentum profits. Journal of Financial Economics 2004; 71:349–80.
Menkhoff L, Schmidt U. The use of trading strategies by fund managers: Some first survey evidence. Discussion Paper 2005.No. 314.
Mideksa TK, Kallbekken S. The impact of climate change on the electricity market: A review. Energy Policy 2010; 38:3579-85.
Miffre J, Rallis G. Momentum strategies in commodity futures markets. Journal of Banking and Finance 2007; 31:1863–86.
Montagnoli A, de Vries F. Carbon trading thickness and market efficiency. Energy Economics 2010; 32:1331–6.
Moskowitz T, Ooi YH, Pedersen LH. Time series momentum. Journal of Financial Economics 2012; 104:228-50.
Novy-Marx R. Is momentum really momentum? Journal of Financial Economics 2012; 103:429-53.
Oberndorfer U. EU emission allowances and the stock market: Evidence from the electricity industry. Ecological Economics 2009; 68:1116–26.
Okunev J, White DR. Do momentum based strategies still work in foreign currency markets? Journal of Financial and Quantitative Analysis 2003; 38:425-47.
Palao F, Pardo A. Assessing price clustering in European Carbon Markets. Applied Energy 2012; 92:51-6.
Rickels W, Görlich D, Oberst G. Explaining European emission allowance price dynamics: Evidence from Phase II. Kiel Working Papers 2010. No. 1650.
Roll R. A simple implicit measure of the effective bid-ask spread in an efficient market. The Journal of Finance 1984; 39:1127–39.
Rouwenhorst KG. International momentum strategies. The Journal of Finance 1998; 53:267– 84.
Shiller R. From efficient market theory to behavioral finance. Cowles Foundation Discussion Paper 2002. No. 1385.
Springer U. The market for tradable GHG permits under the Kyoto Protocol: a survey of model studies. Energy Economics 2003; 25:527-51.
Stoll HR, Whaley RE. Transaction costs and the small firm effect. Journal of Financial Economics 1983; 12:57–79.
Subrahmanyam A. Behavioral finance: A review and synthesis. European Financial Management 2007; 14:12-29.
Zhang YJ, Wei YM. An overview of current research on EU ETS: Evidence from its operating mechanism and economic effect. Applied Energy 2010; 87:1804–14.
Table 1: Evolution of Trade within the EU ETS 2005 – 2009
EUA Volume Traded (millions of tons) Value of Transactions (millions of Euros) Average Price (Euros/tCO2) 2005 262 5400 20.60 2006 828 14,500 17.50 2007 1,458 25,200 17.30 2008 2,731 61,200 22.40 2009 5,016 65,900 13.10
Source: Barberis, Prada and Tignol (2010) Note: This table excludes OTC transactions without clearing.
Table 2: Descriptive Statistics
Phase I Phase II Average Daily Excess Return (%) -0.59% -0.02% Median Daily Excess Return (%) -0.02% -0.0017% Std. Dev. Daily Excess Returns (%) 11.71% 2.26%
Max Daily Return (%) 199.98% 11.12%
Min Daily Return (%) -50.02% -9.78%
Average Price ($) $11.20 $16.17
Median Price ($) $0.00 $14.80
Std. Dev. ($) $10.07 $4.26
Max EUA Price ($) $29.78 $28.73
Min EUA Price (%) $0.01 $7.96
Average Daily Trading Volume 23,413 2,034,422 Median Daily Trading Volume 13,595 1,045,000 Daily Trading Volume Std. Dev. 28,517 2,781,547 Max Daily Trading Volume 211,150 19,846,000
Min Daily Trading Volume 0 0
Skewness 8.21 -0.10
Kurtosis 140.19 2.76
Note: This table provides the descriptive statistics for Phase I and Phase II of the EU ETS. Phase I of the sample period is represented by 686 observations with data from the EEX Carbix spot price index. The Phase II series is represented by 867 observations from the BlueNext EUA Spot Index. Excess returns are calculated by subtracting the LIBOR 3-month middle rate from the daily returns.