Faculty Papers and Publications in Animal Science
Animal Science Department
2012
Calving date and wintering system effects on cow
and calf performance I: A systems approach to beef
production in the Nebraska Sandhills
W. A. Griffin
University of Nebraska-Lincoln
L. A. Stalker
West Central Research and Extension Center, University of Nebraska–Lincoln, stalkera@byui.edu
D. C. Adams
West Central Research and Extension Center, University of Nebraska–Lincoln, dadams1@unl.edu
R. N. Funston
West Central Research and Extension Center, University of Nebraska–Lincoln, rfunston2@unl.edu
T. J. Klopfenstein
University of Nebraska–Lincoln, tklopfenstein1@unl.edu
Follow this and additional works at:
http://digitalcommons.unl.edu/animalscifacpub
Part of the
Genetics and Genomics Commons
, and the
Meat Science Commons
This Article is brought to you for free and open access by the Animal Science Department at DigitalCommons@University of Nebraska - Lincoln. It has been accepted for inclusion in Faculty Papers and Publications in Animal Science by an authorized administrator of DigitalCommons@University of Nebraska - Lincoln.
Griffin, W. A.; Stalker, L. A.; Adams, D. C.; Funston, R. N.; and Klopfenstein, T. J., "Calving date and wintering system effects on cow and calf performance I: A systems approach to beef production in the Nebraska Sandhills" (2012).Faculty Papers and Publications in Animal Science. 865.
ABSTRACT
A 4-yr study using 217 cows/yr (3/4 Red Angus, 1/4 Simmental) evaluated effects of calving date and wintering sys-tem on cow and calf performance from birth to harvest. Cows were assigned to 1 of 5 treatments: 1) March (Mar) calving cows wintered on native range, 2) Mar calving cows wintered on corn residue, 3) June (Jun) calving cows wintered on na-tive range, 4) Jun calving cows wintered on corn residue, and 5) August (Aug) calving cows wintered on corn residue. Steers born in Mar entered the feedlot at weaning (calf-fed). Steers and heif-ers born in Jun and Aug were divided equally into 2 postweaning management treatments. Half entered the feedlot immediately after weaning (calf-fed), and half grazed cool season meadow and entered the feedlot as yearlings. Precalv-ing BW (P < 0.01) and BCS (P < 0.01) were greatest for Aug-calving cows and least for Mar-calving cows. Cow BCS at
weaning was similar (P = 0.15) among calving dates. Cow BCS was not affected (P > 0.22) by wintering treatment. Preg-nancy rates were similar among calving dates (P = 0.37) and wintering systems (P = 0.53). Adjusted 205-d weaning BW were greatest (P ≤ 0.001) for calves born in Mar, intermediate for calves born in Aug, and least for calves born in Jun but not affected (P = 0.56) by wintering system. Carcass weight of calf-fed steers was greatest (P = 0.03) for those born in Jun, followed by Aug, and least for Mar. Feedlot performance was not affected (P > 0.10) by cow wintering system. Yearlings had greater (P < 0.001) feedlot DMI and ADG than calf-feds. Calving date but not wintering system affected cow BW and BCS, and affected calf BW gain from birth to harvest.
Key words: beef cattle , calving date , wintering system , postweaning management , beef production system
INTRODUCTION
Profitability of beef cattle produc-tion is highly dependent upon cost of production. The largest variable cost
associated with cow/calf production is feed cost (May et al., 1999). One strategy to reduce cost is to extend the grazing season because allowing cows to graze costs less than mechani-cally harvesting and feeding forage (Adams et al., 1996). In the Nebraska Sandhills cows commonly calve in late winter. Because dormant winter range does not contain sufficient nutrients to meet the requirements of cows in late gestation or early lactation (Lar-dy et al., 2004), feedstuffs such as hay, grain, and manufactured supplements are purchased and fed. Purchased and harvested feeds together with the labor to feed them increase the cost of production. The required amount of purchased and harvested feedstuffs is directly dependent on choice of calv-ing date. Selectcalv-ing a calvcalv-ing date that matches the cow’s nutrient require-ments with grazed forage nutrient content has the potential to reduce costs (Stockton et al., 2007).
A second factor affecting profit-ability of beef cattle production is revenue. Cattle markets tend to have seasonal variation throughout the year and vary with respect to calf
C
alving date and wintering
system effects on cow and
calf performance I: A systems
approach to beef production
in the Nebraska Sandhills
1
W. A. Griffin ,* PAS, L. A. Stalker ,†2 D. C. Adams ,† R. N. Funston ,† and T. J. Klopfenstein * * Department of Animal Science, University of Nebraska, Lincoln 68583; and
† University of Nebraska–Lincoln, West Central Research and Extension Center, North Platte 69101
1 A contribution of the University of Nebraska–Lincoln Agricultural Research Division, supported in part by funds provided through the Hatch Act.
size and class, creating opportunities to match a production system to the markets. The traditional late-winter calving system produces weaned calves and culls animals that are generally marketed when the aver-age seasonal prices are least (USDA, 2010). Altering the calving date shifts production and market windows to a different time, which may be economi-cally advantageous (Stockton et al., 2007). In addition to calving date, the decision to sell calves at various ages or BW provides flexibility in market-ing and use of feed resources. Calves entering the feedlot immediately after weaning require more days on feed (DOF) and reach harvest endpoint at a lighter BW than yearlings main-tained on pasture following weaning (Griffin et al., 2007). These 2 man-agement schemes offer flexibility in the marketing times and size of the animal, allowing producers to adjust production to market conditions.
Residue remaining following corn grain harvest is abundant in Ne-braska and can be advantageous to beef production systems. Grazing corn residue costs less than winter range even though both are similar in nutrient content (Klopfenstein et al., 1987). If a calving date were selected which matched the cow’s greatest feed intake with this inexpensive feed re-source, net returns could be increased. Furthermore, integration of this feed resource into a beef production sys-tem may reduce costs, regardless of calving date.
Determining the most profitable beef cattle production system requires knowledge of the productivity of pos-sible systems. The objective of this research was to determine the effects of 1) calving in March (Mar), June (Jun), or August (Aug), 2) integra-tion of corn residue into the produc-tion system, and 3) increasing calf BW outside the feedlot on cow repro-ductive performance and calf growth performance from birth to harvest.
MATERIALS AND METHODS
All procedures involving animal care and management were approved by
the University of Nebraska Institu-tional Animal Care and Use Commit-tee.
Cow/Calf Management
A 4-yr study used an average of 217 cows (3/4 Red Angus, 1/4 Simmental) per year at the Gudmundsen Sand-hills Laboratory (GSL), near Whit-man, Nebraska. Cows were assigned to 1 of 5 treatments: 1) Mar calving cows wintered on native range, 2) Mar calving cows wintered on corn residue, 3) Jun calving cows wintered on native range, 4) Jun calving cows wintered on corn residue, and 5) Aug calving cows wintered on corn residue. Average calving dates were Mar 24, Jun 15, and Aug 5. All cows were as-signed to their respective calving date and wintering treatment for at least 1 yr before data collection commenced.
Upland pastures at GSL are domi-nated by warm season tall grasses, the most common of which are little bluestem [Andropogon scoparius (Mi-chx.) Nash], prairie sandreed [ Cal-amovilfa longifolia (Hook.) Scribn.], sand bluestem (Andropogon halli
Hack.), switchgrass (Panicum virga-tum L.), sand lovegrass [Eragrostis trichoides (Nutt.) Wood], and blue grama [Bouteoua gradis (H.K.B.) Ex Griffiths]. A more detailed descrip-tion of species composidescrip-tion of native range at the GSL is given by Adams et al. (1998). Subirrigated meadows at GSL are dominated by cool season grasses including slender wheatgrass [Elymus trachycaulus (Link) Matte], redtop bent (Agrostis stolenifera L.), timothy (Phleum pratense L.), Ken-tucky bluegrass (Poa pratensis L.), smooth bromegrass (Bromus inermus
Leyss.). Grass-like plants includ-ing woolly sedge (Carex lanuginose
Michx.) and spike rush (Eleocharis
spp.) are common, as are forbs such as white clover (Trifolium repens L.), alsike clover (Trifolium hybridium L.), and red clover (Trifolium pratense L.). The plant species composition of GSL subirrigated meadows is described by Volesky et al., 2004.
March-calving cows wintered on native range grazed upland pastures
from May 1 to February 28. Pastures were stocked at about 1.5 animal unit mo (AUM)/ha. Beginning on Mar 1, they were fed grass hay harvested from subirrigated meadow in a drylot until April (Apr) 30. The amount of hay fed was adjusted daily in an effort to satisfy appetite but minimize waste and averaged about 11.5 (DM basis) kg/d per cow. March-calving cows wintered on corn residue grazed native upland range in the same pastures as Mar-calving cows wintered on range from May 1 until November (Nov) 10 when they were transported 84 km and grazed corn residue. The stocking rate for cattle grazing corn residue was 3.7 AUM/ha. On Mar 1, this group was returned to GSL and fed grass hay until May 1 in the same drylot as the Mar calving cows wintered on native range. From Janu-ary 15 to Mar 1, Mar-calving cows in both wintering systems were fed the equivalent of 0.45 kg/d per cow of a 28% CP supplement delivered 3 times/wk. Supplement composition is listed in Table 1.
June-calving cows wintered on native range grazed native upland pastures for the entire year. Pastures were stocked at about 1.5 AUM/ha. June-calving cows wintered on corn residue grazed native upland pastures for the entire year except between Nov 10 and Apr 1 when they grazed corn residue in fields adjacent to Mar-calving cows. The stocking rate for
Table 1. Composition of 28% CP supplement
Item % of DM
Dried distillers grains 62 Wheat middlings 11 Cottonseed meal 9 Corn gluten meal 5
Molasses 5
Urea 2
Calcium carbonate 3
Binder 2
Other1 1
1Formulated to contain 22,000 IU/ kg of vitamin A and 176 mg/kg of monensin.
cattle grazing corn residue was about 3.7 AUM/ha. June-calving cows in both wintering treatments were fed the supplement shown in Table 1 from Aug 1 until Apr 1, delivered 3 times/ wk. June calving cows wintered on native range were fed the equivalent of 1.14 kg/d per cow, and Jun-calving cows wintered on corn residue were fed the equivalent of 0.45 kg/d per cow.
August-calving cows grazed native Sandhills range for the entire year ex-cept between Nov 10 and Apr 1 when they grazed corn residue in the same fields as the Jun-calving cows. The stocking rate while cattle were grazing native range was about 1.5 AUM/ha and 3.7 AUM/ha while grazing corn residue. August-calving cows were fed the equivalent of 0.45 kg/d of the supplement shown in Table 1 from October (Oct) 1 to May 30 delivered 3 times/wk.
In the event snow accumulation was sufficient to preclude grazing, hay was fed in winter pastures or in the corn field. This event was rare and occurred on the same number of days for each wintering treatment.
Replacement heifers were not de-veloped within each system. Instead, a pool of Mar-born, 2-yr-old replace-ment cattle, pregnant with their second calf, were introduced into each herd at weaning time. Replacement cattle were managed in one group and exposed to breeding at the appropri-ate time to produce sufficient replace-ment animals to maintain a constant herd size within all 3 calving dates.
Cows were exposed to bulls that had passed an annual breeding soundness examination for 45 d with a 1:25 bull-to-cow ratio. At wean-ing, cows were rectally palpated to determine pregnancy status. All cows were vaccinated against Clostridium perfringens C, Escherichia coli, Rota-virus, and Coronavirus [Scourguard 3 (K)/C, Pfizer Animal Health, New York, NY], infectious bovine rhinotra-cheitis, parainfluenza-3 virus, bovine viral diarrhea (killed), Leptospirosis, and Vibriosis (Bovishield Gold 3 and Staybred VL 5, Pfizer Animal Health). At branding, which occurred
approximately 75 d postcalving, bull calves were castrated and all calves were vaccinated against Mannheimia haemolytica type A1 (One Shot, Pfizer Animal Health) and administered a 7-way clostridial vaccine (Vision 7, Intervet-Schering Plough, De Soto, KS).
Calving difficulty scores ranging from 1 to 5 (1 = no assistance, 2 = minor assistance, 3 = difficult assis-tance, 4 = cesarean section, 5 = ab-normal presentation) and a calf vigor score from 1 to 5 (1 = nursed unas-sisted, 3 = nursed with assistance, and 5 = dead at birth) were assigned at calving.
Calves born in Mar were weaned Oct 31 (221 d of age). Calves born in Jun and Aug were weaned Apr 10 (298 and 247 d of age, respectively). April 10 was chosen as the weaning date because it coincided with the return of cow/calf pairs from corn fields to GSL. After weaning, calves born in Mar grazed cool season grass dominated subirrigated meadows during a 19-d preconditioning period and received 0.45 kg/d of supplement. Calves born in Jun and Aug also grazed cool season grass dominated, subirrigated meadows after weaning for a 30 d preconditioning period and received 0.45 kg/d of the supplement. Stocking rate on the meadow was about 6.2 AUM/ha.
For each system, cow BW and BCS were recorded precalving, prebreed-ing, and at weaning. Calf BW was recorded at birth, dam prebreeding, and weaning.
Weaned Calf Management
Immediately after the 19-d precon-ditioning period, all steers born in Mar entered the feedlot as calf-feds. Heifers born in Mar were retained at GSL and developed as replacement animals. Both steers and heifers born in Jun and Aug were stratified by weaning BW and assigned randomly to 1 of 2 weaned calf treatments: 1) enter the feedlot as calf-feds immedi-ately after the 30-d preconditioning period or, 2) enter the feedlot as year-lings after grazing cool season
grass-dominated meadow for the summer grazing season. Stocking rate while animals were grazing meadow was ap-proximately 6.2 AUM/ha.
On the same day calves assigned to the calf-fed treatment entered the feedlot, calves assigned to the yearling treatment began grazing cool season dominated meadow. Length of the grazing period was assigned based on the time needed to achieve similar BW for yearling steers and heifers at feedlot entry (354 kg). Because steers were heavier at the initiation of grazing, heifers were allowed to graze longer. All yearlings were managed as one group and supplemented with 0.6% (about 1.5 kg/animal daily) of BW dried distillers grains plus solubles while on pasture.
Cattle were shipped (160 km) to West Central Research and Extension Center (North Platte, NE) feedlot for finishing. Arrival date to the feedlot for steers born in Mar was Nov 19 and arrival date for calf-fed Jun and Aug born steers and heifers was May 9. June- and Aug-born yearlings ar-rived at the feedlot in 3 groups: 1) yearling steers born in Jun arrived Aug 11, 2) yearling heifers born in Jun and yearling steers born in Aug arrived September 1, and 3) yearling heifers born in Aug arrived Oct 3. Upon arrival at the feedlot, regardless of treatment, all cattle were limit fed for 5 d at 2% of BW and weighed for 2 consecutive days on the last 2 d of the limit-feeding period to determine feedlot initial BW. All animals were fed a common finishing diet until it was visually estimated they averaged 1.27 cm of back fat thickness (FT). At feedlot arrival, all cattle were administered an anthelmintic (Decto-max Pour-On, Pfizer Animal Heatlh) and revaccinated against clostridial diseases and Hemophilus sominus
(Vision 7/Somnus with Spur, Intervet Schering-Plough). Additionally, cattle were vaccinated with a modified live vaccine for respiratory viruses (Bov-iShield Gold 4, Pfizer Animal Heatlh) and received an initial anabolic growth promoting implant. Calf-feds received Synovex-S or Synovex-H (Fort Dodge Animal Health, Overland
Park, KS) and yearlings received Ral-gro (Schering-Plough Animal Health, Union, NJ). About 100 d preharvest, all cattle were administered a termi-nal implant (Revalor-S or Revalor-H, Intervet Schering-Plough).
Calves entering the feedlot as calf-feds were adapted to the final finish-ing diet over a 54-d period usfinish-ing 3 step-up diets containing 37, 27, and 14% roughage (DM-basis), fed for 7, 7, and 40 d, respectively. Cattle enter-ing the feedlot as yearlenter-ings were fed similar step-up diets; however, they were adapted to the finishing diet in 21 d with 7 d on each step. The final finishing diet for all cattle in the feedlot contained (DM basis) 40% wet corn gluten feed (Sweet Bran, Car-gill Inc., Blair, NE), 48% dry-rolled corn, 7% alfalfa hay, 5% supplement, and a minimum of 12% CP, 0.7% Ca, 0.35% P, 0.6% K, 30 mg/kg monensin (Elanco Animal Health, Indianapolis, IN) and 11 mg/kg Tylosin (Elanco Animal Health).
Finished cattle were harvested at a commercial packing plant. Within each year, cattle within the same pro-duction system were harvested on the same date. However, across year har-vest date varied. Average harhar-vest date over the 4 yr for steers born in Mar was Jun 23. Average harvest date for calf-fed steers and heifers born in Jun, and yearling steers and heifers born in Jun was December 6 and Janu-ary 10, respectively. Average harvest date for calf-fed steers and heifers born in Aug, yearling steers born in Aug, and yearling heifers born in Aug was December 10, January 15, and February 10, respectively. On the day of harvest, HCW was measured and QG, KPH, FT, and LM area were measured after a 24-h chill. Yield grade was calculated as 2.5 + 6.35 × FT (cm) + 0.0017 × HCW (kg) + 0.2 × KPH (%) − 2.06 × LM area (cm2;
Boggs and Merkel, 1993). Final BW for all cattle was calculated by divid-ing HCW by a common (63%) DP.
Equal Backfat Thickness
Ad-justment. Comparisons between
calf-fed and yearling cattle within the Jun-calving treatment and compari-sons between steers and heifers within
the Aug-calving treatment were made after adjusting FT to a common end-point. The experiment was designed to harvest all finished cattle when FT was visually estimated to be 1.27 cm. However, because of the impreci-sion of the estimation, cattle were harvested at differing degrees of FT. To account for differences in perfor-mance caused by dissimilar manage-ment among treatmanage-ments FT, HCW and marbling must be adjusted to a common harvest endpoint (Guiroy et al., 2002; Tedeschi et al., 2004). Cattle from this study were compared at similar harvest endpoint following the procedure described by Griffin et al. (2007). Calf-fed cattle FT and marbling score at feedlot entry were estimated using the method described by May et al. (1992). Yearling cattle FT and marbling score at feed-lot entry were estimated using the method described by Bruns et al. (2004). Estimated feedlot entry FT was subtracted from FT measured at harvest and divided by DOF to deter-mine a FT accumulation rate for each group of cattle. Adjusted DOF was calculated by subtracting initial FT from 1.27 and dividing the difference by the FT accumulation rate. Initial feedlot carcass weight was calculated by multiplying feedlot entry BW by a 55% DP (May et al., 1992; Bruns et al., 2004). Initial carcass weight was subtracted from the HCW measured at harvest and divided by actual DOF to determine the daily carcass gain of each animal. Adjusted carcass weight was calculated by multiplying the adjusted DOF by the carcass rate of gain to which feedlot entry carcass weight was added. Feedlot entry bling score was subtracted from mar-bling score measured at harvest and divided by actual DOF to calculate marbling rate. Percentage of cattle grading choice was determined by regressing adjusted marbling score on percentage choice of a pen of cattle. Percentage of cattle grading choice was determined by regressing adjusted marbling score on percentage choice of a pen of cattle. Slopes were similar across treatments (P = 0.36), so data from all treatments were combined to
determine the regression equation for percentage choice at a given marbling score. Percent of carcasses over 455 kg was calculated by regressing the observed percentage of carcasses over 455 kg on DOF. Slopes of the regres-sion lines were different (P < 0.01) for sex and weaned calf management systems; therefore, 4 different equa-tions (calf-fed steers, calf-fed heifers, yearling steers, and yearling heifers) were used to determine the percentage of overweight carcasses at the appro-priate DOF.
Statistical Analysis
Cow data were analyzed as a com-pletely randomized design using the MIXED procedure of SAS (SAS In-stitute Inc., Cary, NC) as a 2 (Mar or Jun calving) × 2 (wintered on range or corn residue) + 1 (Aug calving wintered on corn residue) factorial ar-rangement of treatments. Experimen-tal unit for all data collected up to weaning was group of cow/calf pairs assigned to the same calving date and wintering system. Replication was achieved by repeating the study for 4 yr. The model analyzing the effect of calving date used all the data and included calving date as a fixed effect and year as a random effect. Data from Mar- and Jun-calving cows only was used to test the effect of win-tering system. This model included wintering system as fixed effects and year as a random effect. Data from Mar and Jun were analyzed for interactions between calving date and wintering system. There were no interactions (P > 0.29); therefore, the interaction statement was removed from the model. A Kenward-Rogers degrees of freedom adjustment was applied in every analysis to account for unequal numbers of cows within each treatment group. This served to weight the means according to the dif-fering number of observational units.
Calf data collected postweaning were analyzed as a completely ran-domized design using the MIXED procedure as a 2 × 2 + 1 factorial arrangement of treatments. Group of calves of the same sex born in the
same calving season to dams on the same wintering system served as the experimental unit in each analysis. Replication was achieved by repeating the experiment for 4 yr. Data col-lected from calf-fed steers was used to determine effects of calving date on feedlot performance. The model included the effect of calving date as a fixed effect and year as a random effect. Data collected from calves born in Mar and Jun were used to compare the effect of maternal wintering sys-tem on calf performance. The model included wintering system as a fixed effect and year as a random effect. Data from Mar and Jun were ana-lyzed for interactions between calving date and wintering system. There were no interactions (P > 0.29); therefore, the interaction statement was removed from the model. Data collected from calves born in Jun and Aug were used to determine effect of calf sex and weaned calf manage-ment system. The model included calf sex, weaned calf management system, and sex × weaned calf management system interaction as fixed effects and year as a random effect. A Kenward-Roger degrees of freedom adjustment was applied in every analysis to ac-count for unequal numbers of calves within each treatment group. This served to weight the means according to the differing number of observa-tional units. Data are presented as least squares means with differences considered significant at P < 0.05.
RESULTS AND DISCUSSION
Effects of Calving Date
on Cow/Calf Performance
Main effects of calving date on cow performance are presented in Table 2. Precalving BW was greatest (P < 0.01) for Aug-calving cows (625 kg), intermediate for Jun-calving cows (568 kg), and least for Mar-calving cows (532 kg). Likewise, prebreeding BW was greatest (P < 0.01) for Aug-calving cows (585 kg), intermediate for Jun-calving cows (569 kg), and least for Mar-calving cows (478 kg). Cow BW at weaning was (P = 0.01)
less for Mar-calving than Aug- and calving cows, but Aug- and Jun-calving cows were not different (P = 0.64) from each other. In addition to cow BW, precalving BCS differed (P
< 0.01) by calving date with Aug-calving cows having the greatest BCS, followed by Jun, and then Mar-calv-ing cows. At prebreedMar-calv-ing, Mar-calvMar-calv-ing cows had lower BCS (P < 0.01) compared with Jun- and Aug-calving cows, which were not different (P
= 0.82) from each other. There was no difference (P = 0.15) in BCS at weaning among cows within different calving dates. Body condition score of Mar-calving cows remained relatively constant throughout the year, chang-ing only from a BCS of 5.3 precalvchang-ing to a BCS of 5.2 at weaning. For both Jun- and Aug-calving cows, there was a much larger difference from precalv-ing to weanprecalv-ing with a 1.2- and 1.5-unit change in BCS for Jun and Aug, respectively.
There was no difference in calf BW at birth among the different calving dates (P = 0.66; Table 2). Calf wean-ing BW was similar (P = 0.36) for calves born in Mar and calves born in Aug. Because of greater age at weaning, calves born in Jun were 24 kg and 16 kg heavier (P < 0.01) than calves born in Aug and calves born in Mar, respectively. Calf ADG from birth to weaning was 0.18 and 0.13 kg/d greater (P < 0.01) for calves born in Mar than calves born in Jun and Aug, respectively. In addition, calves born in Aug had greater (P
< 0.01) ADG from birth to weaning than calves born in Jun. Adjusted 205-d weaning BW was greatest (P < 0.01) for calves born in Mar, interme-diate for calves born in Aug, and least for calves born in Jun. This is likely caused by seasonal differences in for-age quality consumed by the calf.
All cows that started the study each year had been previously diagnosed as pregnant. Percentage of cows which started the study that actually calved (calving rate) was not different (P = 0.44) among calving dates. Calving difficulty (P = 0.14) and calf vigor (P = 0.95) were not different among calving dates. Percentage of calves
weaned per cow that started the study (weaning rate) was also not dif-ferent (P = 0.81) among treatments. Calving date did not affect (P = 0.37) the percent of cows that became pregnant (pregnancy rate) during the study.
Because replacement heifers were not developed within each system, herd size was maintained by introduc-ing Mar-born, 2-yr-old cattle that had delivered their first calf in Mar of the year they were introduced. By de-sign, the postpartum interval differed among replacement cattle, depending on which herd replacements entered. Potentially this difference in post-partum interval could have affected the reproductive performance of the replacement animals. But because overall reproductive performance was generally good, resulting in a modest number of replacement animals being introduced to the experiment, this potential effect likely did not have a large impact overall.
Differences in cow BW and BCS among the 3 calving dates were expected because of differences in the relationship between cow nutri-ent requiremnutri-ents and forage nutrinutri-ent supply. In this study, supplemental protein was fed during periods of large deficiency in the forage relative to the cow’s requirement. Therefore, differences in BW and BCS presum-ably were more a result of differences in energy supply from the forage relative to energy requirement of the cows during the production year. Energy status is an important factor affecting cow performance (Stalker et al., 2006; Larson et al., 2009). During peak lactation energy requirements are greater than at any other time. The TDN content of native range in the Nebraska Sandhills is greatest in May (Lardy et al., 2004). In the Mar-calving treatment peak lacta-tion occurred about the same time as peak forage quality. However, in the Jun- and Aug-calving treatments en-ergy requirements are greatest during Aug and Oct, respectively. The nutri-ent contnutri-ent of native range declines precipitously as range plants mature and enter dormancy.
Grings et al. (2005) found BCS differences between spring and sum-mer calving cows similar to those observed in the present study. They reported summer calving cows had greater change in BCS throughout the production year compared with spring-calving cows. In contrast to the present study, they also reported summer-calving cows had lower BW at weaning than spring-calving cows. This difference in results between the 2 studies is likely due to the differenc-es in forage nutrient supply between the 2 research locations.
Calf BW gain from birth to wean-ing were consistent with Julien and Tess (2002) who found weaning BW decreased when calving and weaning occurred later in the year even though age at weaning was held constant. Average daily gain of calves in the present study were similar to results reported by Grings et al. (2005) where calves born in the spring were heavier at weaning than calves born in the
summer at a constant weaning age. Forage quality dynamics explain the difference in weaning weight. March-born calves grazed forage of markedly better quality than Jun- and Aug-born calves.
Effects of Wintering System
on Cow/Calf Performance
Main effects of winter manage-ment system on cow performance are presented in Table 3. Cow BW and BCS precalving (P > 0.20) and prebreeding (P > 0.22), and BCS at weaning (P = 0.57) were not dif-ferent between winter management systems. Percentage of cows which started the study that actually calved (calving rate) was not different (P
= 0.29) between wintering systems. Calving difficulty (P = 0.82) and calf vigor (P = 0.19) were not different between winter treatments. Percent-age of calves weaned per cow that started the study (weaning rate) was
also not different (P = 0.63). Winter treatment did not affect (P = 0.53) the percentage of cows that became pregnant (pregnancy rate) during the study. Winter feeding system did not influence calf BW at birth (P = 0.77) or weaning (P = 0.33). Additionally, calf ADG (P = 0.52) from birth to weaning and adjusted 205-d weaning BW (P = 0.56) were not different between wintering systems.
Anderson et al. (2005) reported BW and BCS before weaning were not dif-ferent between cows wintered on corn residue or stockpiled pasture. They showed cows wintered on corn residue had lower BW and BCS at weaning than cows wintered on pasture. How-ever, Larson et al. (2009) reported cows wintered on corn residue had greater BW at weaning than cows wintered on native Sandhills range even though BCS at weaning was not different. Also, Anderson et al. (2005) and Larson et al. (2009) showed no difference in pregnancy rates of cows
Table 2. Performance of cow/calf pairs calving in March, June, and August
Item March June August SE P-value
n/yr1 88 74 52 Cow BW Precalving, kg 532a 568b 625c 10 <0.001 Prebreeding, kg 478a 569b 585c 11 <0.001 Weaning, kg 493a 523b 516b 9 0.01 Cow BCS Precalving 5.3a 5.9b 6.6c 0.1 <0.001 Prebreeding 5.3a 6.1b 6.1b 0.1 <0.001 Weaning 5.2 5.1 5.1 0.1 0.15 Calf BW Birth, kg 37 38 38 1 0.66 Weaning, kg 237a 253b 229a 5 <0.001 205 d, kg 223a 186c 197b 4 <0.001 ADG, kg/d 0.91a 0.73c 0.78b 0.02 <0.001 Calving rate,2 % 98.9 96.8 96.3 2.0 0.44 Calving difficulty3 1.03 1.01 1.00 0.01 0.14
Calf vigor at birth4 1.01 1.01 1.01 0.01 0.95
Weaning rate,5 % 94.7 93.7 94.9 2.1 0.81
Pregnancy rate,6 % 93.5 93.0 90.3 1.8 0.37
a–cWithin a row, means with unlike superscript letters differ (P < 0.05). 1Number of pregnant cows that started the study each year.
2Percentage of cows at start of each year that subsequently gave birth to a live calf.
31 = no assistance, 2 = minor assistance, 3 = difficult assistance, 4 = cesarean section, 5 = abnormal presentation. 41 = nursed unassisted, 3 = nursed with assistance, and 5 = dead at birth.
5Percentage of cows at start of study each year that weaned a calf. 6Percentage of cows exposed to breeding that were pregnant at weaning.
wintered either on corn residue or stockpiled forage. In agreement with the results of the present study, Lar-son et al. (2009) reported similar calf performance from birth to weaning when cows were wintered on native Sandhills range or corn residue.
Effects of Calving Date
on Weaned Calf Performance
Effects of calving date on calf feed-lot performance of calf-fed steers are presented in Table 4. Only data from the calf-fed steers in each calving date treatment were used to evaluate the effect of calving date on feedlot per-formance. Dam wintering system did not affect calf feedlot performance (P
> 0.24; Table 5); therefore, data from steers born to dams assigned to both wintering systems were included.
At feedlot entry, calf-fed steers born in Jun (271 kg) were heavier (P < 0.01) than steers born in Aug (241
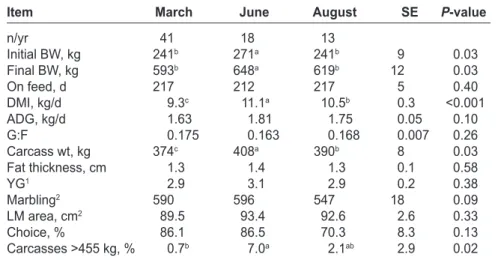
kg) and steers born in Mar (241 kg). This was a result of differences in age. Carcass weight followed the same pat-tern where steers born in Jun had the heaviest (P = 0.03) carcasses followed by steers born in Aug, and then steers born in Mar. Finished live BW for steers born in Jun was 55 and 29 kg greater (P < 0.01) than steers born in Mar and Aug, respectively. Dry matter intake was greatest (P < 0.01) for steers born in Jun, intermediate for steers born in Aug, and least for steers born in Mar. Marbling (P = 0.09), FT (P = 0.58), LM area (P = 0.33), and YG (P = 0.38) were not different. Percentage of carcasses that graded choice or better was similar (P = 0.13) among steers born in Mar, Jun, and Aug. June-born calves had the greatest number of steers with carcasses over 455 kg (P = 0.02).
Phillips et al. (2006) evaluated ef-fects of calving date on calf feedlot performance and reported lighter BW
at feedlot entry and less feedlot ADG of calves born later in the year. Phil-lips et al. (2006) weaned calves at 2 different ages within each calving date. Weaning age did not consistently affect feedlot ADG. Janovick-Guretzky et al. (2005) reported results similar to ours when they compared fall calving and spring calving.
Comparing the current study find-ings to previous research highlights the importance of age at weaning as a major factor affecting calf performance postweaning. Because Jun- and Aug-calving cows rapidly gained BCS post-weaning, Jun- and Aug-born calves could be weaned at older ages without decreasing cow BCS at weaning below the BCS of Mar-calving cows at wean-ing. Stalker et al. (2007) demonstrated calf efficiency of gain is improved with later weaning dates and that it is pref-erable to keep the calf with the cow if it does not compromise cow BCS or rebreeding performance.
Table 3. Performance of cow/calf pairs wintered on corn residue or native range
Item residueCorn Range SE P-value
n/yr1 82 81 Cow BW Precalving, kg 544 554 10 0.20 Prebreeding, kg 522 519 8 0.51 Weaning, kg 512 501 7 0.02 Cow BCS Precalving 5.5 5.6 0.2 0.31 Prebreeding 5.6 5.7 0.2 0.22 Weaning 5.1 5.1 0.1 0.57 Calf BW Birth, kg 37 37 1 0.77 Weaning, kg 243 246 4 0.33 205 d, kg 205 207 4 0.56 Calf ADG, kg 0.82 0.83 0.02 0.52 Calving rate,2 % 97.4 98.6 1.2 0.29 Calving difficulty3 1.02 1.02 0.01 0.82
Calf vigor at birth4 1.02 1.00 0.01 0.19
Weaning rate,5 % 93.8 94.7 1.8 0.63
Pregnancy rate,6 % 93.9 92.6 1.4 0.53
1Number of pregnant cows that started the study each year.
2Percentage of cows at start of each year that subsequently gave birth to a live calf.
31 = no assistance, 2 = minor assistance, 3 = difficult assistance, 4 = cesarean section, 5 = abnormal presentation. 41 = nursed unassisted, 3 = nursed with assistance, and 5 = dead at birth.
5Percentage of cows at start of study each year that weaned a calf. 6Percentage of cows exposed to breeding that were pregnant at weaning.
Effects of Dam Wintering
System on Weaned
Calf Performance
Main effects of maternal wintering system on calf performance are pre-sented in Table 5. Data from calf-fed steers born in Mar and Jun were used to determine the effect of maternal
wintering system on weaned calf per-formance.
Maternal wintering system had no effect on calf feedlot initial BW (P
= 0.54) or final BW (P = 0.67). In addition, feedlot performance includ-ing DOF (P = 0.77), DMI (P = 0.47), ADG (P = 0.62), and G: F (P
= 0.94) were not different between
wintering systems. Carcass weight (P
= 0.65), marbling score (P = 0.65), YG (P = 0.60), FT (P = 0.19), LM area (P = 0.79), percentage of cattle grading USDA choice or greater (P = 0.10), and the percent of carcasses 455 kg or greater (P = 0.17) were not af-fected by maternal wintering system. Larson et al. (2009) reported steer calves born to cows wintered on na-tive range or corn residue did not dif-fer in feedlot performance or carcass characteristics. Anderson et al. (2005) reported differences in performance of calves born to cows wintered on range compared with calves born to cows wintered on corn residue. However, in their study calves from cows wintered on corn residue were finished as year-lings and calves from cows wintered on pasture were finished as calf-feds. The results of the current study taken together with results of Larson et al. (2009) suggest corn residue is nutri-tionally equivalent to native Sandhills winter range.
Effects of Weaned Calf
Man-agement and Sex. Data from both
steers and heifers born in Jun and Aug were used to determine the effects of weaned calf management system and sex on feedlot perfor-mance. Interaction between calf sex and weaned calf management system occurred for FT; therefore, data are presented by calf sex and weaned calf management system.
Summer grazing ADG was greater (P = 0.002) for steers born in Jun than heifers (Table 6). Feedlot perfor-mance was affected by both weaned calf management system and sex. By design, initial BW at feedlot entry (P < 0.001) was less for calf-feds and finished BW was also less (P = 0.02) for calf-feds and yearlings. Days on feed were 57 and 80 d greater (P < 0.01) for calf-feds than yearling steers and heifers, respectively. Feedlot ADG (P = 0.01) and DMI (P < 0.001) were greater for yearlings, but G:F was not different (P = 0.45) between calf-feds and yearlings. Hot carcass weight was not different (P = 0.77) between calf-feds and yearlings, but LM area tended (P = 0.07) to be greater for calf-feds. Marbling score (P = 0.69),
Table 4. Feedlot performance and carcass characteristics of calf-fed steers born in March, June, or August
Item March June August SE P-value
n/yr 41 18 13 Initial BW, kg 241b 271a 241b 9 0.03 Final BW, kg 593b 648a 619b 12 0.03 On feed, d 217 212 217 5 0.40 DMI, kg/d 9.3c 11.1a 10.5b 0.3 <0.001 ADG, kg/d 1.63 1.81 1.75 0.05 0.10 G:F 0.175 0.163 0.168 0.007 0.26 Carcass wt, kg 374c 408a 390b 8 0.03 Fat thickness, cm 1.3 1.4 1.3 0.1 0.58 YG1 2.9 3.1 2.9 0.2 0.38 Marbling2 590 596 547 18 0.09 LM area, cm2 89.5 93.4 92.6 2.6 0.33 Choice, % 86.1 86.5 70.3 8.3 0.13 Carcasses >455 kg, % 0.7b 7.0a 2.1ab 2.9 0.02 a–cWithin a row, means with unlike superscript letters differ (P < 0.05).
1Calculated USDA YG.
2400 = slight00, 500 = small00, and so on.
Table 5. Feedlot performance and carcass characteristics of calves born to cows wintered on corn residue or native range
Item residueCorn Range SE P-value
n/yr 40 37 Initial BW, kg 273 276 4 0.54 Final BW, kg 622 618 9 0.67 On feed, d 199 200 5 0.77 DMI, kg/d 10.5 10.4 0.2 0.47 ADG, kg/d 1.78 1.77 0.06 0.62 G:F 0.170 0.170 0.005 0.94 Carcass wt, kg 390 392 4 0.65 Fat thickness, cm 1.36 1.30 0.04 0.19 YG1 3.0 3.0 0.1 0.60 Marbling2 594 589 19 0.65 LM area, cm2 91.3 91.0 1.5 0.79 Choice, % 87.7 80.9 6.3 0.10 Carcasses >455 kg, % 2.6 5.7 1.8 0.17 1Calculated USDA YG.
percentage of cattle grading choice or better (P = 0.85), and percentage of cattle with carcasses over 455 kg (P = 0.51) were not affected by weaned calf management system.
When data were adjusted to a constant FT, carcass weight was 29 kg heavier (P = 0.02) and the per-centage of carcasses weighing more than 455 kg was greater (P = 0.001) for yearlings compared with calf-feds. Marbling score tended (P = 0.08) to be greater for yearlings when data were adjusted to a constant FT.
Summer grazing ADG only tended to be greater (P = 0.09) for steers born in Aug than heifers (Table 7). Feedlot performance was affected by both weaned calf management system and sex. Again, by design, initial BW
at feedlot entry (P < 0.001) was less for calf-feds and finished BW was also less (P = 0.01) for calf-feds and year-lings. Days on feed were 59 and 80 d greater (P < 0.01) for calf-feds than yearling steers and heifers, respective-ly. Feedlot ADG (P = 0.01) and DMI (P < 0.001) were greater for yearlings, but G:F was greater (P = 0.02) for calf-feds. Hot carcass weight (P = 0.19) and LM area (P = 0.90) were not different between calf-feds and yearlings. Marbling score (P = 0.81), percentage of cattle grading choice or better (P = 0.26), and percentage of cattle with carcasses over 455 kg (P = 0.96) were not affected by weaned calf management system.
When data were adjusted to a con-stant FT, carcass weight was 26 kg
heavier (P = 0.02) but the percentage of carcasses weighing more than 455 kg were not greater (P = 0.45) for yearlings compared with calf-feds.
Multiple studies (Krehbiel et al., 2000; Sainz and Vernazza Paganini, 2004) report backgrounded steers produce heavier carcasses than contemporaries placed directly on feed after weaning. When cattle of a similar type are placed into different production systems, yearlings tend to be leaner and have poorer QG at harvest than calf-feds (Schoonmaker et al., 2002; Anderson et al., 2005). However, similar to the current study, Adams et al. (2010) reported no differences in QG when cattle were assigned randomly to calf-fed or yearling postweaning management
Table 6. Feedlot performance and carcass characteristics of calf-fed or yearling steers or heifers born in June
Item
Heifer Steer
SE
P-value1
Calf-fed Yearling Calf-fed Yearlings Sex Finish S × F
n/yr 17 15 18 18 Summer grazing Grazing, d 115 92 Initial BW, kg 251 266 5 0.002 ADG, kg/d 0.87 0.96 0.04 0.01 Feedlot Initial BW, kg 247 351 271 355 9 0.12 <0.001 0.22 Final BW, kg 560 569 628 653 9 <0.001 0.02 0.25 On feed, d 212 132 212 155 — — <0.001 — DMI, kg/d 10.1 11.5 11.1 12.2 0.2 <0.001 <0.001 0.17 ADG, kg/d 1.48 1.65 1.69 1.95 0.04 <0.001 0.01 0.13 G:F 0.158 0.150 0.163 0.164 0.008 0.04 0.45 0.31 Actual Carcass wt, kg 364 358 408 411 6 <0.001 0.77 0.32 Fat thickness, cm 1.35 1.27 1.39 1.27 0.06 0.71 0.04 0.69 YG2 2.7 2.9 3.0 3.0 0.1 0.03 0.41 0.18 Marbling3 602 616 602 599 35 0.57 0.69 0.58 LM area, cm2 93.1 86.1 93.5 93.0 1.9 0.07 0.07 0.10 Choice, % 83.0 91.2 86.9 81.3 9.1 0.67 0.85 0.34 Carcasses >455 kg, % 0.1 1.5 7.1 8.8 2.8 0.004 0.51 0.99 Fat adjusted4 On feed, d 213 160 206 170 11 0.81 <0.001 0.29 Carcass wt, kg 365 391 401 433 14 0.003 0.02 0.76 Marbling3 593 642 590 628 39 0.72 0.08 0.81 Choice, % 81.5 82.4 80.8 74.2 10.3 0.42 0.60 0.50 Carcasses >455 kg, % 10.0 19.6 14.8 36.8 6.2 0.02 0.001 0.19 1S × F = Sex × Finish.
2Calculated USDA YG.
3Marbling = 400 = slight00, 500 = small00, and so on. 4Data adjusted to a common fat thickness (1.27 cm).
systems. They also reported a 37 kg increase in HCW for yearlings com-pared with calf-feds. In the current study, actual HCW was 39 kg greater for yearlings compared with calf-feds, but when adjusted to a common FT endpoint yearlings were only 11 kg heavier than calf-feds.
By design, yearling heifers born in Jun weighed the same (P = 0.12) as yearling steers at feedlot entry and was achieved by lengthening the sum-mer grazing period for heifers (Table 6). However, final BW (P < 0.001) was 76 kg greater for steers than heif-ers. Dry matter intake (P < 0.001), feedlot ADG (P < 0.001), and G:F (P
= 0.04) were greater for steers. Steers had 49 kg greater (P < 0.001) HCW
than heifers, and LM area tended (P
= 0.07) to be greater for steers than heifers. In addition, steers produced more (P < 0.004) carcasses weighing more than 455 kg than heifers. When compared on an equal FT endpoint basis, steers had greater carcass ADG (P < 0.01), leading to a 39-kg increase (P = 0.003) in HCW, and steers still produced more (P = 0.02) carcasses weighing more than 455 kg.
Yearling heifers born in Aug en-tered the feedlot at the same (P = 0.12) BW as yearling steers because length of the summer grazing period was increased for heifers (Table 7). However, final BW (P < 0.004) was 42 kg greater for steers than heif-ers. Dry matter intake (P < 0.001),
feedlot ADG (P < 0.001), and G:F (P = 0.01) were greater for steers. Steers had 27 kg greater (P < 0.004) HCW than heifers, but LM area was not greater for steers than heifers. Carcasses weighing more than 455 kg was not different (P = 0.23) between steers and heifers. When compared on an equal FT endpoint basis, steers had greater carcass ADG (P < 0.01) leading to a 44 kg increase (P ≤ 0.001) in HCW, but steers did not (P = 0.19) produce more carcasses weighing over 455 kg.
Results from the current study are consistent with previous results in which steers produced greater HCW and had greater ADG than heif-ers (Tanner et al., 1970; Zinn et al.,
Table 7. Feedlot performance and carcass characteristics of calf-fed or yearling steers or heifers born in August
Item
Heifer Steer
SE
P-value1
Calf-fed Yearling Calf-fed Yearlings Sex Finish S × F
n/yr 12 12 12 12 Summer grazing Grazing, d 148 115 Initial BW, kg 230 240 10 0.04 ADG, kg/d 0.86 0.95 0.03 0.09 Feedlot Initial BW, kg 228 357 242 350 8 0.44 <0.001 0.06 Final BW, kg 531 593 601 606 15 0.004 0.01 0.03 On feed, d 217 158 217 137 — — <0.001 — DMI, kg/d 10.1 11.5 11.1 12.1 0.2 <0.001 <0.001 0.25 ADG, kg/d 1.40 1.50 1.66 1.88 0.07 <0.001 0.01 0.27 G:F 0.154 0.135 0.168 0.156 0.009 0.01 0.02 0.51 Actual Carcass wt, kg 345 374 391 382 9 0.004 0.19 0.03 Fat thickness, cm 1.27 1.36 1.31 1.09 0.06 0.04 0.23 0.01 YG2 2.6 2.8 2.8 2.7 0.2 0.61 0.99 0.25 Marbling3 584 597 543 520 27 0.02 0.81 0.39 LM area, cm2 89.3 92.9 93.0 90.1 4.1 0.87 0.90 0.28 Choice, % 86.3 81.0 68.5 53.3 10.8 0.03 0.26 0.58 Carcasses >455 kg, % 0.0 0.0 2.5 2.3 1.9 0.23 0.96 0.96 Fat adjusted4 On feed, d 227 166 231 178 13 0.40 <0.001 0.67 Carcass wt, kg 357 381 399 427 15 <0.001 0.02 0.88 Marbling3 602 593 554 584 30 0.25 0.66 0.42 Choice, % 79.3 70.6 71.4 76.3 9.2 0.87 0.78 0.33 Carcasses >455 kg, % 13.5 14.7 19.2 29.5 7.7 0.19 0.45 0.55 1S × F = Sex × Finish.
2Calculated USDA YG.
3Marbling = 400 = slight00, 500 = small00, and so on. 4Data adjusted to a common fat thickness (1.27 cm).
1970). Reports of carcass quality dif-ferences between steers and heifers are mixed. Tanner et al. (1970) reported no difference in QG, but Zinn et al. (1970) reported increased QG in steers. Results from the current study showed heifers did not have greater marbling scores.
IMPLICATIONS
Calving date affects cow BCS and calf growth rate pre- and postwean-ing. Wintering feeding programs uti-lizing corn residue yield results similar to native Sandhills winter range and do not affect cow or calf performance. Calf sex and choice of finishing as a calf-fed or yearling are important considerations in postweaning man-agement. These factors need to be considered within the context of the timing of their occurrence relative to seasonal changes in the cost of inputs and the value of outputs.
LITERATURE CITED
Adams, D. C., R. T. Clark, T. J. Klopfen-stein, and J. D. Volesky. 1996. Matching the cow with forage resources. Rangelands 18:57–62.
Adams, D. C., R. T. Clark, P. E. Reece, and J. D. Volesky. 1998. Research and education for managing resources within the Nebraska Sandhills: The Gudmundsen Sandhills Labo-ratory. Rangelands 20:4–8.
Adams, D. R., T. J. Klopfenstein, G. E. Erickson, W. A. Griffin, M. K. Luebbe, M. A. Greenquist, and J. R. Benton. 2010. Effects of sorting steers by body weight into calf-fed, summer yearling, and fall yearling feeding systems. Prof. Anim. Sci. 26:587–594. Anderson, R. V., R. J. Rasby, T. J. Klopfen-stein, and R. T. Clark. 2005. An evaluation of production and economic efficiency of two beef systems from calving to slaughter. J. Anim. Sci. 83:694–704.
Boggs, D. L., and R. A. Merkel. 1993. Beef carcass evaluation, grading, and pricing. p. 105 in Live Animal Carcass Evaluation and Selection Manual. D. L. Boggs and R. A. Merkel, ed. Kendall/Hunt Publishing Co., Dubuque, IA.
Bruns, K. W., R. H. Pritchard, and D. L. Boggs. 2004. The relationships among body weight, body composition, and intramuscular fat content in steers. J. Anim. Sci. 82:1315– 1322.
Griffin, W. A., T. J. Klopfenstein, G. E. Er-ickson, D. M. Feuz, J. C. MacDonald, and D. J. Jordon. 2007. Comparison of performance and economics of a long-yearling and calf-fed system. Prof. Anim. Sci. 23:490–499. Grings, E. E., R. E. Short, K. D. Klement, T. W. Geary, M. D. MacNeil, M. R. Haferkamp, and R. K. Heitschmidt. 2005. Calving system and weaning age effects on cow and prewean-ing calf performance in the Northern Great Plains. J. Anim. Sci. 83:2671–2683. Guiroy, P. J., L. O. Tedeschi, D. G. Fox, and J. P. Hutcheson. 2002. The effects of implant strategy on finished body weight of beef cattle. J. Anim. Sci. 80:1791–1800. Janovick-Guretzky, N. A., J. R. Russell, D. R. Stohbehn, and D. G. Morrical. 2005. Grazing and feedlot performance of yearling stocker cattle integrated with spring- and fall-calving beef cows in a year-round grazing system. J. Anim. Sci. 83:2696–2704. Julien, D. J., and M. W. Tess. 2002. Effects of calving date, weaning date, and duration of fall grazing on profitability in range beef cat-tle enterprises. J. Anim. Sci. 80:1462–1469. Klopfenstein, T., L. Roth, S. Fernandez-Rivera, and M. Lewis. 1987. Corn residues in beef production systems. J. Anim. Sci. 65:1139–1148.
Krehbiel, C. R., K. K. Kreikemeier, and C. L. Ferrell. 2000. Influence of Bos indicus
crossbreeding and cattle age on apparent utilization of a high grain diet. J. Anim. Sci. 78:1641–1647.
Lardy, G. P., D. C. Adams, T. J. Klopfen-stein, and H. H. Patterson. 2004. Building beef cow nutritional programs with the 1996 NRC beef cattle requirements model. J. Anim. Sci. 82(E. Suppl.):E83–E92. Larson, D. M., J. L. Martin, D. C. Adams, and R. N. Funston. 2009. Winter grazing system and supplementation during late ges-tation influence performance of beef cows and steer progeny. J. Anim. Sci. 87:1147–1155. May, G. J., L. W. Van Tassell, J. W. Wag-goner, and M. A. Smith. 1999. Relative costs and feeding strategies associated with winter/spring calving. J. Range Manage. 52:560–568.
May, S. G., H. G. Dolezal, D. R. Gill, F. K. Ray, and D. S. Buchanan. 1992. Effects of days fed, carcass grade traits, and subcutane-ous fat removal on postmortem muscle
char-acteristics and beef palatability. J. Anim. Sci. 70:444–453.
Phillips, W. A., E. E. Grings, R. E. Short, R. K. Heitschmidt, S. W. Coleman, and H. S. Mayeux. 2006. Effects of calving season on stocker and feedlot performance. Prof. Anim. Sci. 22:392–400.
Sainz, R. D., and R. F. Vernazza Paganini. 2004. Effects of grazing and feeding periods on performance and carcass traits of beef steers. J. Anim. Sci. 82:292–297.
Schoonmaker, J. P., S. C. Loerch, F. L. Flu-harty, H. N. Zerby, and T. B. Turner. 2002. Effect of age at feedlot entry on performance and carcass characteristics of bulls and steers. J. Anim. Sci. 80:2247–2254.
Stalker, L. A., D. C. Adams, T. J. Klopfen-stein, D. M. Fuez, and R. N. Funston. 2006. Effects of per- and postpartum nutrition on reproduction in spring calving cows and calf feedlot performance. J. Anim. Sci. 84:2582– 2589.
Stalker, L. A., L. A. Ciminski, D. C. Adams, T. J. Klopfenstein, and R. T. Clark. 2007. Effects of weaning date and prepartum protein supplementation on cow performance and calf growth. Rangeland Ecol. Manag. 60:578–587.
Stockton, M. C., D. C. Adams, R. K. Wilson, T. J. Klopfenstein, R. T. Clark, and G. L. Carriker. 2007. Production and economic comparison to two calving dates for beef cows in the Nebraska Sandhills. Prof. Anim. Sci. 23:500–508.
Tanner, J. E., R. R. Frahm, R. L. Will-ham, and J. V. Whiteman. 1970. Sire × sex interactions and sex differences in growth and carcass traits of Angus bulls, steers, and heif-ers. J. Anim. Sci. 31:1058–1064.
Tedeschi, L. O., D. G. Fox, and P. J. Guiroy. 2004. A decision support system to improve individual cattle management. I. A mechanis-tic dynamic model for animal growth. Agric. Syst. 79:171–204.
USDA. 2010. Average price paid for com-modities. Accessed Mar. 2011. http://www. nass.usda.gov.
Volesky, J. D., W. H. Schacht, and D. M. Richardson. 2004. Stocking rate and graz-ing frequency effects on Nebraska Sandhills meadows. J. Range Manage. 57:553–560. Zinn, D. W., R. M. Durham, and H. B. Hed-rick. 1970. Feedlot and carcass grade charac-teristics of steers and heifer as influenced by days on feed. J. Anim. Sci. 31:302–306.