e J A D E
electronicJournal of Agricultural and Development Economics
Agricultural Development Economics Division (ESA) FAO
available online at www.fao.org/es/esa/eJADE
Vol. 4, No. 1, 2007, pp. 146-193
Rural income generating activities in developing countries:
re-assessing the evidence
Gero Carletto
Development Research Group at the World Bank e-mail: [email protected]
Katia Covarrubias
Agricultural Sector in Economic Development Service, FAO e-mail: [email protected]
Benjamin Davis
Agricultural Sector in Economic Development Service, FAO e-mail: ([email protected]
Marika Krausova The World Bank e-mail: [email protected]
Kostas Stamoulis
Agricultural Sector in Economic Development Service, FAO e-mail:([email protected];
Paul Winters American University e-mail: [email protected]
Alberto Zezza
Food Security and Agricultural Projects Analysis Service, FAO e-mail: [email protected]
Abstract: This paper contributes to the understanding of the dynamics of developing country rural labour markets by re-evaluating the available evidence on the levels and composition of income sources adopted by rural households in order to understand the relationship between the various economic activities taking place in rural areas and their implications for economic growth and poverty reduction. This is achieved in two parts: First, the paper introduces the Rural Income Generating Activities (RIGA) database, a newly constructed FAO repository of household survey data, income measures and cross-country comparable indicators. Second, using the RIGA database, the paper undertakes a descriptive analysis of the agricultural and non-agricultural sectors of the rural economy, assessing the importance of rural non-farm activities within the complex income strategies adopted by rural households in developing countries and their relationship to poverty and inequality.
Key Words: rural economy, non-farm activities, income inequality, income diversification.
JEL: O12, O18, R23.
The designations employed and the presentation of material in this information product do not imply the expression of any opinion whatsoever of the part of the Food and Agriculture Organization of the United Nations concerning the legal status of any country, territory, city or area or of its authorities, or concerning the delimitation of its frontiers or boundaries.
I. Introduction
Despite the rapid process of urbanization observed in most developing and transition
countries, poverty still remains a predominantly rural phenomenon (IFAD, 2001). Not only do a majority of the poor live in rural areas, but also the severity of their destitution is, on
average, far greater than in urban areas. These trends are expected to persist in the foreseeable future. That being the case, it is critical that rural poverty is addressed in both poverty reduction strategies and, generally, as part of policies seeking to promote rural development. Correspondingly, it is important for developing countries and international development organizations to continue to assess approaches to rural development and their effectiveness in reducing rural poverty.
A widely accepted tenet of the development literature is that, in the process of structural economic transformation that accompanies economic development, the farm sector as a share of the country’s GDP will decline as a country’s GDP grows (Kuznets, 1957; Chenery and Syrquin, 1975). However, in rural areas, the outcome of economic growth on the agricultural and rural non farm (RNF) sector cannot be determined a priori. It is therefore useful, when thinking about rural development, to think of the full range of rural income generating
activities (RIGA), both agricultural and non agricultural, carried out by rural households. This can allow an understanding of the relationship between the various economic activities that take place in the rural space, and of their implications for economic growth and poverty reduction.
From a policy perspective, the challenge is how to assure that the growth of the RNF “sector” can best be harnessed to the advantage of poor rural households and how to identify the mechanisms to best exploit synergies across agricultural and non agricultural sectors. Only relatively recently, the nearly exclusive emphasis on smallholder agriculture in rural
development policy has come into question. The growing consensus is that although agriculture continues to play a central role in rural development, the promotion of
paper and in related research, we focus on the whole range of rural income generating activities, and not just on RNF activities.1
The available empirical evidence unequivocally points to the existence of a large and growing RNF economy. Previous estimates vary substantially across countries – with RNF income shares across continents ranging between 30 and 45% of rural income (FAO, 1998; Reardon et al., 2001). In terms of rural employment, based on census data, RNF activities involve about one job in four in Asia, West Asia and North Africa, with higher figures in Latin America (about one third) and lower in Africa (10 percent) (Haggblade et al., 2005). Furthermore, the limited evidence from recently developed countries suggests that this diversification increases as economies grow (Haggblade et al., 2005).
It would be misleading to see this growth in RNF in isolation from agriculture, as both form part of complex livelihood strategies adopted by rural households. High levels of income diversification are the norm among rural households. RNF activities are often countercyclical with agriculture and, as such, may serve as a consumption smoothing or risk insurance
mechanism, particularly when the returns to these activities are not highly-correlated with agricultural returns, and may also absorb excess labour during agricultural off-peak periods. Given the small-scale, informal and home-based nature of some RNF self-employment activities, they are often heralded as a promising strategic complement to agriculture for rural poverty alleviation.
Furthermore, the poverty and inequality implications of a growing RNF economy are not straightforward. They depend on a number of factors, including the level of access of the poor to RNF activities, the potential returns to RNF activities and the share of RNF activities in total income. Just as for agriculture, the ability of poor individuals to participate in potentially more lucrative RNF activities may be limited given barriers to entry in terms of liquidity or human capital constraints. When that is the case, a vicious circle may be established whereby poor households get relegated to low-return RNF activities that serve more as coping
strategies than as a way out of poverty. Again, there is no strong conceptual reason to separate
1
Rural income generating activities encompass agricultural production (crop, livestock), agricultural wage employment, non-agricultural wage employment, non-farm enterprises, transfers and non-labour income sources. In the remainder of this paper, RNF will be used as synonymous with non-agricultural, and includes all rural economic activities outside of agriculture. As such, it does not include agricultural wage income, which is part of agricultural activities.
RNF from agricultural activities, as in both cases one can reason in terms of the duality between dynamic and subsistence subsectors. This is a key reason why analyzing overall RIGAs may prove more fruitful than focusing simply on RNF activities.
Despite its growing importance and relevance for poverty alleviation and rural development and the expanding emphasis in the literature on these activities, certain aspects of the RNF component of RIGA remain poorly understood. Perhaps because of difficulties in adequately measuring and characterizing RNF activities, as well as an institutional gap among sectorally-based government ministries, its importance is often underplayed, and at times left out
completely, in the rural development discourse in many countries2. Given its relevance and growing importance, there is then the need to re-assess policies for poverty reduction and rural growth taking all RIGAs into adequate consideration.
While evidence exists on the importance of the RNF economy for rural areas, several limitations in the literature endure. For example, Lanjouw and Feder (2001) note that much of the observed variation among countries in the share of RNF activities stems from
weaknesses in the data being used. First, for many countries the data are outdated or missing altogether. For others, the only available data are case studies of limited geographical
coverage, and thus not nationally representative. For those countries for which employment data are available from population censuses, reported rates are most likely underestimated since they often only account for RNF activities when they are the primary occupation; however, for many rural households, RNF activities are only a secondary or even tertiary source of income, and as such, go unreported in census data. Although an increasing number of developing countries carry out nationally representative surveys, the available evidence on rural income shares remains scant. The most often cited cross country comparisons in FAO (1998) and Reardon et al. (2001) have aged and are based on non comparable surveys in different countries. For this reason, despite an increasing number of country or subnational level studies, comparable data are not available. The first part of this paper will aim at presenting a newly available dataset (what we will refer to as the RIGA dataset) and
illustrating in some detail the methodological problems that arise when analysing income data for rural areas in developing countries.
2
The academic discourse itself is quite compartmentalized. The debate on RNF is largely confined to
agricultural economists. Labor economists discuss issues of employment creation. Industrial economists focus on small and medium enterprises. Very little cross-fertilization appears to take place between these debates.
The data limitations of some of the previous RNF work suggest the need to carefully and systematically evaluate the current state of knowledge of rural income-generating activities and to assess the importance of RNF activities within the complex income strategies adopted by rural households in developing countries. This is necessary in order to identify clearly policy instruments that can be used to promote RNF activities within the broad range of RIGA activities in a manner that facilitates the reduction of rural poverty and fosters growth of the rural economy. The formulation of rural development policies will benefit from a greater understanding of the details of rural income generating activities and their relationship to poverty and inequality. This forms the subject of the second part of the paper.
The approach taken in this paper is mostly descriptive. Taking advantage of a unique database made available through a collaborative effort between FAO, the World Bank and American University3, in this paper we measure and re-assess the relative importance and composition of rural income generating activities, based on a database consisting of comparable income aggregates from a set of high-quality household surveys. This paper is part of a larger research effort in which, using the constructed database and this background analysis, we analyze more in depth a number of aspects of rural income generating activities in developing and transition economies, including the determinants of participation in RIGA employment, the distributional implications of participation in different activities and the spatial
dimensions of RIGA activities. Finally, as part of the project, a number of case studies are being conducted to explore institutional issues related to the growth of RNF component of RIGA activities.
The paper is organized as follows. In section II, we discuss some of the data issues with existing studies and datasets on the composition of rural incomes, and present the RIGA dataset with which we will address many of the current shortcomings. In section III, in order to set the context, we discuss a set of stylized facts on rural income in developing countries, as they emerge from a review of the empirical literature on rural income generating activities. In section IV, we perform a descriptive overview of the evidence provided by an analysis of the RIGA dataset, and a discussion of these stylized facts. Section V concludes with a
summary of the main results and some policy implications based on the findings of this paper.
3
II. The RIGA dataset
As noted above, existing RNF studies are plagued with a range of data problems that make cross country comparisons difficult and that sometimes hide biases in the estimation of different income (or employment) components. Data problems are common to both national survey data and case studies. The latter provide valuable insight into the role of RIGA in the rural economy but are not usually comparable to other studies since methods of data
collection and analysis are case study specific. When nationally representative data sources are available, income is generally not measured in a comparable fashion across countries. Although available studies are useful in identifying the broad range of RIGA activities, they are limited in providing general lessons about the sector. There is also a lack of detail on the sector and the specific activities that make up the RNF sector. Similar limitations apply to the study of the distributional implications of different RIGA activities.
Furthermore, much of the analysis is plagued with problems of poor data quality. Income data are notoriously problematic and underreporting, particularly of some income
components, is widespread. There are, indeed, objective difficulties in measuring income, in general, and the shares of different income generating activities in total income in particular. Some countries have even stopped collecting complete income data altogether so many household surveys lack sufficient information to adequately assess income composition.
Finally, RNF activities are often seasonal, informal activities, which are difficult to capture using traditional data collection methods. Partly for this reason, the relative importance of RNF income has been proxied using employment participation shares from population censuses. However, the use of population census data for this purpose is also plagued with problems. As mentioned earlier, censuses generally only collect information on the primary occupation, with consequent underreporting of secondary activities. Also, the self-reporting of participation into primary activities, often without a clear provision of definitions of the activities, is likely to lead to misclassifications. Furthermore, census data are quite limited and seldom contain suitable information on welfare status, thus making it difficult to carry out meaningful distributional analyses.
The discussion presented in this paper is based on the analysis of a unique database built from a pool of numerous Living Standards Measurement Study (LSMS) and other multi-purpose
household surveys which have been made available by the World Bank through a joint project with FAO. From this pool of possible surveys, the choice of particular countries was guided by the desire to ensure geographic coverage and heterogeneity across the four principal development regions – Asia, Africa, Eastern Europe and Latin America – as well as adequate quality and sufficient comparability in codification and nomenclatures. Furthermore, an effort was made to include a number of IDA (International Development Association) countries as these represent developing countries with higher levels of poverty and are therefore of
particular interest to donor agencies. Finally, since high quality and basic comparability of the data across countries was necessary in order to construct comparable income and
consumption aggregates, the appropriateness of the data collected was considered. Using these criteria, a selection of countries was made, a list of which is presented in Table A.1 in the Annex. While clearly not representative of all developing countries, the list does represent a significant range of countries and regions and has proved useful in providing insight into the income generating activities of rural households in the developing world.
Once the countries were selected, the next critical step was to construct income aggregates that were comparable across countries. This required resolving a host of issues that arose in the construction of the aggregates. The first key choice relates to the definition of rural and correspondingly which households are considered rural households for the analysis. Countries have their own methodologies by which they define what constitutes rural. It may make sense to use government definitions since presumably this definition reflects local information about what constitutes rural and it is the definition used to administer government programs. However, since government definitions tend not to be comparable across countries,
differences in results may be driven by the fact that rural is not being defined in the same way.4 While recognizing this problem, in this paper the available survey data do not allow for a straightforward alternative definition of rural and therefore the government definition is used.
4
In exploring this problem, de Ferranti et al. (2005) show there is significant variability across countries in Latin America and the Caribbean in the government’s definition of the rural population. Using an alternative definition of rural that incorporates population density and travel time criteria, the de Ferranti et al. study also argues that countries generally underestimate the size of the rural population. The bias in government definitions seems to be towards excluding rural towns from the definition of rural even though their economies are strongly linked to the natural resource base and the surrounding rural economic activity. This bias is likely to understate the relative importance of rural non-farm activities to the rural economy as a whole.
A second choice is to determine how to disaggregate income data in a manner that is consistent across countries. One common initial division is between agricultural and non-agricultural activities although defining this distinction in a concise manner is potentially problematic. Therefore, a second common division of income is created, for both agriculture and non-agricultural activities, between wage employment and self-employment.
Additionally, transfer payments, either from public or private sources, are included. For this study, seven basic categories of income have been identified for analysis: 1) crop production income; 2) livestock production income; 3) agricultural wage employment income, 4) non-agricultural wage employment income; 5) non-non-agricultural self employment income; 6) transfer income; and 7) other income.5 To facilitate the descriptive analysis, these seven categories are then aggregated in two ways: (1) the first three categories are grouped to make up agricultural activities while the latter four represent non-agricultural activities and (2) crop and livestock activities are combined to classify on-farm activities whereas
non-agricultural wage and self employment together make up non-farm activities. In addition to this classification, for most countries agricultural wage employment income and non-agricultural self employment income have been further disaggregated by industry using standard industrial codes.
A third choice relates to the unit of analysis. While it is most common to evaluate income-generating activities at the household level, there is some analysis conducted at the individual level. The value of looking at the individual level is that it gives a clear idea of how individual characteristics influence participation in and the level of income derived from different
activities. However, it is often difficult to determine individual income as the activities of one member of a household are likely to be jointly determined as part of an overall household strategy of income generation and diversification. The appropriate approach will depend on the questions being asked in the research. For this paper, the household was deemed the appropriate level of analysis both based on the view of the importance of the household as a social institution in which decisions are made and the availability of data at the household level.
For each of the countries listed in Table A.1, income aggregates for rural households were created as described. Furthermore, a comparable set of household variables was created in
5
order to conduct a basic analysis of the data. Other variables of household characteristics were also created with efforts being made to define them in a comparable manner across countries. As an indicator of welfare levels we used consumption expenditure aggregates created for the individual country specific poverty assessments. The final output is a series of twenty-three comparable datasets with a consistent set of variables.6
III. Stylized facts on rural income generating activities
From the literature on rural income generation, and in particular the literature on RNF
activities, a number of stylized facts emerge. In this section we present some of these stylized facts in order to set the stage for the later discussion of the content of the RIGA dataset.
1. RNF income makes up a large and growing share of rural income generating activities in all developing regions
While agricultural related activities still constitute the largest share of total income among rural households, a number of empirical studies show the growing importance of RNF activities in developing and transition countries. Surveys of these studies indicate RNF income represents on average 42% of rural income in Africa, 32% in Asia, 40% in Latin America and 44% in Eastern Europe and the CIS (Davis, 2004; FAO, 1998, Reardon et al., 2001). Aggregate statistics on the non-farm economy reported by Lanjouw and Feder (2001) confirm this range of results for RNF employment across countries. These studies also suggest the RNF economy is expanding and is likely to continue to increase its share of total rural income in the future.
While available data indicate the importance of the RNF economy in general, there is considerable variation across countries. For Latin America and the Caribbean, estimates of RNF income shares for rural households range from 22% in Honduras to 59% in nearby Costa Rica and 68% for Haiti (Reardon et al., 2001). For Africa, estimates range between 15% for Mozambique to 93% for Namibia (Reardon, 1997). Even more recent data for Eastern Europe and the CIS indicate a range from 31% in Armenia and 68% in Bulgaria (Davis, 2004).
Few data sources exist that allow consistent measurement of the change in the importance of RNF over time. The evidence that does exist overwhelmingly points, however, to an
6
increasing role of RNF in rural income and employment. Evidence in this direction is provided for Latin America by FAO (1998) and Reardon et al. (2001) and for Asia by
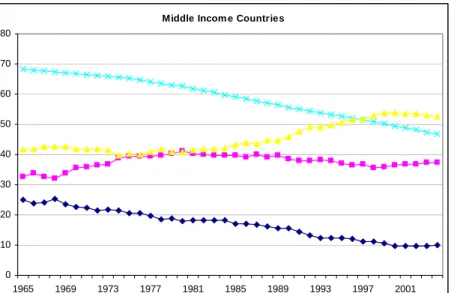
Haggblade et al. (2005). This is consistent with the general observation on the secular decline of agriculture put forward by Chenery and Syrquin (1975), as shown using aggregate figures in Figure 1.
Figure 1. Sectoral shares in GDP, 1965 – 2004
Middle Incom e Countries
0 10 20 30 40 50 60 70 80 1965 1969 1973 1977 1981 1985 1989 1993 1997 2001
Low er Middle Incom e Countries
0 10 20 30 40 50 60 70 80 1965 1969 1973 1977 1981 1985 1989 1993 1997 2001
Low Incom e Countries
0 10 20 30 40 50 60 70 80 90 1965 1969 1973 1977 1981 1985 1989 1993 1997 2001
Agriculture, value added (% of GDP) Industry, value added (% of GDP)
Services, etc., value added (% of GDP) Rural population (% of total population) Source: World Bank, World Development Indicators.
2. The composition of RNF activities changes over time, as the economy develops
The FAO (1998) characterizes three broad ‘stages’ of transformation of the rural economy. A first stage is one in which both production and consumption linkages between the farm and non farm sector are very strong and rural-urban links still relatively weak. During this stage, the main non-farm activities tend to be mainly in areas upstream or downstream from agriculture. The second stage is characterized by a lower share of households directly
dependent on agriculture, and greater rural-urban links. Services start taking off more strongly and new activities like tourism are started, while labour-intensive manufacturing in rural areas finds increasing competition from more capital intensive urban enterprises and imported goods. The third stage is characterized by a maturing of the trends that emerged in stage two: stronger links with the urban sector, and employment and income increasingly generated in sectors with little or no relation to agriculture. Again, these broad trends mirror the broad macro trends in the sectoral composition of the economy observed in Figure 1.
Contrary to the conventional wisdom of development practitioners, manufacturing is rarely the main component of the RNF economy. As shown by Haggblade et al. (2002) it normally accounts for only 20-25 percent of total RNF employment and, when overtime comparisons are possible, it is usually found to be declining in relative importance, being more subject to competition from urban sector producers than service or construction activities, strengthening the urban-rural link. Migration income is often reported to account for a small share, even in countries with high emigration rates. In rare instances, however, migration may represent a considerable share of overall income, as in the case of those Southern Africa countries where the proximity of mining activities generates large migration and significant transfers
(Haggblade et al., 2005). The evidence on the impressive growth of migration flows, and the consequent remittances, experienced by many developing and transition countries in recent years, is yet another factor which is likely to have altered the income composition of rural households and may deserve re-assessment.
3. The impact of different RIGA activities on poverty and inequality depends on overcoming constraints in access to activities with higher returns
Along with the heterogeneity in the types of RIGA activities rural households are involved with, there is also significant variation in the returns offered by participation in these different
activities. For both agricultural and non agricultural income generating activities, there is on the one hand a high productivity/high income sub-sector, confined mostly among privileged, better-endowed groups in high potential areas. There are usually significant barriers to entry or accumulation to these high returns sections, in terms of land size and quality, education and other key productive assets. Entry barriers may prevent vulnerable groups, including women, from participating and seizing the opportunities offered by the more dynamic segments of the RNF sector. Entry barriers may result from a combination of lack of capacity to make
investments in non farm assets and the relative scarcity of low capital entry RNF activities (Reardon et al., 2000).
On the other hand, there is usually a low productivity segment, which serves as a source of residual income or subsistence food production, a “refuge” for the vast majority of the rural poor. This low productivity segment includes subsistence agriculture, seasonal agricultural wage labour and various forms of off-farm self employment. Although very low, the resources generated through these often informal and irregular activities provide a “last resort” to ensure food security and complement the inadequate resource base, an indispensable coping mechanism to reduce the severity of deprivation and avoid more irreversible processes of destitution to take place.7
These dual sectors often feed into each other: for those with fewer assets, seasonal and inadequate income from subsistence agriculture, combined with a pervasive poor access to liquidity and credit, forces diversification into poorly remunerated off-farm activities. Households able to overcome financial or asset constraints may diversify or specialize in higher-return agricultural and non agricultural activities, depending on improved access to specific assets, favourable household demographics, and the functioning of local labour and credit markets. The observed dualism also appears to be drawn along gender lines, with women more likely to participate in the least remunerated agricultural and non agricultural activities.
Given the existence of both low and high return RNF activities, and the different
predisposition by households to overcome barriers to entry, previous empirical studies have
7
See Lanjouw and Lanjouw (2001) and Lanjouw and Feder (2001) for a general discussion relevant to non farm activities and Fafchamps and Shilpi (2003) for Nepal, Davis and Stampini (2002) for Nicaragua and Azzarri et al. (2006) for Malawi regarding the role of agricultural wage labor.
shown a wide variety of results in terms of the relationship of RNF activities to poverty. Part of the ambiguity of the available findings derives from methodological differences. Older studies reviewed in FAO (1998) found a higher share of RNF income among poorer rural households in Pakistan and Kenya and a higher share among richer households in Niger, Rwanda, Mozambique and Vietnam. More recently, Lanjouw (1999) and Elbers and Lanjouw (2001) for Ecuador, Adams (2000) for Jordan and Isgut (2004) for Honduras find that the poor have a lower share of income from RNF activities than the non poor, while Adams (2002) finds the opposite for Egypt. De Janvry, Sadoulet and Zhu (2005) find that RNF reduces poverty in China, and particularly the severity of poverty, and that RNF activities have played a key role in falling poverty rates in China, as RNF activities provide an alternative to small landholdings. In their study of India, Lanjouw and Shariff (2002) find that the importance of RNF activities by income level varies by state. For those states with a high share of income from RNF activities, the shares are greater for better-off households; for those states with a lower share of income from RNF activities, the opposite is true. This stems in part from the type of RNF activities associated with poverty status. The share of income from casual wage employment is highest among the poor, while the share from regular wage employment is highest among the rich.
4. No clear cut a priori hypothesis regarding relationship between diversification and wealth status
As said, rural households often employ diversified income generation strategies which include a variety of both agricultural and non agricultural activities. Even among purely agricultural or specialized RNF households, a high level of diversification is observed within the sector. A rural household may embark in multiple activities for a variety of reasons: as a response to market failures, such as in credit markets, and thus earning cash to finance agricultural activities, or insurance markets, and thus spreading risks among different activities; shrinking opportunities and deteriorating terms of trade in agriculture; failure of any one activity to provide enough income; different skills and attributes of individual household members. Also, often being countercyclical with agriculture, RNF activities, particularly if not
highly-correlated with agriculture, serve as a consumption smoothing or risk insurance mechanism.
Regardless of the specific motive behind the household decision to diversify, the expected welfare improvements do not always materialize. The empirical relationship between
diversification and income level is ambiguous, and even the conceptual underpinning on the direction of the relationship is not straightforward8. A reduction in diversification as
household wealth increases could be a sign of specialization. An increase in diversification as household wealth increases could be a sign of using profitability in one activity to overcome barriers to entry in a second activity, or the complementary use of assets between activities. Similarly a reduction in diversification as household wealth decreases could indicate an inability to overcome barriers to entry in a second activity. Further, an increase in
diversification as household wealth decreases could be a sign of “distress” diversification, i.e. driven by economic survival.
IV. Characterizing RIGA in developing countries 1. Participation in rural income generating activities
To begin the analysis of RIGA, we look at the level of participation in different activities by rural households. The definition of participation used here is the receipt of any income by any household member from that activity. Table A.2 in the Annex presents data on participation rates for all RIGAs for the countries included in this analysis as well as a breakdown between agricultural and non farm activities. The results from Table A.2 are summarized in Figure 2, showing participation rates according to this breakdown.
8
For a summary of the available empirical evidence, see Haggblade et al. (2005), reporting on a number of review studies, covering about 120 household surveys in developing countries.
Figure 2: Participation in Farm vs. Non Farm Activities 0% 10% 20% 30% 40% 50% 60% 70% 80% 90% 100% Alb ania 20 02 Alban ia 2 005 Bulg aria 199 5 Bulg aria 2 001 Gh ana 199 2 Gha na 199 8 Ma daga scar 199 3 Mal aw i 20 04 Nig eria 2 004 Ecua dor 19 95 Ecua dor 19 98 Gua tem ala 20 00 Nica rag ua 200 1 Pana ma 19 97 Pana ma 20 03 Bang lade sh 2 000 Indon esia 19 93 Indon esia 20 00 Nepal 199 6 Paki stan 19 91 Paki stan 20 01 Viet nam 1992 Viet nam 1998
Farm (Crop, Livestock) Non Farm (Wage, Self Employment)
The vast majority of rural households in each country of the RIGA dataset participate in on-farm activities. The share ranges from 54 to 99 percent by country, with an unweighted average participation rate of 86.2 percent. For non-farm activities, the overall participation rate stands at about 47.7%, while the range of variation across countries is much greater than for agriculture. Bulgaria has the lowest rate of RNF participation at 22 percent while Pakistan has the highest at 67.6 percent. In twelve of the data sets, the rate of participation in non-farm activities is between 50 and 60 percent. In general, the results indicate higher participation rates in non-farm activities in Latin America and Asia compared to other regions. Taken together, the high incidence of both farm and non-farm activities points to highly diversified RIGA portfolios at the household level in each country. We explore the extent of this
Figure 3: Participation Rates among Non Agricultural Income Activities 0% 10% 20% 30% 40% 50% 60% 70% 80% 90% 100% Alban ia 2 002 Alb ania 20 05 Bulga ria 1 995 Bulg aria 2 001 Gha na 1 992 Gha na 1 998 Mada gasc ar 1 993 Mala wi 2 004 Nig eria 2004 Ecua dor 199 5 Ecua dor 19 98 Gua tem ala 2 000 Nicara gua 2 001 Pana ma 199 7 Pana ma 2 003 Bangla des h 2 000 Indo nesi a 19 93 Indon esia 2000 Nep al 1 996 Pak ista n 199 1 Pakis tan 200 1 Vietn am 1 992 Viet nam 19 98
Non-farm wage employment Non-farm self-employment Transfers
In Figure 3, participation rates in non-agricultural activities are disaggregated into wage employment, self employment and transfers. A number of patterns emerge. First, the shares of household receiving transfers, whether private or public, are higher in Eastern European countries. This is due to the fact that these former socialist economies still have large pension programs and in some cases large scale out-migration that has led to significant levels of private transfers, or remittances. Malawi also shows a very high incidence of transfers, as a result of a combination of informal and formal safety nets from private and public entities. While the rates of self employment participation are lowest for the Eastern Europe region, in the other regions participation rates are generally highest for this category. Wage
employment is also clearly important, with more than 20 percent of households participating in all the countries outside of Africa.
Figure 4. Participation Rates - Agriculture Related Activities 0% 10% 20% 30% 40% 50% 60% 70% 80% 90% 100% Alban ia 20 02 Alba nia 20 05 Bul garia 1995 Bul garia 200 1 Ghan a 19 92 Ghan a 19 98 Mada gas car 19 93 Mal awi 2 004 Nige ria 2 004 Ecua dor 1 995 Ecu ado r 199 8 Guat ema la 2 000 Nicar agua 200 1 Pan am a 19 97 Panam a 20 03 Bang lade sh 2 000 Indo nesi a 199 3 Indon esia 200 0 Nepa l 1996 Pakis tan 1991 Pakis tan 2001 Vietn am 1 992 Vietn am 1 998
Agriculture-Crops Agriculture - Livestock Agricultural wage employment
Similar patterns emerge after disaggregating agricultural activities into its different sub-components, namely crop, livestock and agricultural wage income. All countries have a high incidence—at least 70 percent—of rural households participating in the production of crops, with an overall unweighted average of 74.4 percent. Livestock activities are only slightly less common. All countries have at least approximately half of rural households participating in livestock activities, with an unweighted average of 68 percent. Malawi is a notable exception, with a notoriously underdeveloped livestock sector and just short of four rural households in ten owning animals. Participation in agricultural wage labour shows much more regional variation. Relatively few rural households in Eastern Europe work in agricultural wage labour; roughly 20 to 40 percent do so in Latin America, Asia and Madagascar, while over 50 percent participate in agricultural wage labour in Malawi, where it is referred to as ganyu
labour.
2. Income shares from rural income generating activities
Consistent with one of the central tenets of structural transformation theories – i.e. the expected decline of agriculture as the economy develops – the analysis of the RIGA dataset confirms the existence of a strong negative association between countries’ GDP per capita level and the share of agriculture in rural incomes, with a significant coefficient of -0.15 (Figure A.1 in Appendix I). Furthermore, the share of wage employment in total employment
is also expected to be positively related to the level of GDP, whereas the share of self-employment income in total income would tend to decline. The RIGA dataset also confirm this assumption, with a significant coefficient of 0.06 between the share of non-agricultural wage income and the level of GDP (Figure A.2 in Appendix I); although the coefficient for self employment income is not significant (not shown in Appendix I), it is negative, indicating the direction of the correlation supports the hypothesis. Meanwhile, the share of income from transfers does demonstrate a positive and significant relationship with the GDP level (also not shown).9
The next step is to examine the relative importance of these activities for income generation. This is done by looking at the share of total income that is derived from each activity. Table A.3 in Appendix I shows the share of household income from the different income generating activities for all countries in the RIGA dataset. Figure 5 provides a summary of the shares of total income represented by the seven income generating activities. First, note that although the overwhelming majority of households is involved in agriculture, the income received from those activities is in many cases lower than that from non-farm activities. Taken together, agricultural activities (crops, livestock and agricultural wage) represent between 25 and 80 percent of income generated by rural households and on average 53.4 percent of total income generated. On the other hand, income from RNF activities represent between 20 and 75 percent of total income with an average of 46.6 percent. Of the data sets analyzed, nine out of twenty-three have 50 percent or more income from rural non-farm activities.
9
Figure 5: RIGA income shares 0% 10% 20% 30% 40% 50% 60% 70% 80% 90% 100% Alba nia 200 2 Alba nia 200 5 Bul garia 199 5 Bul garia 20 01 Ghana 199 2 Ghana 199 8 Mad aga scar 199 3 Mal awi 2 004 Nig eria 20 04 Ecua dor 1 995 Ecua dor 1 998 Guat ema la 20 00 Nic arag ua 2 001 Pan ama 199 7 Pan ama 200 3 Ban glade sh 2 000 Indon esia 199 3 Indon esia 200 0 Nepal 1996 Paki stan 19 91 Paki stan 20 01 Viet nam 1992 Viet nam 1998
Crops Livestock Agricultural wage RNF wage RNF self-employment Transfers Other
Looking at the agricultural activities, there is important variability in which activity is most important and few clear patterns emerge. For the African countries, crop production appears to generate most of the agricultural income. For the other countries, there is significant variation with livestock the most important in Albania (2002, 2005), Bulgaria (1995, 2001) and Nepal, agricultural wage the most important in Bangladesh, Ecuador (1998), and Nicaragua, and crop income the most important in the remaining countries. For RNF activities, transfers are clearly important in Eastern Europe and less so elsewhere. As previously seen for participation rates in Malawi, more than nine households in 10 receive some form of transfer, whether public or private, in cash or in kind, and although total transfers represent a relatively small income share, they provide an important coping
mechanism for a large share of poor rural households. Non-agricultural wage employment is generally most important in the other countries with the exception of all the African countries, Ecuador (1998), Indonesia (1993) and Vietnam (1992, 1998) where self-employment
produces a higher share of income, and, in the case of Africa and Vietnam, rural labour markets are thin.
Taken together, the results of this analysis confirm previous findings that the rural non-farm economy plays a critical role in the income generation of rural households. In fact, the results
suggest that it may be even more important than previously recognized, exceeding in many cases 50 percent of rural income which is somewhat larger that the 40 percent of rural income often cited in the literature. Another finding, which is less frequently highlighted in the rural non-farm literature, is the widespread receipt of transfers from public and private sources. In all of the data sets except Nigeria, over 25 percent of the households receive some form of transfer and in ten cases participation rates exceed 50 percent. However, only in a few cases, particularly in Eastern Europe and Indonesia, do these participation rates translate into more than 20 percent of household income. In fact, in general, while the breakdown between farm and rural non-farm activities by countries suggests some consistency in the importance of the rural non-farm economy, this consistency hides significant variability across countries in the importance of particular income activities.
Figure 6: Breakdown of non farm wage and self employment incomes
0% 10% 20% 30% 40% 50% 60% 70% 80% 90% 100% Alb ania 2 002 Alb ania 2 005 Bulg aria 1995 Bulga ria 200 1 Gha na 199 2 Gh ana 199 8 Mad agas car 1993 Mal awi 200 4 Nige ria 2 004 Ecua dor 19 95 Ecua dor 19 98 Guat em ala 2000 Nica ragua 200 1 Pana ma 19 97 Pana ma 20 03 Ban glades h 20 00 Indo nes ia 19 93 Indo nes ia 200 0 Nepa l 1996 Paki stan 1991 Paki stan 200 1 Viet nam 199 2 Vietn am 19 98
Manufacturing Utilities Construction Commerce Transport Services Other
The non farm wage and self employment component of RNF income can be further broken down according to its sectoral composition, as shown in Table A.4 and Figure 6. Seven sectors in total are identified – manufacturing, utilities, construction, commerce, transport, services and others.10 This sector can be even further disaggregated revealing a broad range of industrial activities in which households are occupied. Overall, services represent by far the most important industrial sector for the rural non-farm economy, measuring over one third of
10
the share of rural non farm income generated. Services are followed at a distance by manufacturing, commerce and construction, all hovering been 14 and 18 percent.
Manufacturing plays even less of a role, in terms of shares of total income, than that referred to by Haggblade et al. (2002).
The relative importance of these categories tends to vary across countries. Though services dominate as the largest contributor to non-farm wage income in most of the countries, the weight of this sector is not equal across countries, and in several cases other sectors are more significant. Services makes up one-third or less of total wages for Albania 2005, Ecuador (1995, 1998) Guatemala and Vietnam (1998) yet it is closer to one-half to two-thirds for Ghana (1992), Malawi and Nigeria. For Bulgaria (1995, 2001) the commerce sector accounts for 53 to 58% of wage income whereas manufacturing constitutes the highest share of income in Bangladesh, Indonesia (1992) and in Vietnam (1992).
3. Income shares over time
The data also allow us to draw some conclusions regarding changes over time in RIGA activities in the eight countries with multiple data sets: Albania, Bulgaria, Ecuador, Ghana, Indonesia, Pakistan, Panama and Vietnam. Confirming the expected trend, seven out of the eight countries show a decrease in the share of income from agricultural activities over the different time periods, and a corresponding increase in non-agricultural activities. The corresponding increase in non-agricultural income in each country is driven by a different source or combination of sources: transfers in Bulgaria and Pakistan, non farm wage and self employment in Albania and Ecuador, both non farm wage labour and transfers in Pakistan and a small increase in each of the non farm activities for Ghana. When gauged, however, by participation rates, a loss in importance in on-farm activities is matched by a corresponding increase in non-farm activities only in three cases (Bulgaria, Ecuador, Indonesia). In Panama and Pakistan, participation in both on-farm and non-farm activities drop, perhaps indicating an increase in specialization among households in those countries, whereas in Albania, Ghana and Vietnam both non-farm and non-farm activities increase in importance, which may conversely point to increased diversification among those countries’ households over time.
4. RIGA and poverty
In this section, we present a descriptive analysis of the relation between participation in non-agricultural activities – and the resulting income shares – and welfare levels, as measured by total household per capita expenditure. The full set of descriptive statistics is reported in Tables A.5-A.6 in Appendix I. Given the importance of household ownership of assets in terms of access to different RIGA, the analysis is repeated with respect to land ownership quintiles; results are shown in Tables A.7-A.8.11
Although some differences exist across countries, in the overwhelming majority of cases we find a positive trend between household welfare status and participation in RNF activities. That is, as we move across the wealth quintiles from poorer to wealthier, an increasing share of households have participated in RNF activities. Within RNF activities, the strongest
positive relationship is observed for wage labour: in most of the countries, aside from Albania (2002) and Pakistan (2001), better-off households are more likely to participate in
non-agricultural wage labour. With the notable exceptions of Madagascar and Pakistan (1991, 2001), similar trends are shown for non-farm self-employment, while the relation with public and private transfer is not as clear-cut. This latter result is not surprising given the mix of public and private transfers, with different motivations and rules behind the generation of these types of transfers.
On the other hand, surprisingly, with very few exceptions, and even among households in the top wealth quintile, no sizable differences are detected in terms of participation in on-farm activities. Regardless of the level of household welfare, the large majority of rural households have on farm economic activities. Diversification into both agricultural and non agricultural income generating activities is thus the norm, rather then the exception. Higher participation in agricultural wage employment, however, is generally associated with lower income levels, confirming its role as a coping or survival mechanism for poor households in rural areas. Similar patterns emerge when analyzing income composition by wealth quintiles. Agricultural based sources of income—both on farm and agricultural wage labour—are most important for the poorest households. In all but six countries the principal source of income for the poorest quintile is farm derived. For three of these six datasets (Bangladesh, Nicaragua and Nepal),
11
Further analysis of asset endowment and activity participation in a cross-country context is presented in Davis et al. (2007).
the poorest quintile earns the largest share of income from agricultural wage labour while for the other cases (Bulgaria 1995, 2001 and Pakistan 2001) the largest share comes from
transfers. Moreover, among many countries the second most important income-earning activity among the poorest households is agricultural: for five datasets it is agricultural wage labour (Ecuador 1995, 1998; Guatemala, Malawi and Panama 2003), and for five it is farm production (Bulgaria 1995, 2001, Nepal, Nicaragua and Pakistan 2001).
While income from RNF activities comprises a higher share of total income in the upper income quintiles, agricultural income also contributes to a substantial share of the income among better off households. In Ghana (1992), Madagascar, Malawi, Nigeria and Nepal, among households in the top quintile agricultural sources of income make up more then half of total income. Most of this income is derived from on farm crop production. Further, for 13 datasets12, farm income constitutes the single largest source of income among households in the top quintile. Self employment is the top category for Ecuador (1998) and Nicaragua, transfers for Albania (2002, 2005), Bangladesh, Bulgaria (2001) and Indonesia (2000) and non-farm wage employment for Guatemala and Panama (1997, 2003).
Land ownership is perhaps the most important productive asset available to rural households in developing countries. For many countries in the RIGA dataset, the vast majority of rural households own land, as seen in Table 1. It should be noted that it is possible to understate land-ownership since land regimes across countries are variable; whereas land ownership may be a clear concept in one country, in others land-sharing may be more common or, as in Vietnam, land ownership is subjective since all land is officially owned by the state. Despite considerable fluctuations across countries and land quintiles, overall we find sizable participation in non-agricultural activities regardless of household access to land, with participation rates well above 50 percent, and in some countries reaching even 100 percent, due particularly to the receipt of transfers. When looking across land quintiles, however, in the vast majority of countries, no clear pattern is discernible. Only in four cases (Albania 2002, Pakistan 2001, Vietnam 1992, 1998) a clear negative relationship between land ownership and agricultural participation emerges. Even if we consider only non-agricultural wage and self-employment, and exclude transfers, the trends are equally
12
Bulgaria (1995), Ecuador (1995), Ghana (1992, 1998), Indonesia (1993), Madagascar, Malawi, Nepal, Nigeria, Pakistan (1991, 2001) and Vietnam (1992, 1998)
ambiguous, with only a few surveys (Ecuador 1995, Malawi 2004, Pakistan 1991, 2001 and Vietnam 1992, 1998) showing a marked negative pattern.
Table 1. Access to own land
Percent of Rural Households Owning Land Africa Ghana 1992 44.9% Ghana 1998 34.6% Madagascar 1993 74.6% Malawi 1997 86.3% Malawi 2004 91.4% Nigeria 2004 70.1% Asia Bangladesh 2000 49.1% Indonesia 1993 --- Indonesia 2000 42.8% Nepal 1996 79.2% Pakistan 1991 31.9% Pakistan 2001 32.7% Vietnam 1992 85.4% Vietnam 1998 90.2% Eastern Europe Albania 2002 88.3% Albania 2005 93.9% Bulgaria 1995 70.1% Bulgaria 2001 65.2% Latin America Ecuador 1995 57.8% Ecuador 1998 58.4% Guatemala 2000 51.6% Nicaragua 2001 41.5% Panama 1997 38.8% Panama 2003 50.9%
Note: No land ownership data for Indonesia 1993. Source: Authors’ calculations using RIGA database.
As would be expected, and in line with previous findings, landless households often have higher participation rates in wage employment (agricultural and non-agricultural) than land-owning households. Among the landless in Latin America and Asia, agricultural wage employment records notable participation. Further, for all land quintiles, agriculture wage employment remains a particularly important activity across all countries, except for Albania and Ghana; with participation peaking at nearly 55 percent in Malawi. In this country, ganyu
agricultural labour, remains one of the main sources of income and an important coping strategy for the majority of poor smallholders, reflecting the inadequate size of their landholdings and their overall skills set for participation in other activities.
The trends in participation rates for self-employment and on-farm activities are also note-worthy. Participation in non-farm self-employment is more prevalent among landless and small-holder households and tends to decline with increased land-ownership. For twelve of the surveys, this trend is unambiguous. For a few surveys (Bulgaria 1995, 2001; Madagascar 1993; Panama 1997, 2003; Indonesia 2000), a U-shaped trend, or a variation on the U-shape, is observed, re-establishing that among the landless, the non-farm activities sector is
important, but also indicating that land-wealthy households participate in this sector more than the other land-owning groups, insinuating a possible relationship between the ownership of land assets and other capital assets. Interestingly, though the landless generally have higher rates of participation in the non-agricultural sector than land-owning households, they still demonstrate notable participation in on-farm activities. In all but four of the RIGA datasets (Albania 2002, 2005; Bulgaria 2001 and Indonesia 2000), household participation in crop and livestock activities is from 55 to 95 percent, indicating many households are able to access land in other ways and choose to invest in agriculture.
Turning to sources of income by land ownership quintiles, in a number of countries even the landless and near landless groups earn a significant proportion of income from on farm crop and livestock income, re-confirming the availability of land through a rental market; this is the case for Bulgaria (1995), Ghana (1992, 1998), Madagascar, Nigeria, Pakistan (1991) and Vietnam (1992), where the on-farm income share among the landless and near-landless is at least 25 percent. Conversely, for the remaining set of countries, landless and near-landless households earn higher shares of their income from non-agricultural sources. Somewhat surprisingly, in only 8 countries (Albania 2002; Ghana 1992; Nicaragua; Nigeria; Pakistan 1991, 2001; and Vietnam 1992, 1998) the relation between land holdings and non-agricultural income shares is negative. In most of the remaining cases, the relationship is not monotonic and at times not following any discernible pattern. The pattern is somewhat different if we only consider non-agricultural wage and self-employment. One notable example is Albania 2005, where once transfers are netted out, the negative relationship between non-farm income shares and land ownership quintiles becomes clearer.
The relationship between landholdings and non-farm enterprise income varies substantially across countries; while, irrespective of landholdings, the shares are quite low for some land quintiles, such as in Albania and Bulgaria, countries like Bangladesh, Ecuador, Ghana, Indonesia (2000) and Vietnam derive significantly higher shares of their income from these
activities. The sign of the relationship with landholdings, however, is not consistent; only for Ghana 1992, Nigeria, Pakistan and Vietnam can a clear negative relation be identified.
5. Income diversification
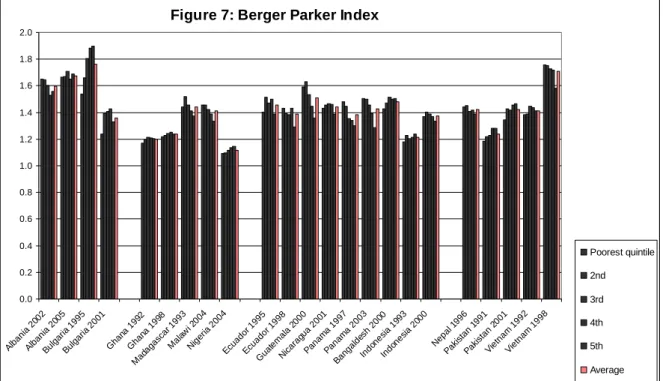
In this section, we provide some evidence of the relationship between diversification and household wealth by estimating a Berger-Parker index13 of relative income diversity, which we compare across countries and along the income distribution within each country. A higher index indicates greater relative diversity. As shown in Figure 7, some variability is observed across countries, with countries like Albania and Bulgaria 1995 demonstrating much greater diversification than countries like Ghana Indonesia (1993), Nigeria and Pakistan (1991). As hypothesized at the beginning, the results across the income distribution are mixed and no clear conclusion can be drawn, also in view of the relatively small magnitudes of the differences along the income gradient. Bulgaria (2001), Ecuador (1995), Indonesia (2000), Nicaragua and Vietnam (1992) show an inverted U such that as the level of wealth increases, from the poorest to the middle income deciles, households have increasingly diversified income sources. However, for the higher wealth quintiles, households in these countries are increasingly specialized. Guatemala, Malawi, Panama (1997, 2003) and Vietnam (1998) show increasing specialization as income increases, while Bulgaria (1995), Pakistan (1991, 2001) show increasing diversification.
Figure 7: Berger Parker Index
0.0 0.2 0.4 0.6 0.8 1.0 1.2 1.4 1.6 1.8 2.0 Alban ia 20 02 Alba nia 20 05 Bulga ria 19 95 Bulga ria 200 1 Ghan a 19 92 Ghan a 19 98 Ma dag ascar 199 3 Mal awi 2 004 Nige ria 20 04 Ecua dor 19 95 Ecua dor 199 8 Gu atem ala 2 000 Nica ragu a 20 01 Panam a 199 7 Pana ma 200 3 Bang alde sh 200 0 Indo nes ia 19 93 Indo nes ia 20 00 Nepal 199 6 Paki stan 1991 Pakis tan 2001 Viet nam 1992 Viet nam 1998 Poorest quintile 2nd 3rd 4th 5th Average Source: Authors’ calculations using RIGA database
13
V. Conclusions and policy implications
The main objective of this first descriptive paper was to introduce the reader to the RIGA dataset and to some of the methodological underpinning in the construction of comparable income aggregates from nationally representative households surveys from four continents. Furthermore, based on a preliminary descriptive analysis of the constructed variables, the paper aimed at re-assessing the available evidence on the levels and composition of income sources adopted by rural households.
The results of the analysis of the RIGA dataset confirm previous findings that the rural non-farm economy plays a critical role in the income generation of rural households. In fact, the results suggest that it may be even more important than previously recognized, exceeding in many cases over 50 percent of rural income. The “sector” has grown too large to condone its continued neglect in rural development policies and poverty reduction programmes alike.
While the breakdown between on-farm and rural non-farm activities by countries suggests some consistency in the importance of the rural non farm economy, this hides significant variability across countries in the importance of particular rural income generating activities. This heterogeneity was observed across regions- for example, on-farm activities were
observed to be more important contributors to total income among the African RIGA countries in our sample- but also within regions the relative importance, in terms of participation and returns, of agricultural and non-agricultural activities, and respective sub-sectors, was highlighted.
Another finding, which is less frequently highlighted in the rural non-farm literature, is the widespread receipt of transfers from public and private sources among rural households, almost irrespective of their welfare standing. In all of the data sets, over 25 percent of the households receive some form of transfer and in ten cases participation rates exceed 50 percent. However, only in a few cases do these participation rates translate into more than 20 percent of household income, reflecting the informality and safety net function of these small transfers.
In the overwhelming majority of cases we find a positive trend between household welfare status and participation in non-agricultural activities. That is, as we move across the wealth quintiles from poorer to wealthier, an increasing share of households have participated in non-agricultural activities. Within non-farm activities, the strongest positive relationship is
observed for wage labour; in virtually all countries, better-off households are more likely to participate in non-agricultural wage labour. As these are often the activities with the highest and more stable returns, the results highlight the presence of barriers for poorer households to participate in those activities which could significantly reduce their vulnerability and poverty levels. Conversely, higher participation in agricultural wage employment is generally associated with lower income levels and wealth status, confirming this sector’s role as a coping or survival mechanism for poor households in rural areas when other, more profitable activities are not accessible.
On the other hand, with very few exceptions, even among the wealthiest households, when analyzed by expenditure quintiles, no sizable differences are detected in terms of participation in on-farm activities. Regardless of the level of household welfare, the large majority of rural households have on-farm economic activities. Diversification into both agricultural and non agricultural income generating activities is thus the norm, rather than the exception, a finding supported by the widespread level of household income portfolio diversification,
demonstrated by the Berger-Parker diversification index.
In view of the importance and potential of the rural non-farm economy as part of a diversified income strategy alongside agricultural activities, the challenge for current and future rural development strategies is thus to go “beyond agriculture,” so to identify the adequate
elements of an integrated rural strategy that best complement the still pivotal role of a better-linked agricultural sector.
References
Adams, R. (1995) “Sources of Income Inequality and Poverty in Rural Pakistan,” Research
Report 102 Washington, DC: International Food Policy Research institute.
Adams, R. (2000) “Non-Farm Income and Rural Inequality in Egypt and Jordan,” Mimeo, Washington DC: The World Bank.
Adams, R. (2002) “Nonfarm Income, Inequality and Land in Rural Egypt,” Economic
Development and Cultural Change 50(2):339-363.
Azzarri, C., Carletto, G., Davis, B., Fatchi, T., and Vigneri, M. (2006) “Food and Nutrition Security in Malawi,” Background paper to the 2006 Malawi Poverty and Vulnerability Assessment.
Bezemer, D. (2003) “The Rural Non-Farm Economy in Low and Middle Income Transition Countries: Overview of Findings and Lessons from DFID commissioned surveys.” Report V. UK Department for International Development. May.
Burgess, R. (1997) “Diversification and Welfare in Rural China” Mimeo, London: London School of Economics.
Chenery, H.B. and Syrquin, M. (1975) Patterns of Development, 1950-1970. London: Oxford University Press.
Chinn, D. (1979) “Rural Poverty and the Structure f Farm Household income in Developing Countries: Evidence from Taiwan,” Economic Development and Cultural Change
27:283-301.
Clay, D. C., Kampayana T., and Kayitsinga, J. (1997). Inequality and the Emergence of Nonfarm Employment in Rwanda. In Clay, D.C. and Kampayana, T. (Eds.), Changing
Rural Social Systems: Adaptation and Survival (pp. 93-130). East Lansing: Michigan:
State University Press.
Collier, P., Radwan, S. and Wangwe, S. (1986) Labour and Poverty in Rural Tanzania. Oxford: Claredon Press.
Davis, B. and Stampini, M. (2002) “Pathways towards prosperity in rural Nicaragua; or why households drop in and out of poverty, and some policy suggestions on how to keep them out,” FAO and Scuola Sant’Anna, Pisa.
Davis, B., Winters, P., Carletto, G., Covarrubias, K., Quinones, E., Zezza, A., Stamoulis, K., Bonomi, G., and DiGiuseppe, S. (2007) “Rural Income Generating Activities: A Cross-Country Comparison,” ESA Working Paper No. 07-16, (Rome: FAO).
Davis, J. (2004) The Rural Non-Farm Economy, Livelihoods and their Diversification: Issues
and Options Chatham, UK: Natural Resource Institute.
De Ferranti, David, Guillermo E. Perry, David Lederman, William Foster and Alberto Valdés. (2005) Beyond the City: The Rural Contribution to Development in Latin America
and the Caribbean. Book-Length "Annual Flagship Study", The World Bank,
Washington DC. February.
De Janvry, A., Sadoulet, E. and Zhu, N. (2005) “The Role of Non-Farm Incomes in
Reducing Rural Poverty and Inequality in China.” CUDARE Working Paper 1001. Department of Agricultural and Resource Economics, UCB.
Elbers, C. and Lanjouw, P. (2001) “Intersectoral Transfers, Growth and Inequality in Rural Ecuador,” World Development 29(3):481-496.
Ellis, F. and Biggs, S. (2001) “Evolving Themes in Rural Development 1950s-2000s,”
Development Policy Review 19(4):437-448.
Escobar, G., Reardon, T. and Berdegue, J. (2002) “Best Practices and Strategies for Interventions to Promote Rural Nonfarm Employment in Latin America,” Mimeo, Santiago, Chile: RIMISP.
FAO (1998) The State of Food and Agriculture: Rural Non-Farm Income in Developing
Countries. Rome: Food and Agriculture Organization.
Fafchamps M. and Shilpi F. (2003) “The Spatial Division of Labour in Nepal,” Policy
Research Working Paper Series: 2845, Washington DC: The World Bank.
Gordon, A. and Craig, C. (2001) “Rural Non-farm Activities and Poverty Alleviation in Sub-Saharan Africa.” Social and Economic Development Department. Natural Resources Institute. Policy Series 14.
Haggblade, S., Hazell, P. and Reardon, T. (2002) “Strategies for Stimulating
Poverty-Alleviating Growth in the Rural Nonfarm Economy in Developing Countries,” EPTD
Discussion Paper No. 92I. Washington, DC: International Food Policy Research
Haggblade, S., Hazell, P. and Reardon, T. (2005) “The Rural Nonfarm Economy: Pathway Out of Poverty or Pathway In?” Presented at International Research Workshop “Future of Small Farms,” Kent, UK, June 26-29.
IFAD (2001) Rural Poverty Report 2001: The Challenge of Ending Rural Poverty. Oxford: Oxford University Press for International Fund for Agricultural Development. Isgut, A. (2004) “Nonfarm Income and Employment in Rural Honduras: Assessing the Role
of Locational Factors,” Journal of Development Studies 40(3):59-86.
Kuznets S.S. (1957) “Quantitative Aspects of the Economic Growth of Nations II,” Economic
Development and Cultural Change, Supplement to Volume 4(4):3-11.
Lanjouw, P. (1999) “Rural nonagricultural Employment and Poverty in Ecuador.” Economic
Development and Cultural Change. 48(1):91.
Lanjouw, P. and Feder G. (2001) “Rural Nonfarm Activities and Rural Development: From Experience towards Strategy,” Rural Development Strategy Background Paper #4, Washington, DC: The World Bank.
Lanjouw, J. and Lanjouw, P. (2001) “The Rural Nonfarm Sector: Issues and Evidence from Developing Countries,” Agricultural Economics 26(1):1-23.
Lanjouw, P. and Shariff, A. (2002) “Rural Non-Farm Employment in India: Access, Income and Poverty Impact” National Council of Applied Economic Research, Working Paper Series No. 81. February.
Reardon, T., Crawford, C and Kelly, V. (1994) “Links between Non-Farm Income and Farm Investment in African Households: Adding the Capital Market Perspective,” American
Journal of Agricultural Economics 76:1172-1176.
Reardon, T. (1997) “Using Evidence of Household Income Diversification to Inform Study of the Rural Nonfarm Labor Market in Africa,” World Development 25(5):735-748. Reardon, T., Berdegué, J. and Escobar, G. (2001) “Rural Nonfarm Employment and Incomes
in Latin America: Overview and Policy Implications,” World Development 29(3):411-425.
Reardon, T. and Taylor, J. E. (1996) “Agroclimatic Shock, Income Inequality, and Poverty: Evidence from Burkina Faso.” World Development 24(4):901-914.
Reardon, T., Taylor, J. E., Stamoulis, K., Lanjouw P. and Balisacan A. (2000) “Effects of Non-Farm Employment on Rural Income Inequality in Developing Countries: An Investment Perspective,” Journal of Agricultural Economics 51(2):266-288. Schejtman, A. and Berdegué, J. (2003) “Desarrollo Territorial Rural” Working Paper
prepared for the International Fund for Agricultural Development and the Inter-American Development Bank, Santiago, Chile: RIMISP.
Smale, M. (Ed.). (2006) Valuing Crop Biodiversity: On-Farm Genetic Resources and
Economic Change. Wallingford, UK: CABI Publishing.
Stein, Holden, Bekele Shiferaw and Joh Pender. (2004) “Non-farm income, household welfare, and sustainable land management in a less-favoured area in the Ethiopian highlands.” Food Policy. 29:369-392.
Taylor, J. E., Yunez-Naude, A. (2000) “The Returns From Schooling in a Diversified Rural Economy,” American Journal of Agricultural Economics 82(2):287-297.
Appendix I
Table A.1: Countries and data sources for analysisNumber of Observations
Country Name of Survey Year
Collected Total Rural Urban
Albania Living Standards
Measurement Study Survey 2002 3,599 1,640 1,959
Albania Living Standards
Measurement Study Survey 2005 3,640 1,640 2,000 Bangladesh Household
Income-Expenditure Survey 2000 7,440 5,040 2,400
Bulgaria Integrated Household Survey 1995 2,468 824 1,664 Bulgaria Integrated Household Survey 2001 2,633 877 1,756 Ecuador Estudio de Condiciones de
Vida 1995 5,810 2,532 3, 278
Ecuador Estudio de Condiciones de
Vida 1998 5,801 2,535 3,266
Ghana Ghana Living Standards
Survey Round Two 1992 4,523 2,945 1,578
Ghana Ghana Living Standards
Survey Round Three 1998 5,998 3,799 2,199
Guatemala Encuesta de Condiciones de
Vida 2000 7,276 3,852 3,424
Indonesia Family Life Survey- Wave 1 1992-1993 10,436 5,411 5,026 Indonesia Family Life Survey- Wave 3 2000 7,216 3,786 3,430 Madagascar Enquête Permanente Auprès
des Ménages 1993-1994 4,505 2,653 1,852
Malawi Integrated Household
Survey-2 2004-2005 11,280 9,840 1,440
Nepal Living Standards Survey I 1995-1996 3,370 2,655 715 Nicaragua Encuesta de Medición de
Niveles de Vida 2001 4,191 1,839 2,352
Nigeria Living Standards Survey 2004 3,373 2,657 716
Pakistan Integrated Household Survey 1991 4,792 2,396 2,396 Pakistan Integrated Household Survey 2001 15,927 9,978 5,949 Panama Encuesta de Niveles de Vida 1997 4,945 2,496 2,449 Panama Encuesta de Niveles de Vida 2003 6,363 2,945 3,418 Vietnam Living Standards Survey 1992-1993 4,800 3,840 960 Vietnam Living Standards Survey 1997-1998 6,002 4,272 1,730