Cost and Benefit Analysis of a Preconditioning Feeder Calf Program
Jeri Donnell
The Samuel Roberts Noble Foundation Ardmore, OK 73401
Phone: 580-224-6441 Fax: 580-224-6422 Email: [email protected]
Clement E. Ward
Department of Agricultural Economics Oklahoma State University
Stillwater, OK 74078 Phone: 405-744-9821 Fax: 405-744-9835 Email: [email protected]
Selected Paper prepared for presentation at the Western Agricultural Economics Association Annual meeting, Big Sky, Montana, June 25-June 27, 2008
Copyright 2008 by Jeri Donnell and Clement E. Ward. All rights reserved. Readers may make verbatim copies of this document for non-commercial purposes by any means, provided that this copyright notice appears on all such copies.
Cost and Benefit Analysis of a Preconditioning Feeder Calf Program
Abstract
Objectives were twofold: Determine key factors influencing preconditioning cost and returns; and determine the premium for age and source verified, preconditioned calves sold at a public livestock market. Data provided by the Samuel Roberts Noble Foundation show preconditioning returns depend significantly on number of days preconditioned, average daily gain, and cost of vaccinations, hay, feed, and mineral. Noble Foundation cooperators received a premium for age and source verified, preconditioned feeder cattle when sold at market. Significant coefficients averaged across five sales conclude that Noble Foundation management practices receive a $2.49/cwt premium when compared to all other cattle sold at market.
Keywords
Cattle, calves, preconditioning, prices, costs, age and source verification
Introduction
The act of preconditioning, preparing calves to enter the stocker phase or to be directly placed into a feedlot, is not a new concept to the beef industry. Typically, this process includes ranch management activities such as weaning, supplemental nutrition, dehorning, castration, and implementation of an animal health program including both deworming and vaccinations. Although it can be demonstrated by animal science industry leaders and numerous practitioners of veterinary medicine that intensely managed preconditioning programs are of benefit to the health and performance of feeder cattle (Duff and Gaylean 2007; Lalman and Smith 2002), due to the additional cost, labor, and time many cow-calf producers are still hesitant to adopt preconditioning requirements. Furthermore, literature has shown there is a lack of data pertaining to the cost of preconditioning. Many articles simply use estimated budgets when determining if the added value of preconditioning exceeds the added cost.
The Samuel Roberts Noble Foundation (NF) staff developed what they call an integrated beef production system (BPS) designed to assist cooperators in making sound farm management decisions. Specifically, producers are consulted in areas such as forages and rangeland
management, animal production, economics and marketing, and wildlife conservation. It is the intent of this consultation effort to provide guaranteed source, process, and performance verified feeder cattle to the marketplace.
By providing preconditioning information, a buyer can better evaluate the value of cattle presented at market by an individual cow-calf producer. It can be assumed that as the confidence in value assessment increases, the price the buyer is willing to pay should be commensurate with value, thereby increasing pricing accuracy. The Livestock Marketing Association and Global Animal Management surveyed 100 livestock marketing managers who concluded premiums of $5.37/cwt for age and source verified calves that were third-party certified (Burt 2007;
Rutherford 2007). For this project, we assume that feeder cattle receive a premium due to age verification, source verification, and preconditioning when sold under the guidance of the Noble Foundation.
This project was divided into two sections: preconditioning costs and the market value of preconditioning. When evaluating preconditioning costs, objectives were to establish the
average cost of the NF’s BPS program while determining key factors influencing costs and returns. Efforts were focused to determine if added cost of production exceeds added market value of NF preconditioned feeder cattle. Regarding the market value of preconditioned feeder cattle, this study seeks to determine the price differential for calves managed under the Noble Foundation protocol versus alternative preconditioning management practices.
Data and Procedure
Preconditioning costs – Over the past four years, Noble Foundation staff collected data regarding the actual cost of producing preconditioned cattle. The cost portion of the data set included feed and mineral, hay, vaccinations, additional labor, death loss, the implicit
opportunity cost, and marketing costs. Additional performance information was also provided including animal weights, days preconditioned, and average daily gain. Furthermore, the data set was separated by animal sex (i.e. steers vs. heifers). Little variation is present however, due to the fact that many NF cooperators preconditioned both steers and heifers in a single group.
Due to the rapidly expanding BPS program and new growth of NF cooperators, Noble Foundation staff was unable to obtain complete records for every producer. Therefore when necessary, average costs were used to fill in missing values. Borrowing heavily from Oklahoma State University specialists’ preconditioning budgets, it was assumed cattle would incur 6% shrink if sold at weaning. Likewise, when cattle were sold after the preconditioning phase, it is assumed cattle lost 2.5% of body weight. Regression analysis, holding quality grade constant, was used to estimate a value for cattle if sold after weaning while sale prices at the Oklahoma National Stockyards were used to value cattle after preconditioning. Summary statistics can be found in Table 1.
Based on the profit maximization theory, a model was estimated using Feasible
Generalized Least Squares (FGLS) regression to determine and identify key factors relative to preconditioning margins. The general preconditioning model is:
(1) i j ij i i i i i i i i i YR DL ADLBR VACCS HAY FDMIN ADG DAYS WWT hd Mgn
ε
β
β
β
β
β
β
β
β
β
α
+ + + + + + + + + + =∑
= 4 1 9 8 7 6 5 4 3 2 1 2 _where net margins on a per head basis (Mgn_hd) is a function of variables relating to animal performance, such as estimated weaning weight (WWT), length of preconditioning period (DAYS), and average daily gain (ADG) as well as variables measuring a producer’s costs including feed and mineral cost (FDMIN), hay costs (HAY), vaccination and medical costs (VACCS), additional labor (ADLBR), and death loss (DL), for the ith observation. Complete
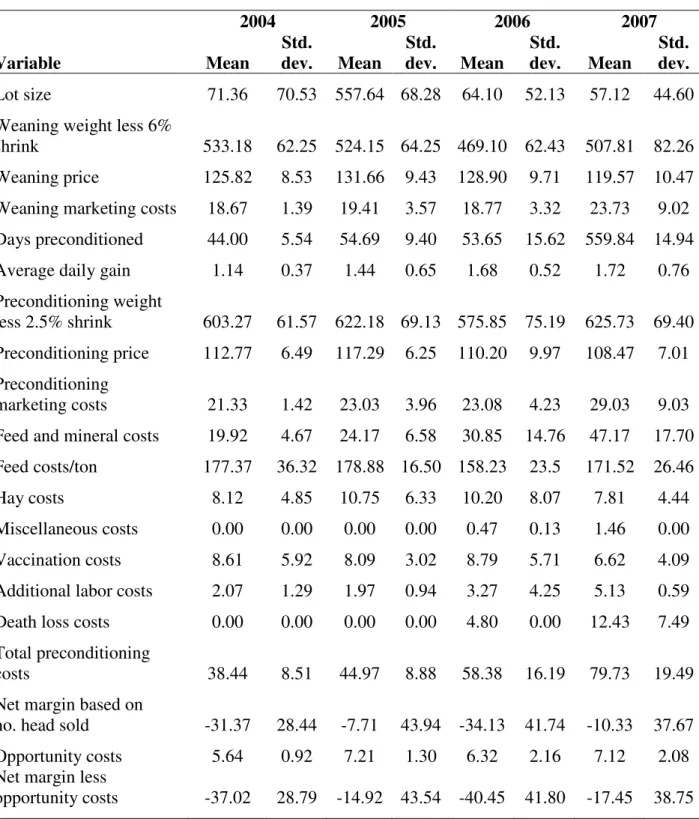
Table 1. Table of summary statistics by year (steers and heifers combined) 2004 2005 2006 2007 Variable Mean Std. dev. Mean Std. dev. Mean Std. dev. Mean Std. dev. Lot size 71.36 70.53 557.64 68.28 64.10 52.13 57.12 44.60
Weaning weight less 6%
shrink 533.18 62.25 524.15 64.25 469.10 62.43 507.81 82.26 Weaning price 125.82 8.53 131.66 9.43 128.90 9.71 119.57 10.47 Weaning marketing costs 18.67 1.39 19.41 3.57 18.77 3.32 23.73 9.02 Days preconditioned 44.00 5.54 54.69 9.40 53.65 15.62 559.84 14.94 Average daily gain 1.14 0.37 1.44 0.65 1.68 0.52 1.72 0.76 Preconditioning weight
less 2.5% shrink 603.27 61.57 622.18 69.13 575.85 75.19 625.73 69.40 Preconditioning price 112.77 6.49 117.29 6.25 110.20 9.97 108.47 7.01 Preconditioning
marketing costs 21.33 1.42 23.03 3.96 23.08 4.23 29.03 9.03 Feed and mineral costs 19.92 4.67 24.17 6.58 30.85 14.76 47.17 17.70 Feed costs/ton 177.37 36.32 178.88 16.50 158.23 23.5 171.52 26.46
Hay costs 8.12 4.85 10.75 6.33 10.20 8.07 7.81 4.44
Miscellaneous costs 0.00 0.00 0.00 0.00 0.47 0.13 1.46 0.00
Vaccination costs 8.61 5.92 8.09 3.02 8.79 5.71 6.62 4.09
Additional labor costs 2.07 1.29 1.97 0.94 3.27 4.25 5.13 0.59
Death loss costs 0.00 0.00 0.00 0.00 4.80 0.00 12.43 7.49
Total preconditioning
costs 38.44 8.51 44.97 8.88 58.38 16.19 79.73 19.49
Net margin based on
no. head sold -31.37 28.44 -7.71 43.94 -34.13 41.74 -10.33 37.67
Opportunity costs 5.64 0.92 7.21 1.30 6.32 2.16 7.12 2.08
Net margin less
opportunity costs -37.02 28.79 -14.92 43.54 -40.45 41.80 -17.45 38.75 variable definitions are given in Table 2. The variable YR is included in equation 1 since the data includes four years of preconditioning information. Thus, the variable year (YR) is used to account for any difference between time periods.
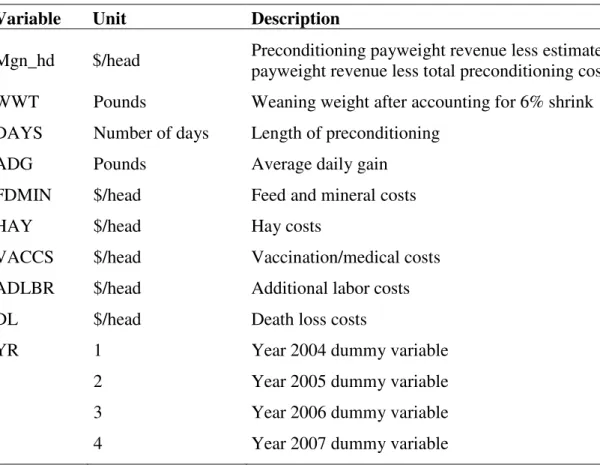
Table 2. Preconditioning variable definitions
Variable Unit Description
Mgn_hd $/head Preconditioning payweight revenue less estimated weaning payweight revenue less total preconditioning costs
WWT Pounds Weaning weight after accounting for 6% shrink DAYS Number of days Length of preconditioning
ADG Pounds Average daily gain
FDMIN $/head Feed and mineral costs
HAY $/head Hay costs
VACCS $/head Vaccination/medical costs
ADLBR $/head Additional labor costs
DL $/head Death loss costs
YR 1 Year 2004 dummy variable
2 Year 2005 dummy variable
3 Year 2006 dummy variable
4 Year 2007 dummy variable
Market value of preconditioning – Three years of data were collected at the Oklahoma National Stockyards on five sales where Noble Foundation BPS cattle were sold. Information relative to the five sales was recorded by Noble Foundation staff, Oklahoma State University faculty, and an Oklahoma State University graduate student. Cross-sectional data included information on a per lot basis such as the number of head, average weight, price received, level of management, sex, breed type, fleshing ability, muscling, frame score, uniformity, the presence of horns, and overall lot health. Data collectors were as consistent as possible in recording information during a sale, however collection consistency cannot be guaranteed across the five sales. The three variables in which collection results are most likely to differ include animal health, fleshiness, and muscling.
First, it should be noted that data and findings were confined to feeder cattle in the weight range of 400 to 850 pounds. In an effort to obtain evenly distributed data, information was collected on cattle not sold under the Noble Foundation BPS program (non-Noble Foundation calves) both prior to and after Noble Foundation cattle entered the sale ring. Due to the nature of the OKC National Stockyards, all sales occurred on Monday. Table 3 summarizes data collected on a per head basis. Sales 1 and 2 refer to calves sold from the 2005 spring calf crop, Sales 3 and 4, from the 2006 calf crop, and Sale 5 from the 2007 spring calf crop.
Table 3. Sale market summary (number of head)
Sale date Closing market report Total data collected Noble Foundation cattle 1. 12-5-05 12,200 7,100 1,984 2. 1-30-06 9,700 3,250 418 3. 10-16-06 7,400 2,495 1,063 4. 12-4-06 6,000 1,123 538 5. 12-3-07 13,532 4,350 1,575
Note: Closing market report information for each Oklahoma National Stockyard sale was obtained from the USDA Agricultural Marketing Service (website: www.ams.usda.gov ).
Hedonic pricing theory was used to estimate the value of cattle characteristics and management alternatives. To accomplish this, the following model was estimated:
(2) i j j j ij j ij j ij j j ij j ij j j j ij j j ij j j ij j j ij j i i i i i MGMT FR UN HL MU FL HR SX BD AW AW HD HD MP
ε
β
β
β
β
β
β
β
β
β
β
β
β
β
α
∑
∑
∑
∑
∑
∑
∑
∑
∑
= = = = = = = = = + + + + + + + + + + + + + + = 2 1 3 1 8 1 13 12 11 2 1 10 3 1 9 3 1 8 2 1 7 3 1 6 4 1 5 2 4 3 2 2 1where MP is the price received for the ith lot, HD is the number of cattle, AW is the average weight, BD is the breed type, SX is animal sex, HR is the presence of horns, FL is the level of fleshiness, MU is the degree of muscling, HL is overall lot health, UN is lot uniformity, FR is the animals frame score, and MGMT is the level of management implemented at the ranch for the ith lot and the jth sale. Data pertaining to cattle characteristics is categorical; therefore dummy
variables were assigned for several of the above variables. Complete variable definitions can be found in Table 4.
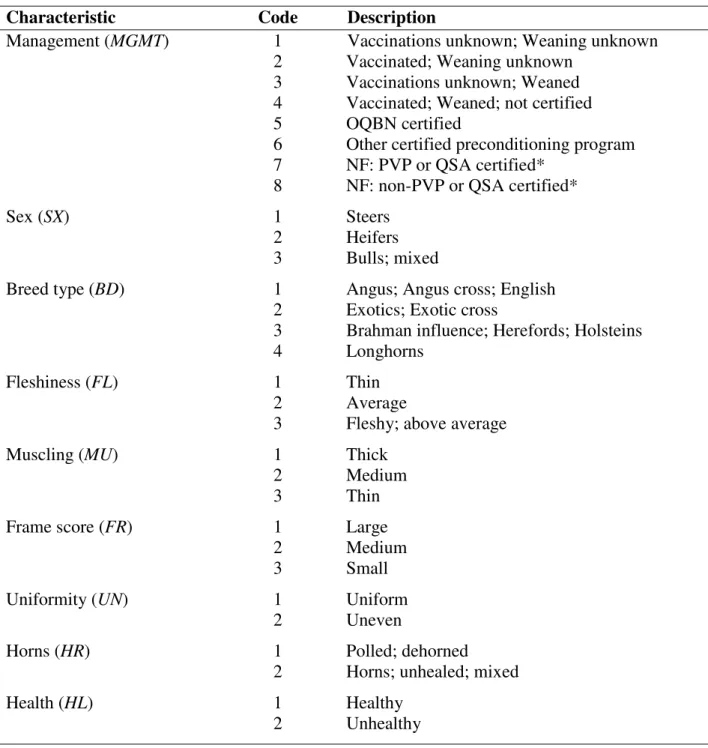
Table 4. Market value variable definitions
Characteristic Code Description
Management (MGMT) 1 Vaccinations unknown; Weaning unknown
2 Vaccinated; Weaning unknown 3 Vaccinations unknown; Weaned 4 Vaccinated; Weaned; not certified
5 OQBN certified
6 Other certified preconditioning program 7 NF: PVP or QSA certified*
8 NF: non-PVP or QSA certified*
Sex (SX) 1 Steers
2 Heifers
3 Bulls; mixed
Breed type (BD) 1 Angus; Angus cross; English
2 Exotics; Exotic cross
3 Brahman influence; Herefords; Holsteins
4 Longhorns
Fleshiness (FL) 1 Thin
2 Average
3 Fleshy; above average
Muscling (MU) 1 Thick
2 Medium
3 Thin
Frame score (FR) 1 Large
2 Medium
3 Small
Uniformity (UN) 1 Uniform
2 Uneven
Horns (HR) 1 Polled; dehorned
2 Horns; unhealed; mixed
Health (HL) 1 Healthy
2 Unhealthy
*Management 7 and 8 were only applicable for BPS sales 3, 4, and 5.
The variable of relevance to age and source verification and preconditioning is
Then the coefficient for Noble Foundation management practices can be compared to the coefficient for non-Noble Foundation management practices. If the Noble Foundation coefficient is significantly larger than the coefficient for non-Noble Foundation management practices, buyers paid a premium for preconditioning ($/cwt) including age and source verification.
Therefore, the model compares the Noble Foundation variable to all other management classifications. The model is of primary importance to the Noble Foundation as it tells how much NF cattle are valued above all other cattle sold at market on the same day. Although the methods and procedures used can capture the value a buyer places on preconditioning
management practices, one should keep in mind it cannot specifically account for the value buyers place on the reputation of the Noble Foundation or its cooperator-producers.
During the time period of sales 1 and 2, all Noble Foundation cattle were categorized under the management option as calves that had been vaccinated and weaned but not managed under a certified preconditioning program. During the course of the sale, non-NF calves were also assigned this management classification. Therefore for modeling purposes, the fourth management classification (non-certified, preconditioned calves) was sorted according to Noble Foundation involvement. Prior to sales 3, 4, and 5, Noble Foundation staff and cooperators took the needed steps to become PVP and/or QSA certified. Thus, for sales 3, 4, and 5, Noble
Foundation cattle that were PVP and/or QSA certified were categorized separately from those calves that were not certified under a PVP and/or QSA program.
Results
Preconditioning costs – The base model, estimated by Feasible Generalized Least Squares regression, explained 65.7% of the variability in the returns to preconditioning. Results for the
preconditioning model are in Table 5.
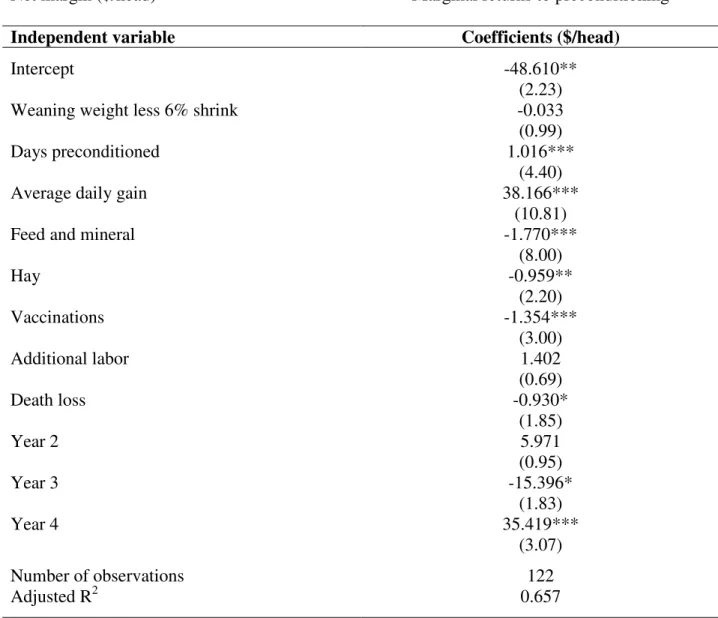
Table 5. Regression results for preconditioning
Dependent variable Variable definition
Net margin ($/head) Marginal returns to preconditioning
Independent variable Coefficients ($/head)
Intercept -48.610**
(2.23)
Weaning weight less 6% shrink -0.033
(0.99)
Days preconditioned 1.016***
(4.40)
Average daily gain 38.166***
(10.81)
Feed and mineral -1.770***
(8.00) Hay -0.959** (2.20) Vaccinations -1.354*** (3.00) Additional labor 1.402 (0.69) Death loss -0.930* (1.85) Year 2 5.971 (0.95) Year 3 -15.396* (1.83) Year 4 35.419*** (3.07) Number of observations 122 Adjusted R2 0.657
Numbers in parentheses are absolute values of calculated t statistics; * = 0.10, ** = 0.05, and *** = 0.01 significance level.
FGLS results show the average preconditioning margin to be minus $48.61/head when all other model characteristics are at their average. Results also show that days preconditioned and average daily gain had a significant impact on net margins from preconditioning. If a producer were to increase the length of preconditioning by one day, he/she would improve net margins by
$1.02/head. Also, producers received $38.17/head for every additional pound gained per day during the preconditioning phase. If one were to increase average daily gain by 0.2, then one would contribute approximately $7.60/head to net margins. Costs associated with animal nutrition had a large influence on preconditioning costs. Each $1 increase in feed and mineral costs have a $1.77/head decline in net returns, while for hay the negative effect is $0.96/head. Other cost categories also significantly impact the margin for preconditioning. Each $1 increase in vaccination costs have a $1.35/head decline in net returns while an additional $1 increase in death loss negatively effects net returns by $0.93/head. The estimated cost of additional labor was not significant which was not expected. Once again, the preconditioning cost section shows key factors such as average daily gain, feed and mineral costs, and the cost of hay, vaccinations and death loss are influential in net returns to preconditioning.
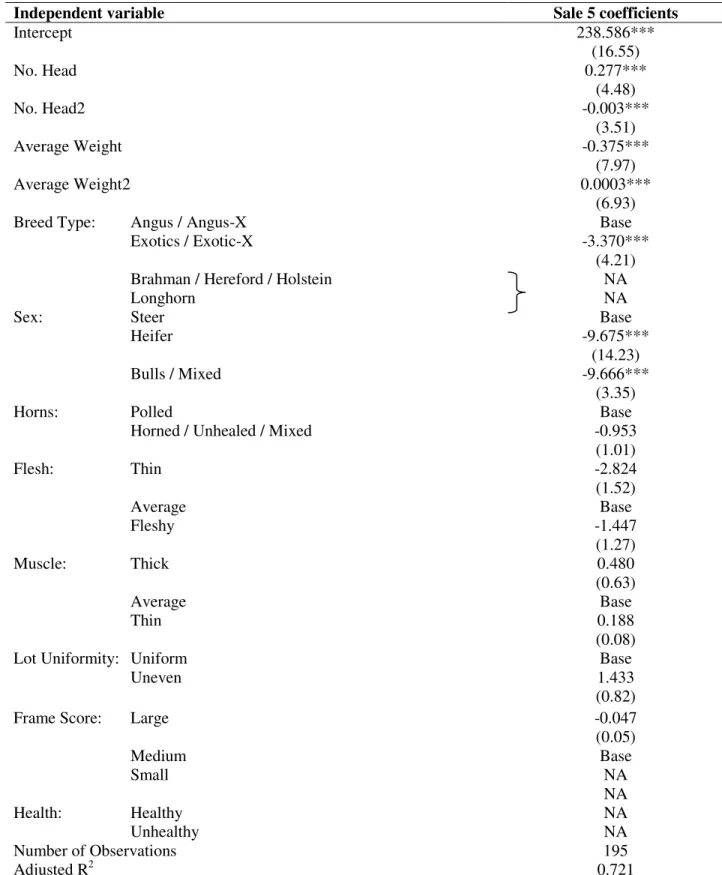
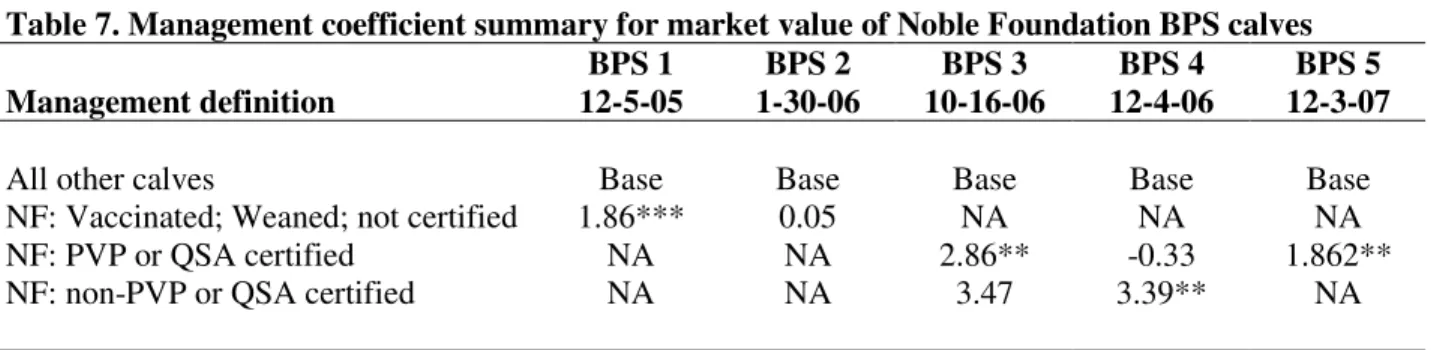
Market value of preconditioning – The market value model explained 70.0%, 90.4%, 70.9%, 91.5%, and 72.1% of the variation in market price for sales 1, 2, 3, 4, and 5 respectively. Table 6 is an example of how market price per sale lot was influenced by cattle characteristics during sale 5. As explained earlier, the results relative to the management variable are of primary importance. NF BPS cattle received a premium when compared to all other management classifications for all sales with the exception of sale 2. Prior to imposing age and source verifications, BPS preconditioned cattle received a $1.86/cwt premium during sale 1. During sale 3 (October 16, 2006) cattle enrolled in a PVP/QSA program received a premium of
$2.86/cwt while during sale 4 (December 4, 2006) non-PVP/QSA cattle received a premium of $3.39/cwt. During sale 5 however, cattle enrolled in a PVP/QSA program received a premium of $1.86/cwt. Complete management variable results can be found in Table 7.
Table 6. Regression results for BPS sale 5 comparing NF cattle with all other cattle
Independent variable Sale 5 coefficients
Intercept 238.586*** (16.55) No. Head 0.277*** (4.48) No. Head2 -0.003*** (3.51) Average Weight -0.375*** (7.97) Average Weight2 0.0003*** (6.93)
Breed Type: Angus / Angus-X Base
Exotics / Exotic-X -3.370***
(4.21) Brahman / Hereford / Holstein
Longhorn
NA NA
Sex: Steer Base
Heifer -9.675***
(14.23)
Bulls / Mixed -9.666***
(3.35)
Horns: Polled Base
Horned / Unhealed / Mixed -0.953
(1.01) Flesh: Thin -2.824 (1.52) Average Base Fleshy -1.447 (1.27) Muscle: Thick 0.480 (0.63) Average Base Thin 0.188 (0.08)
Lot Uniformity: Uniform Base
Uneven 1.433
(0.82)
Frame Score: Large -0.047
(0.05) Medium Base Small NA NA Health: Healthy NA Unhealthy NA Number of Observations 195 Adjusted R2 0.721
Numbers in parenthesis are absolute values of calculated t statistics; * = 0.10, ** = 0.05, and *** = 0.01 significance level.
Table 7. Management coefficient summary for market value of Noble Foundation BPS calves BPS 1 BPS 2 BPS 3 BPS 4 BPS 5 Management definition 12-5-05 1-30-06 10-16-06 12-4-06 12-3-07
All other calves Base Base Base Base Base
NF: Vaccinated; Weaned; not certified 1.86*** 0.05 NA NA NA
NF: PVP or QSA certified NA NA 2.86** -0.33 1.862**
NF: non-PVP or QSA certified NA NA 3.47 3.39** NA
* = 0.10, ** = 0.05, and *** = 0.01 significance level
Implications and Conclusions
Preconditioning costs – The use of producer data has allowed for an in depth analysis of how preconditioning costs affect producer returns. For the four-year time period, Noble Foundation cooperators experienced on average total preconditioning costs of $53.40/head. This is in line with budgeted preconditioning costs which can range anywhere from $35 - $60/head (Lalman and Smith 2002). Although lower costs are plausible (i.e. $24.22/head reported for the 30-day Southeast Pride Blue Tag Program (Neel et al. 2002)), many researchers are finding typical costs of preconditioning to be in the upper range of $60/head as stated by Avent, Ward, and Lalman (2004). The Alabama Cooperative Extension System uses a cost of $60.22/head for a 45-day preconditioning program (Prevatt and Rankins 2004). This is reinforced by Dhuyvetter, Bryant, and Blasi (2005) who say producers should try to keep preconditioning cost in the range of $0.90 to $1.35/head/day. Assuming maximum costs and a minimum of 45 days preconditioning, total cost of preconditioning to producers would be $60.75/head.
Furthermore, this study found that number of days preconditioned, average daily gain, and the cost of death loss, vaccinations, hay and feed and mineral significantly impacted the net margin after preconditioning. Findings from this study show the average preconditioning margin to be approximately minus $48.50/head when all other model characteristics (i.e. estimated
weaning weight, days preconditioned, average daily gain, and the cost of feed and mineral, hay, vaccinations, additional labor, and death loss) are at their average.
Market value of preconditioning – The market value section analyzed if and at what level premiums were available for feeder cattle preconditioned according to BPS requirements. It was determined that an average premium of $2.49/cwt (i.e. average of the models significant
coefficients for BPS sales 1-5) was available for Noble Foundation calves when compared to all other cattle. Although not the focus of this project, an alternative market value model was estimated. The alternative model compares Noble Foundation cattle to feeder cattle sold with little or no information available (i.e. weaning and vaccinations unknown). When compared this way, the premium for feeder cattle operated under the intensely managed BPS program increased to $4.36/cwt when averaged among the significant coefficients for sales 1-5.
Noble Foundation premium levels are not as large as many previous studies indicate. The Texas Cattle Feeders Association (TCFA) survey, conducted by Avent, Ward, and Lalman (2004), report that feedlot operators believe preconditioned cattle are $5.35/cwt more valuable than non-preconditioned cattle. Over an eleven year period (1995-2005), King et al. (2006) found premiums reached $7.91/cwt for VAC 45 preconditioning programs. Bulut and Lawrence (2007) concluded that third-party certification (TPC) of preconditioned cattle received $6.15/cwt above cattle of similar characteristics which were sold at weaning.
However, Noble Foundation premiums are similar to the findings of Bulut and Lawrence (2007) who state that un-certified preconditioned cattle received a premium; but it was
considerably less than that of TPC cattle ($3.40/cwt). Noble Foundation premiums are also comparable to the $3.36/cwt premium received at the Joplin Regional Stockyards in December 2000 (Avent, Ward, and Lalman 2003; Beef Cattle Manual 2004). Moreover, Noble Foundation
preconditioning premiums are comparable to the previously studied Oklahoma Quality Beef Network (OQBN) program and similar to premiums researched at the Holton Livestock Exchange, located in Holton, KS. Ward describes an estimated average OQBN premium of $3.11/cwt during the fall of 2001 and 2002 (Beef Cattle Manual 2004) while in Kansas, (Dhuyvetter, Bryant, and Blasi 2005) report during 1999-2004 cattle sold in the winter months received a $3.22/cwt premium as compared to similar type cattle sold at weaning.
References
Avent, R. Keith, Clement E. Ward, and David L. Lalman. Economic Value of Preconditioning Feeder Calves. Oklahoma Cooperative Extension Service, Oklahoma State University, AGEC-583, 2003.
Avent, R. Keith, Clement E. Ward, and David L. Lalman. “Market Valuation of Preconditioning Feeder Calves.” Journal of Agricultural and Applied Economics 36,1(2004):173-183. Beef Cattle Manual, 4th edition. Oklahoma Cooperative Extension Service; Oklahoma State
University, 2004.
Bulut, Harun and John D. Lawrence. “The Value of Third-Party Certification of Preconditioning Claims at Iowa Feeder Cattle Auctions.” Journal of Agricultural and Applied Economics 39,3(2007): 625-640.
Burt, Alaina. “Value-added means dollars.”BEEF Magazine. Online. Available at http://beef-mag.com. [Accessed March 2007.]
Dhuyvetter, Kevin C. “Economics of Preconditioned Calves.” Paper presented at the Kansas State University Agricultural Lenders Conference, Manhattan, KS, 29 October 2004. Dhuyvetter, Kevin C., A.M. Bryant, and D.A. Blasi. “Case Study: Preconditioning Beef Calves:
Are Expected Premiums Sufficient to Justify the Practice?” The Professional Animal Scientist 21(2005):502-514.
Duff, Glenn C. and Michael L. Galyean. “Board-Invited Review: Recent advances in
management of highly stressed, newly received feedlot cattle.” Journal of Animal Science 85(2007):823-840.
King, Michael E., M.D. Salman, Thomas E. Wittum, Kenneth G. Odde, Jon T. Seeger, Dale M. Grotelueschen, et al. “Effect of Certified Health Programs on the Sale Price of Beef Calves Marketed Through a Livestock Videotape Auction Service from 1995 through 2005.” Journal of the American Veterinary Medical Association 229,9(2006):1389-1400. Lalman, David, and Robert Smith. Effects of Preconditioning on Health, Performance and
Prices of Weaned Calves. Oklahoma Cooperative Extension Service, Oklahoma State University, ANSI-3529, 2002.
Lawrence, John D. and Godfred Yeboah. “Estimating the Value of Source Verification of Feeder Cattle.” Journal of Agribusiness 20,2(2002):117-129.
Neel, James B., Warren W. Gill, Micheal W. Salisbury, Mark Davis, Barry Sims and Todd Steen. “Effect of Southeast Pride Blue Tag Health and Management Program on Performance of Feeder Calves.” University of Tennessee. 2002. Online. Available at http://animalscience.ag.utk.edu. [Accessed 2007.]
Prevatt, Walt and Darrell Rankins. Does Preconditioning Feeder Calves Pay the Cow-Calf Producer? Alabama Cooperative Extension System, Auburn University, DAERS 04-16, 2004.
Rutherford, Burt. “Sale Barn Operators Say Value-Added Brings More Dollars.” BEEF Magazine. 2007. Online. Available at http://beef-mag.com. [Accessed March 2007] Tindall, Bill. “Preconditioning Programs.” Animal Nutrition and Health, 38,4,(1983): 38-42.