Master’s degree thesis
– A cost
investment
Number of pages including this
Master’s degree thesis
LOG950 Logistics
“
Geiranger Case Study”
A cost-benefit analysis of the energy
investment options in Møre og Romsdal
Bjørg Anita B. Larsen
Number of pages including this page:
Molde, May 2011
Master’s degree thesis
energy
in Møre og Romsdal
Publication agreement
Title: “Geiranger Case Study” – A cost-benefit analysis of the energy investment options in Møre og Romsdal
Author(s): Bjørg Anita B. Larsen
Subject code: LOG950
ECTS credits: 30
Year: 2011
Agreement on electronic publication of master thesis
Author(s) have copyright to the thesis, including the exclusive right to publish the document (The Copyright Act §2).
All theses fulfilling the requirements will be registered and published in Brage HiM, with the approval of the author(s).
Theses with a confidentiality agreement will not be published.
I/we hereby give Molde University College the right to, free of
charge, make the thesis available for electronic publication: x yes no
Is there an agreement of confidentiality? yes x no
(A supplementary confidentiality agreement must be filled in)
- If yes: Can the thesis be online published when the
period of confidentiality is expired? yes no
i
Preface and acknowledgements
This thesis is the last part in the LOG950 master program at Molde University College. The work on this thesis has been a lengthy process and somewhat difficult at times, but highly interesting and rewarding. All in all, this has been an exciting journey of learning for me, both professionally and personally.
There are many people that deserve my gratitude and thanks for their contributions to the thesis and support in the working process. First and foremost I would like to thank my supervisor, Professor Arild Hervik, who has shared his knowledge and experience with me. I would also thank him for letting me partake in some interesting meetings and events and for giving me comments and feedback that was of great value to the results of this thesis. I would also like to thank Istad, who gave me an interesting introduction into the characteristics of the power situation in Møre og Romsdal, and who also provided me with comments at the end of the thesis. Next, a big gratitude also goes to Maria Sandsmark at Møreforsking Molde, who gave me highly valuable suggestions and feedback when finalizing the thesis.
Last, my family deserves huge appreciation for their care and support as well as encouragement to seize challenges and work hard towards a goal. Thanks to Tore Louis, for your love, patience and support during this period and also generally for always supporting me in my endeavors.
_____________________
Bjørg Anita Berg Larsen Molde, March 2011
ii
Executive Summary
The power situation in Central-Norway and in Møre og Romsdal in particular is characterized by a capacity shortage. Growth in consumption from energy demanding industries and lack of
investments in transmission or production capacity has lead to a negative energy balance in the region. This strained power situation has proved to be challenging in periods with little precipitation and cold weather and has resulted in consequences for general consumers and industries in the region, especially relating to supply security, regional price differences and competitive disadvantage.
The power situation in Møre og Romsdal is the starting point and relevance of this thesis, where a case study named the “Geiranger Case” attempts to address the main problems and explore
the various investment alternatives that might improve or solve this capacity shortage. The main theoretical framework of the thesis is cost-benefit analysis (CBA). This is an economic
framework that address the investment alternatives from an economic approach, and identifies benefits and costs that can be priced or not, and compares these. The main parameters for comparison in the energy sector have been identified to include investment and operating costs. Disruption costs measured by KILE and other aspects of supply security, transmission losses and bottlenecks, system technical effects and a well-functioning market as well as environmental impacts. The aspect of time was also identified as an important factor in the investment decision.
The analysis of the Geiranger case study has looked at investment alternatives within transmission, production and end-user measures. The concession given overhead transmission line Ørskog-Fardal was used as the zero alternative in the thesis, and also included in the
analysis were four other investment alternatives. These were a redevelopment alternative that entailed a voltage upgrade on the existing 132 kV line Ørskog-Sykkylven-Haugen, a subsea cable on the route Ørskog-Store-Standal, a conventional gas-fired power plant with quota duty and a gas-fired power plant with ܥܱଶ capture and storage (CCS) from day one. The main findings from the impact assessment were that the four alternatives had higher investment costs than the zero alternative and the same or worse impacts on supply security. The most similar alternative to the concession given line is the redevelopment alternative, which has the same
iii characteristics if it can be implemented in 2015 expect an additional 360 MNOK investment cost and improved impacts on the environment. Alternatives that was assumed to be implemented later than the zero alternative, did not receive identical time benefits, in terms of reducing disruption costs, transmission losses and bottlenecks, improving regional price differences and connecting small power producers in Sogn og Fjordane. The gas-fired power plant alternatives did not have a benefit of connecting small power producers. The alternative with the least impact on the environment was found to be the subsea cable, which however has an additional cost of 2, 4 billion NOK and a later implementation time. If general consumers were to cover this additional “environmental cost”, a cost of 83 NOK per year for 25 years if considered a national public good would have to be paid or 650 NOK per year for 25 years if considered a regional public good. A summary of the findings from the case study is illustrated in table 0.1.
Table 0-1: Compilation of investment alternatives relative to the zero alternative Ørskog-Fardal
INVESTMENT COST
COMPLETION SUPPLY SECURITY ENVIRONMENT
Zero alternative (Ørskog-Fardal) 2600 MNOK 2015 Good Improves supply security in
Central-Norway and Sogn.
Poor
Significant impacts on the environment, with aesthetic
effects on high-value fjord landscapes Redevelopment (Ørskog-Sykkylven-Haugen) Additional 360 MNOK
2016 (2015) Waiting until 2016 and Same/worse using current line has
insignificant impact.
Better
Utilizes existing route and thus makes no “new” footprints, except larger masts and a new
transformer station
Subsea cable
(Ørskog-Store-Standal)
Additional 2400 MNOK
2017 Waiting until 2016 and Same/worse lengthier repair times
has little impact.
Better
Less aesthetic impacts as two-thirds of the line is located
subsea, but local impacts associated with landing facilities
Gas-fired power plant with quota duty
Additional 200 MNOK
2015 Will not improve Same/Worse supply security in
Sogn
Better/worse
Less aesthetic affects, however environmental costs associated
with emissions
Gas-fired power plant with CCS
Additional 2200 MNOK
2018 Waiting has little Same/Worse impact, but will not
improve supply security in Sogn
Better
Less aesthetic affects and deals with the costs associated with
iv The findings of the thesis suggest that a single conclusion as to the most economically
investment alternative in the Geiranger case cannot be drawn. The reason for this is that a ranking between the investment alternatives is not possible based on the CBA methodology. The zero alternative does however come out as having the most positive NPV from the investigated alternatives, and the subsea cable as the most environmentally friendly from the independent studies of environmental effects. A ranking of the transmission alternatives would mean a valuation of the WTP for the protection of environmental values, in which there is a lack of relevant information in the academia. The thesis also investigated two production alternatives, which included a conventional gas-fired power plant with quota duty and a gas-fired power plant with ܥܱଶ capture and storage from day one. The thesis concluded that both these alternatives cannot run a commercially profitable operation without government support, even though the requirements for CCS are relaxed.
The thesis further suggested that there can be a value of waiting for more information in terms of developments within consumption and investigating the public’s WTP in the environmental questions. There are however also benefits included in this thesis that favor investment alternatives that can be quickly implemented, such as connecting small power producers of renewable energy in Sogn og Fjordane, reducing the costs associated with supply security and reducing or eliminating the regional price differences between Central-Norway and the rest of the country.
v
Contents
Preface and acknowledgements………...………....i
Executive summary……….ii-iv List of tables and figures………..viii-ix Glossary and list of abbreviations………..x
1. Introduction ... 1
1.1. Research problem ... 3
1.2. Structure of the thesis ... 4
2. Methodology ... 6
2.1. Research questions ... 6
2.2. Research design ... 7
2.3. Classification of data and sources ... 8
2.4. Validity, reliability and objectivity ... 10
3. Theoretical Framework ... 11
3.1. Cost-Benefit Analysis ... 12
3.1.1. Definition and purpose of CBA ... 12
3.1.2. Theoretical foundations of CBA ... 13
3.1.3. Main steps in CBA ... 29
3.2. CBA applied in the energy sector ... 37
3.2.1. Electricity sector ... 37
3.2.2. Key parameters in the electricity sector ... 50
3.2.3. Practical implementation of CBA in the energy sector ... 66
3.2.4. Framework for measuring costs and benefits ... 68
3.3. Drawbacks/ critiques of CBA ... 70
3.3.1. Criticisms of the underlying efficiency criterion... 70
3.3.2. Inadequate specification of CBA ... 71
3.3.3. CBA in the political process ... 71
3.3.4. Alternatives ... 72
4. Case study: Geiranger ... 73
4.1. Problem and purpose specification ... 74
4.1.1. Background ... 74
vi
4.1.3. Consequences of energy shortage in Møre og Romsdal ... 80
4.1.4. Long-run measures: Zero alternative ... 88
4.1.5. Assumptions of the Geiranger case analysis ... 92
4.2. Specification of alternatives ... 93
4.2.1. Transmission ... 94
4.2.2. Production ... 100
4.2.3. End-user measures ... 106
4.2.4. Summary of alternatives to be included in the analysis ... 107
4.3. Specification of impacts ... 108
4.3.1. Zero alternative ... 109
4.3.2. Redevelopment alternative ... 119
4.3.3. Subsea cable ... 126
4.3.4. Gas-fired power plant with quota duty ... 135
4.3.5. Gas-fired power plant with ࡻ management ... 147
4.4. Compilation and assessment of the cost-benefit analysis ... 153
4.4.1. Economic costs and benefits ... 153
4.4.2. Sensitivity analysis ... 159
4.4.3. Conclusion ... 162
5. Discussion and recommendations ... 164
5.1. Research problem discussion ... 164
5.2. Limitations ... 166
5.3. Recommendations for further research ... 167
6. References ... 168
7. Appendices ... 172
7.1. Appendix 1: Environmental studies of impacts from overhead transmission lines ... 172
7.2. Appendix 2: Electricity consumption in Central-Norway (2009) ... 173
7.3. Appendix 3: Steel masts ... 174
7.4. Appendix 4: Gas-price with varying crude oil price ... 175
vii
List of tables
Table 0-1: Compilation of investment alternatives relative to the zero alternative Ørskog-Fardal ... iii
Table 3-1: Summary of revealed and stated preference methods ... 25
Table 3-2: Main steps of a CBA (Modified after Finansdepartementet (2005)) ... 29
Table 3-3: Consequences of supply interruptions (de Nooij et al., 2007) ... 53
Table 3-4: Summary of studies on environmental costs in the Norwegian energy sector ... 60
Table 3-5: Summary of practical guidelines for conducting CBA in the energy sector ... 66
Table 3-6: Priced and Non-priced effects (Modified after Hervik et al., 2011) ... 69
Table 4-1: Power consumption in Møre og Romsdal 2009 ... 76
Table 4-2: Predicted consumption growth in Møre og Romsdal until 2025 ... 77
Table 4-3 Power production in Møre og Romsdal in 2009 ... 77
Table 4-4: Average yearly spot price for the different Elspot areas (NordPool, 2011b) ... 81
Table 4-5: Regional price differences for general consumers in Central Norway ... 82
Table 4-6: Zero alternative specifications... 89
Table 4-7: Specifications of the redevelopment alternative ... 94
Table 4-8: Subsea cable alternative specifications ... 97
Table 4-9: Hydro and wind resource potential in Central-Norway and Sogn og Fjordane (NVE, 2011) ... 101
Table 4-10: Specifications of the gas power plant alternative (IM, 2006a) ... 102
Table 4-11: Impacts assesses for the investment alternatives ... 108
Table 4-12: Zero alternative investment costs ... 109
Table 4-13: Transmission losses and bottleneck benefits of the zero alternative ... 112
Table 4-14: Environmental consequences from the zero alternative ... 115
Table 4-15: Time benefits of zero alternative ... 117
Table 4-16: Net present value zero alternative ... 118
Table 4-17: Investment costs of the redevelopment alternative (Modified after Statnett, 2010) ... 119
Table 4-18: Environmental consequences of the redeveloped alternative ... 122
viii
Table 4-20: Net present value of redevelopment alternative ... 125
Table 4-21: Total investment costs subsea cable alternative (Modified after Statnett, 2010) ... 126
Table 4-22: Environmental consequences subsea cable ... 131
Table 4-23: Benefits of subsea cable and time costs ... 133
Table 4-24: Net present value of subsea cable alternative ... 134
Table 4-25: Operating cost of gas-fired power plant with quota duty ... 137
Table 4-26: Delivered electricity from a gas-fired power plant with quota duty ... 142
Table 4-27: Environmental consequences gas-fired power plant with quota duty ... 143
Table 4-28: Time benefits of gas-fired power plant with quota duty ... 144
Table 4-29: Net present value of the gas-fired power plant with quota duty ... 145
Tabell 4-30: NPV with changing gas price and electricity price conditions ... 146
Table 4-31: Yearly operating costs of gas-fired power plant with management ... 148
Table 4-32: Delivered electricity from gas-fired power plant with management ... 149
Table 4-33: Time benefits from a gas fired power plant with ࡻ management... 150
Table 4-34: Net present value of gas-fired power plant with ࡻ management ... 151
Table 4-35: Summary of priced effects for all investment alternatives ... 154
Table 4-36: Summary of non-priced effects of all investment alternatives ... 156
Table 4-37: Consequence matrix ... 158
Table 4-38: NPV with a discount rate of 4 per cent ... 159
Table 4-39: NPV with an analysis period of 35 years ... 160
Table 4-40: NPV with varying assumptions of priced-effects ... 161
List of figures
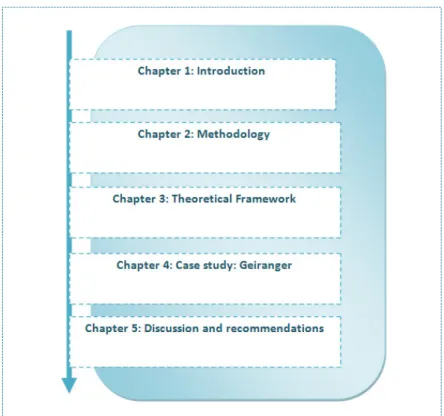
Figure 1-1: Structure of the thesis ... 5Figure 3-1: Main subjects in the theoretical framework ... 11
Figure 3-2: Pareto Efficiency (Modified after Boardman et al. 2011; p. 28) ... 15
ix
Figure 3-4: Cost and benefits in a CBA ... 32
Figure 3-5: The Electricity Market (Khosroshari et al., 2009) ... 38
Figure 3-6: The 10 largest power stations in Norway (OED, 2008) ... 41
Figure 3-7: Norway’s hydropower potential (OED, 2008) ... 43
Figure 3-8: Norwegian Transmission Network (Nordel as seen in Bye et al., 2010) ... 46
Figure 3-9: Categorization of different cost terms relating to supply security (Hofmann et al., 2010) ... 54
Figure 3-10: What costs the KILE-rates cover (Sintef, 2011) ... 55
Figure 3-11: Valuation criteria (Modified after SV, 2006) ... 63
Figure 3-12: Scope criteria (Modified after SV, 2006) ... 63
Figure 3-13: Consequence matrix of non-priced effects (SV, 2006) ... 65
Figure 3-14: Framework for measuring costs and benefits ... 68
Figure 4-1: Steps of CBA in the Geiranger case study ... 73
Figure 4-2: Planned new production capacity (Modified after Istad, 2010) ... 78
Figure 4-3: Future power balance estimates for Møre og Romsdal (Istad, 2010)... 79
Figure 4-4: Norwegian Elspot areas (Statnett) ... 80
Figure 4-5: Average monthly prices for the Elspot areas NO1 to NO5 (NordPool, 2011b) ... 81
Figure 4-6: Transmission loss conditions in Møre og Romsdal from 1998-2009 (Istad, 2010) ... 83
Figure 4-7: Quality of delivery and supply security (Modified after Istad, 2010) ... 85
Figure 4-8: Map of the zero alternative (Statnett, 2010) ... 90
Figure 4-9: Investment alternatives in the Geiranger Case ... 93
Figure 4-10: Map of the redevelopment alternative (Statnett, 2010) ... 95
Figure 4-11: Map of the subsea cable alternative (Statnett, 2010) ... 98
Figure 4-12: Location of a power plant in Elnesvågen ... 103
Figure 4-13: Example of a combined-cycle power plant ... 104
x
Glossary and list of abbreviations
BKK Term used to describe the area surrounding Bergen peninsula CBA Cost-Benefit Analysis
CCS ܥܱଶ capture and storage
ࡻ Carbon dioxide
Economics English name for the Norwegian term “Samfunnsøkonomi” GW Gigawatt, or one watt * 10ଽ
IEA International Energy Agency IM Industrikraft Møre
IRR Internal Rate of Return
KILE Quality-adjusted income limits of not delivered energy
KILE-rate Specific (normalized) interruption cost for an interruption with a given duration, Krone/ kW kV Kilovolt (1000 volt)
kW Kilowatt, or one watt * 10ଷ
kWh Kilowatt-hour = one kilowatt * one hour NOK Norwegian kroner
Nord Pool Norwegian Power Exchange
ࡺࡻ࢞ Oxides of nitrogen
NPV Net Present Value
NVE Norwegian Resources and Water Directorate
OED Olje- og Energidepartementet (Norwegian Ministry of Petroleum and Energy) PV Present Value
ࡿ Standard cubic feet
SV Statens Vegvesen (Norwegian Public Road Administrator) TCM European ܥܱଶTest Center Mongstad
TSO Transmission System Operator TW Terawatt, or one watt * 10ଵଶ
TWh Terawatt * one hour WTA Willingness to accept WTP Willingness to pay
1
1. Introduction
The demand for power in Norway and the rest of the world has grown rapidly in the last decade, and is expected to continue to grow in the future. Norway is one of the most energy demanding countries in the world, which is reflected in its high consumption per inhabitant. This dependence on energy in the modern world means that society is highly reliant on reliable and secure electricity supply. This is evident both within the private sphere, where important
household functions are dependent on electric power, and in the rest of society, where imperative social functions are dependent on a stable power supply (Hervik et al., 2011a). “The loss of electricity supply could thus after some time create significant problems for affected households and halt vital social functions” (Hervik et al. 2011; p. iv)1. Recent years has further shifted the focus from cost efficiency to supply security in the power system, as a result of the recent power disruptions in Europe.
The current electric power situation in Norway is compromising a reliable and secure electricity supply, due to lack of investments into production and transmission infrastructure to meet demand. The situation is particularly difficult in Møre og Romsdal in Central-Norway and BKK2 in Western-Norway. New investments will however often have negative impacts on the
environment, to a varying degree depending on the transmission choice and routing alternatives.
Hervik et al. (2011) write that the most cost effective routing alternatives for the network owner will often be located close to populated areas, and thus more people are exposed to the environmental impacts. A problem is thus often apparent, that the alternative with the lowest market costs will have the highest environmental costs.
The environmental problem has been evident from the debate concerning the overhead transmission lines that were concession given in Central and Western-Norway, between Sima-Samnanger and Ørskog-Fardal. Opponents have particularly suggested the use of subsea cables instead of overhead transmission lines as a more environmentally friendly alternative. The
1 Translated by author
2 proposed line Sima-Samnanger received so much negative media attention, that 4 expert
committees were given the responsibility to assess the feasibility of a subsea cable by the government. The reason was that opponents faired that the overhead transmission line would affect the internationally recognized landscape in Hardanger. These committees gave their final recommendations in February 2011. Committee 4 (Hervik et al., 2011a) looked at the economic3 impacts of the subsea cable alternative4, and concluded that no rankings were possible between the two. The two alternatives were seen as equal in terms of supply security and both had tradeoffs in terms of either higher investment costs for the subsea cable or higher environmental impact for the overhead transmission line. A ranking would thus denote a valuation of the willingness to pay for the protection of natural values against the high additional costs associated with cabling (Hervik et al., 2011a). Satisfactory information of WTP was not available and thus not applied in the analysis. A month after the committees submitted their reports to OED (01.03.2011), the government decided to uphold its original decision and subsequently maintained the concession to build the overhead line between Sima-Samnanger.
The findings from the “Hardanger” report and the decision reached for the BKK and the Sima-Samnanger line will be relevant to the investment choices in Møre og Romsdal and the proposed line Ørskog-Fardal. Disputes over this line has also been evident, particularly due to the impact
of the line on the world heritage listed fjord “Geirangerfjorden”. To avoid a similar situation as in the Hardanger scenario described above, Statnett has currently applied for a subsea cable on some of the route, namely Ørskog-Store Standal. Other alternatives are also under consideration, as the proposed line is under complaint handling with the Norwegian Ministry of Petroleum and Energy.
The situation in Møre og Romsdal is the starting point and relevance of this thesis. The main goal of this paper is to assess the investment alternatives in the region from a socioeconomic standpoint, through a case study called Geiranger. The analysis method is a cost-benefit analysis (CBA) and is described later in this thesis. The analysis by Hervik et al. (2011) of the Hardanger
3 In Norwegian: “Samfunnsøkonomi”
4 Refer the following link for the complete report by committee 4:
3 case will serve as a benchmark of how to carry out the CBA and is also a mean of comparing the results. Below is a description of the research problem that the thesis will aim at answering.
1.1.
Research problem
The first and principal step in the research process is to select and properly define the research problem. The research problem must be formulated, so it can become susceptible to research according to Sanjeev (2010). A research problem is one that aims at finding the best solution for a given problem in the context og a given environment (Sanjeev, 2010).The formulation of the research problem in this thesis is based on the introduction and background to the topic, which reflects on the difficulties in making energy investments which must consider the requirements of supply security as well as impacts on the environment. The problem therefore intends to answer the following question:
“What is the most economic electric power investment that balances the long-term impacts on the environment
against the short-term requirements of reliable and secure electricity supply?”
4
1.2.
Structure of the thesis
This thesis is divided into five main chapters, which will be built up to include methodology, a theoretical outline, the case analysis and some conclusions and recommendations. The structure of the thesis is illustrated in figure 1.1. A brief description of the contents in each chapter is described next.
Chapter 1
Chapter 1 gives an overview and background of the topic and an introduction to the research problem.
Chapter 2
The main goal of chapter 2 is to give a brief description of the methodology to be applied in the thesis. This includes a definition of the term, formulation of the research questions, description of the research design and a classification of data and sources.
Chapter 3
Chapter 3 is the theoretical framework and provides the main building blocks for chapters 4 and 5. This chapter is further subdivided into three main elements. The first section is a thorough description of cost-benefit analysis (CBA), including its definition and purpose, theoretical foundations and main steps. Next, an examination of CBA in the energy sector is carried out, which will be a key input to the case study in chapter 4. This section includes a description of the electricity market, key parameters, practical implementation and a framework for measuring benefits and costs. Last, an outline of the main critiques of CBA is presented together with alternative socioeconomic methods. This chapter will answer research question i, presented in chapter 2.1.
Chapter 4
The main work of the thesis will be carried out in chapter 4 and is the case study of the power condition in Møre og Romsdal, named the Geiranger case. The chapter will be based on the framework presented in chapter 3 and will include a background to the energy problems in Møre
5 og Romsdal, named problem and purpose specification. Next, the possible investment alternatives are specified together with a limitation of those alternatives that will be further analyzed in the next section. The third section will specify the impacts of the investigated alternatives before a compilation and assessment is made. A conclusion of the findings will also be given. This chapter will answer research question ii (refer chapter 2.1).
Chapter 5
The aim of chapter 5 is to summarize the main theoretical foundations of CBA in the energy sector in chapter 3 and the finding from the case study in chapter 4 in an attempt to answer the research problem presented in chapter 1.1. The chapter will discuss the answers to the research problems and give recommendations further research in the area.
6
2. Methodology
This chapter will give a portrayal of the methodology to be applied in this thesis, which can be defined as a structured method to reach a certain goal. Johannessen et al. (2004) write that methodology is about how one should proceed to obtain information about reality as well as how to analyze this information so it gives a new insight in economic conditions and processes. This chapter is divided into four main subjects. Firstly, the chapter will express the research questions to be applied in the thesis. Secondly, the research design is described, including an exploration of case study research. Thirdly, a classification of the data to be used in the thesis is outlined. Lastly, the terms validity, reliability and objectivity is described.
2.1.
Research questions
Research questions can be defined as inquiries that are asked with certain goals in mind, and in such a precise way that social science methods can answer them (Johannessen et al., 2004). Well defined research questions helps to refine and give direction to the analysis and contribute to an economization of the projects recourses according to Johannessen et al. (2004).
The research questions in this thesis have been formulated with the aim of having sufficient information to answer the research problem outlined in chapter 1. The following research questions have been developed:
i. What are the main theoretical buildingblocks of CBA and which buildingblocks of this theory is applicable to the energy sector?
a. What elements are monetized and which are quantifiable described? b. How is supply security quantified?
c. How is environmental impacts valuated and how can the visual impacts of overhead transmission lines be quantified?
7 ii. What are the characteristics of the power situation in Central-Norway and is an
overhead transmission line the most economic investment choice in this region?
a. What other alternatives are feasible to solve the power situation in the long-run? b. Are projects that are environmentally less intrusive priced higher in the market
also in the Geiranger case?
The above questions will be answered in chapters 3 and 4 in the thesis. Question i will be answered based on the descriptions of the theoretical framework in chapter 3. Chapter 4 will give an exploration of the Geiranger case and thus intuitively answer research question ii.
2.2.
Research design
Research design is a framework in which data is collected and analyzed with the aim of answering the initial questions of the study (Yin, 2009). “Decisions regarding what, where, when, how much and by what means concerning an inquiry or research study constitute a research design” (Sanjeev, 2010; p.36).
There is numerous approaches research design, which is often divided into quantitative and qualitative design methods. Quantitative methods involves the generation of data which can be
subjected to analysis in a formal and rigid manner (Sanjeev, 2010). This category of research can be subdivided into inferential, experimental and simulation approaches to research. Refer Sanjeev (2010) for a more detailed description of these methods. Qualitative methods are
characterized by the lack of one distinct analytical direction, and are mostly concerned with subjective assessment of attitudes, opinions and behavior according to Sanjeev (2010). This means that qualitative methods can be conducted in a variety of ways. One widely applied qualitative method is case design or case studies. Although both quantitative and qualitative methods are used for data collection in case studies, the latter will normally predominate in the study of processes (Gummesson, 2000).
8 This thesis will utilize the case study method, by identifying the investment environment in
Central-Norway with an in depth analysis of several investment alternatives in Møre og Romsdal that might affect Geirangerfjorden, thus named the Geiranger case study. Case study research is an empirical research method, and Yin (2003; 2009) write that the benefits of using this method are that it can deal with a variety of sources of evidence, observations and documents and in that sense paint a small picture reality. A case study investigates a contemporary phenomenon within its real-life context, assuming that the contextual conditions are highly pertinent to the phenomenon of study (Yin, 2009).
There are various characteristics of case study approaches, comprising of explanatory, exploratory and descriptive (Yin, 2003). The thesis will utilize an exploratory case study
approach, with the reasoning that the case study will be used to explore situations in which the interventions being evaluated has no clear, single set of outcomes (Yin, 2003). The explanations that are built will be founded in well-known theories, as described in chapter 3. This technique can lead to recommendations for future policy actions (Yin, 2009), which is the aim of this paper and thus a relevant method to be applied for the thesis.
2.3.
Classification of data and sources
The task of collecting data begins after the research problem and research questions have been defined and the design of the study planned. The method of data collection is dependent on the type of data which is needed, and a distinction can generally be made between primary and secondary data. Primary data is defined as new data which the researcher has collected and thus
happen to be original in character (Sanjeev, 2010). Secondary data is on the other hand data
which has already been collected by someone else and thus already passed through the statistical process (Sanjeev, 2010). This thesis will employ data from secondary sources, which are both quantitative and qualitative in nature. Quantitative methods are mostly relevant to compare the economic aspects of the various alternatives, as these are more easily quantifiable in monetary terms. Some aspects will be based more on qualitative theories and judgments and conversations with key informants.
9 Some of the main data sources needed in the thesis can include the following, but are not limited to:
Documentation
○ Documentation from sources such as:
The Norwegian Water Resources and Energy Directorate The Norwegian Ministry of Petroleum and Energy Statnett
Istad
○ Hardanger case information from expert committees ○ Academic papers
○ Textbooks Archival records
○ Statistical data ○ Maps and charts ○ Reports
Key informants
○ Conversations with supervisor Arild Hervik ○ Istad Kraft
10
2.4.
Validity, reliability and objectivity
These terms are used to reassure a level of quality in the data and sources of data described above. The terms are most often used for quantitative research, but also important to consider in all research approaches. Validity, reliability and objectivity will be important considerations in this thesis and thus below is a brief description of each.
Validity indicates the degree to which an instrument measures what is suppose to measure and in
that sense, how well the data represents the phenomenon of study (Sanjeev, 2010, Johannessen et al., 2004). One can make a distinction between three types of validity, namely content validity, criterion-related validity and construct validity. Sanjeev (2010; p.89) defines the three types as follows: “Content validity is the extent to which a measuring instrument provides adequate coverage of the topic under study. Criterion-related validity relates to our ability to predict some outcome or estimate the existence of some current condition. Construct validity is the most complex and abstract. A measure is said to possess construct validity to the degree that in conforms to predict correlations with other theoretical propositions”.
Reliability is related to the survey data and a measuring instrument is said to be reliable if it
provides consistent results (Sanjeev, 2010). This means that two or more researchers studying the same phenomenon with comparable purposes should in principle reach the same results, thus be replicable (Gummesson, 2000). Reliability is not as vulnerable as validity according to Sanjeev (2010), it is however easier to assess.
Objectivity is about how the researcher relate to the phenomenon of study, which should be
neutral and value free (Johannessen et al., 2004). Objectivity is therefore of basic importance “because it determines the data which are collected, the characteristics of the data which are relevant, relations which are to be explored, the choice of techniques to be used in these explorations and the form of the final report” (Sanjeev, 2010; p.101).
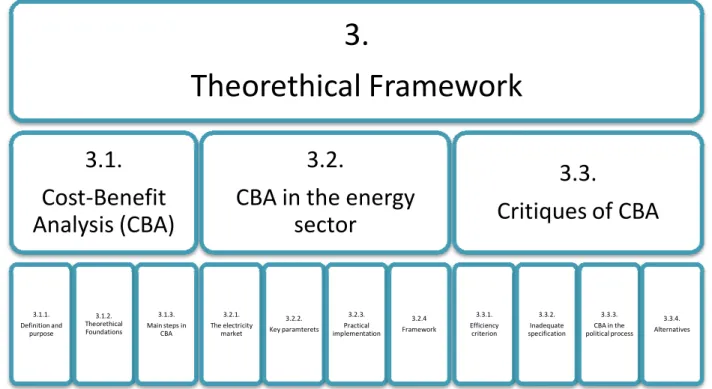
3. Theoretical Framework
This chapter of the thesis will give a thorough description of the theoretical framework that is important to conduct the analysis of the case study in the next chapter.
(CBA) is a widely used method to assess investment, and thus an important tool als Norway. The chapter is divided into three
main concepts within the CBA framework are described, including its definition and purpose, its conceptual foundations and its main steps. Second
described. This section highlights the main methodologies relevant to the case study in chapter four, including a short description of the electricity market, the key parameters influencing the economic investment decision, practical implementation of CBA and lastly a framework for illustrating benefits and costs in energy projects is developed. The third section of this chapter attempts to highlight the main critiques of CBA, with a summary of alternative
Figur
Theorethical Framework
3.1.
Cost-Benefit
Analysis (CBA)
3.1.1. Definition and purpose 3.1.2. Theorethical Foundations 3.1.3. Main steps in CBA The electricityTheoretical Framework
This chapter of the thesis will give a thorough description of the theoretical framework that is the analysis of the case study in the next chapter.
a widely used method to assess economic profitability of a project or public investment, and thus an important tool also for assessing investments within
chapter is divided into three main parts, as illustrated in figure
main concepts within the CBA framework are described, including its definition and purpose, its ons and its main steps. Second, the application of CBA in the energy sector is described. This section highlights the main methodologies relevant to the case study in chapter four, including a short description of the electricity market, the key parameters influencing the ecision, practical implementation of CBA and lastly a framework for illustrating benefits and costs in energy projects is developed. The third section of this chapter attempts to highlight the main critiques of CBA, with a summary of alternative
Figure 3-1: Main subjects in the theoretical framework
3.
Theorethical Framework
3.2.
CBA in the energy
sector
3.2.1. The electricity market 3.2.2. Key paramterets 3.2.3. Practical implementation 3.2.4 FrameworkCritiques of CBA
3.3.1. Efficiency criterion 11 This chapter of the thesis will give a thorough description of the theoretical framework that isthe analysis of the case study in the next chapter. Cost-benefit analysis economic profitability of a project or public o for assessing investments within the energy sector in figure 3.1 below. First, the main concepts within the CBA framework are described, including its definition and purpose, its plication of CBA in the energy sector is described. This section highlights the main methodologies relevant to the case study in chapter four, including a short description of the electricity market, the key parameters influencing the ecision, practical implementation of CBA and lastly a framework for illustrating benefits and costs in energy projects is developed. The third section of this chapter attempts to highlight the main critiques of CBA, with a summary of alternative methods.
3.3.
Critiques of CBA
3.3.2. Inadequate specification 3.3.3. CBA in the political process 3.3.4. Alternatives12
3.1.
Cost-Benefit Analysis
The CBA methodology has advanced over the years, with increased acceptance from both various disciplines and government agencies (Hanley and Spash, 1993). The use of CBA started in the US in the 1930s and advanced in the 1960s when the Minister of Transport in the UK adopted and promoted this method (Boardman et al., 2011). The CBA tool then spread around the world, and is applied in many different circumstances for many different purposes. A cost-benefit analysis is especially relevant for investments that are of public interest, as costs and benefits to society as a whole are considered. This is one of the reasons why many government agencies require the use of CBA in regulatory changes (Boardman et al., 2011). The Norwegian government has provided the public with a manual of how to conduct CBA, which is further used when assessing public policy projects (Finansdepartementet, 2005). This handbook, together with the textbooks of Boardman et al. (2011) and Nas (1996) are the main sources of literature applied when exploring CBA in section 3.1.
3.1.1. Definition and purpose of CBA
Finansdepartementet (2008) writes in their handbook that the main purpose of economic analysis is to map, visualize and systematize the consequences of a governmental policy and reform, before the decision is made. There are various tools used in assessing the economic profitability of a project, such as multi-criteria analysis (MCA) and cost-benefit analysis (CBA).
CBA is probably the most applied method and can be characterized as a policy assessment method that attempts to quantify in monetary terms the value of all consequences of a policy to the society (Boardman et al., 2011). The definition used in Nas (1996) is quoted as it gives a clear explanation of the term: “Under the CBA methodology, all potential gains and losses from a proposal are identified, converted into monetary units and compared on the basis of decision rules to determine if the proposal is desirable from society’s standpoint” (p. 1-2).
There are in practice four main types of cost-benefit analysis, which are described in Boardman et al. (2011). Firstly, there is the ex ante CBA, which is conducted before a decision is made.
13 This is the most common type, as the results of the analysis will be useful as part of the decision foundation and contributes to making it verifiable(NOU, 1998a). Next, CBAs may also give useful information after the project is conducted, and is called ex post CBA. This CBA will be
useful for evaluating the project, where mistakes from the project can be highlighted for future projects (NOU, 1998a). This type of analysis contributes to “learning” not only about the particular intervention, but the class of such interventions. The third type of CBA, is named in medias res analyses, and is conducted during the course of the life of the project. The main
purpose of this type of analysis is to highlight whether or not to continue the project, as well as costs and benefits can be predicted for future ex ante analyses. The last type of CBA is the
comparative CBA. This type compares ex ante CBA with an ex post (or in medias res) CBA for
the same project, and is most useful as a general mechanism for learning about the efficacy of CBA as a decision making and evaluative tool.
3.1.2. Theoretical foundations of CBA
Microeconomic theory, welfare economics and finance makes up the basic conceptual foundations of CBA (Boardman et al., 2011, Nas, 1996). The basic principles in microeconomics are dealing with social welfare and efficient allocations of resources, which are the roots of CBA. A public project is likely to affect the welfare of three main groups according to Nas (1996). These are individuals that are beneficiaries of the project, taxpayers who provide the funding for the project and those who incur losses as the project is implemented. The main task for those conducting a CBA is thus to identify these affected parties, calculates losses and gains and then identify whether the project is feasible from the standpoint of society (Nas, 1996).
The main concepts of the microeconomic theories of CBA are described in more detail in this section and can be divided into eight subsections. Firstly, economic efficiency and Pareto optimality are described as these concepts forms the basis for the CBA decision rule, which is explained next. Third, the concept of net benefits is described, which is based on willingness to pay and opportunity costs. Next, the concept of time is described and some measures of socioeconomic profitability outlined. Then, the discount rate is explained and how to define the correct one is assessed. The sixth concept is the presence of market failures and imperfections
14 and the next is the valuation of non-market goods. Lastly, the concept of option value is defined and described briefly.
3.1.2.1. Economic efficiency and Pareto optimality
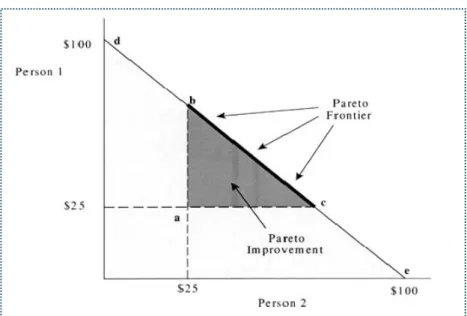
One of the main goals of CBA is to have an efficient resource allocation. Efficiency can be broadly defined as “a situation in which resources, such as land, labor, and capital, are deployed in their highest valued uses in terms of the goods and services they create” (Boardman et al., 2011; p. 27). A central concept within welfare economics is allocative or Pareto efficiency
(Nicholson, 1990). Pareto optimality is a standard of efficiency that describes the conditions that are essential to attain optimality in resource allocation. It is defined as “a state of economic affairs where no one can be made better off without simultaneously making at least one other person worse off” (Nas, 1996; p. 11).
To describe Pareto efficiency, the thesis will adopt the explanations and illustrations from Boardman et al. (2011), refer the figure below. The figure illustrates a situation which involves the allocation of a fixed amount of money between two people. Each person can receive any amount of money, from $25 to $100, depending on how they agree to split the money between them. Point a ($25, $25) can be called the status quo, and gives the amount the two people would
receive in an agreement about splitting the $100. The triangle abc is called the Pareto frontier,
because it represents a situation where it gives each person at least as much as the status quo, without making the other person worse off. This means that the status quo is not Pareto efficient and movements within the triangle abc are called Pareto improvements. One can thus conclude
that an allocation of resources is Pareto efficient when no further Pareto improvements can be achieved, and one person’s gain does not make the other person worse off.
15
Figure 3-2: Pareto Efficiency (Modified after Boardman et al. 2011; p. 28)
The figure above gives a simple illustration of how Pareto efficiency works in theory. However, this concept might be easy to understand and uncontroversial when all information is available, but few projects do in reality achieve Pareto-efficient allocations (NOU, 1997). This is the reason why CBA utilizes a decision rule that is based on the theory of Pareto efficiency, but that does not hold all its assumptions.
3.1.2.2. CBA decision rule
CBA utilizes a decision rule that might have less conceptual appeal than the Pareto efficiency, but much greater feasibility according to Boardman et al (2011). This rule is called the Kaldor-Hicks criterion and is much more flexible for a CBA, as it justifies any reallocation of resources as long as it raises net social benefits (Nas, 1996). The criterion forms the basis for the potential Pareto efficiency rule, which states that “as long as net benefits are positive, it is at least
possible that losers could be compensated so that the policy potentially could be Pareto improving” (Boardman et al., 2011; p. 32).
16 Projects that satisfy the Kaldor-Hicks criterion will in theory coincide with projects that have a positive aggregated willingness to pay. There are various justifications for applying the potential Pareto efficiency rule in cost-benefit analyses and Boardman et al. (2011; p.32) suggests the following four:
I. By always choosing policies with positive net benefits, society maximizes aggregate wealth.
II. It is likely that policies will have different sets of winners and losers, thus costs and benefits will tend to average out across people so that each person is likely to realize net positive benefits from the full collection of policies.
III. The rule stands in contrast to the incentives in representative political systems to give too much weight to costs and benefits that accrue to organized groups
IV. If a more equal distribution of wealth or income is an important goal, then it is possible to redistribute costs and benefits after a large number of policies have been adopted
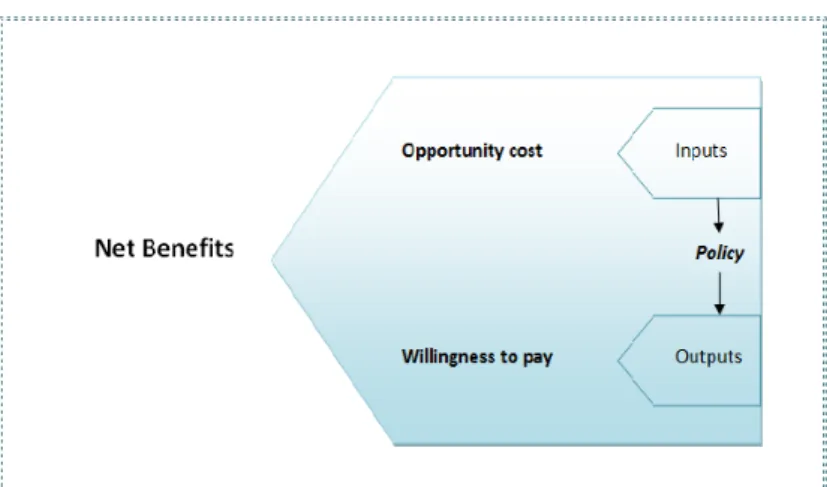
3.1.2.3. Net benefits
Net benefits are the “difference between the annual benefit stream and the annual cost stream” (Nas, 1996; p.121). Benefits can be defined as increases in human well-being or utility, while costs can be seen as reductions in human well being (Pearce et al., 2006). Benefits can be measured by either willingness to pay (WTP) or opportunity costs. WTP is the method for valuing the outputs of a policy and the opportunity cost is the method for valuing the resources required to implement the policy (Boardman et al., 2011). Confer the figure below for an illustration of the elements that make up net benefits.
17
Figure 3-3: Categorization of Net Benefits of Projects (Modified after Boardman et al. 2011; p. 29)
● Willingness to pay
The main principle behind using willingness to pay, is that the monetized value of a positive effect should be equal to the amount the population is willing to pay (WTP) to achieve it (Finansdepartementet, 2005). Willingness to pay is based on people’s preferences and income, which can be illustrated in the demand function of each consumer. The collected demand functions are known as the joint demand function (NVE, 2003). An economic viable project is thus an indication that the majority of the inhabitants is willing to pay at least as much as the policy costs. There may occur situations where the willingness to pay is larger than the total costs, but the project may not be desirable from the society’s standpoint. Finansdepartementet (2005) write in their handbook that there may be three reasons for this. Firstly, it may not be possible to measure all the impacts in NOK in a good way. Secondly, it is possible that the willingness to pay does not capture the welfare effects in its entirety and lastly, the policy makers may in addition to WTP be interested in how the effects are distributed across the society.
● Opportunity costs
The implementation of a policy almost always requires the use of some inputs that could be used to produce other things of value (Nicholson, 1990). The concept of opportunity costs are used in CBA to place a monetary value on the inputs required to implement the policies and forms the
18 cost element in the analysis (Boardman et al., 2011).The opportunity cost is thus the value that the society must forgo to use the input to implement the policy.
Although the definition of the concept appears simple, it is sometimes problematic to determine the opportunity cost or alternative cost. The simplest valuation of the opportunity cost are in those cases where the resources are traded in a free market, without price distortions and with an optimal distribution of incomes (NOU, 1997). The process becomes somewhat more difficult when the resources are not traded in a free market economy and thus the prices will not necessary reflect the true value of the alternative uses of these resources. Further, some situations occur where it will not be possible to determine the cost components and the alternative is to conduct an impact assessment (NOU, 1997). In an impact analysis the costs and benefits are described in physical sizes, and based on this information the decision maker can form a picture of how much resources that is expected to be utilized (NOU, 1997).
3.1.2.4. The time dimension
Costs and benefits rarely occur at the same time, thus a method to compare costs and benefits in different years are necessary. The most common methods to accomplish this are described next in this section, and include net present value, internal rate of return and the benefit-cost ratio. These three methods all represent measures of economic profitability.
● Net Present Value (NPV)
This is the most common method, and involves calculating the yearly benefit and cost elements into a present value. This measure compares whether the sum of discounted gains exceeds the sum of discounted losses (Hanley and Spash, 1993). Discounting reflects that a Krone today is not worth the same as a Krone tomorrow(NOU, 1997). The annual costs can be discounted separately and be deducted from the present value (PV) of the benefit stream, or alternatively, the net benefits can be discounted to find the NPV (Nas, 1996). Either way, the outcome will be the same.
19 A general formula for calculating the NPV was given in NOU (1998) and is as follows:
ܸܰܲ = −ܫ+ (1 + ݇)ܷ௧ ௧
ୀ
Where ܫis the investment costs that is assumed to accrue in year 0, ܷ௧ is the project surplus in year t, k is the discount rate that is assumed to be constant in the analysis time horizon , and n is the number of years the project lasts.
The project or alternative is profitable when the NPV is larger or equal to zero. When there are several projects, the alternative with the largest NPV is generally chosen (Boardman et al., 2011).
● Internal Rate of Return (IRR)
The internal rate of return, or breakeven discount rate, is the rate at which the NPV is equal to zero. The IRR can be found by solving the equation below (Adopted from NOU, 1997).
−ܫ+ + (1 + )ܷ௧ ௧
ୀ
= 0
In practice, the NPV and IRR methods will provide the same results (NOU, 1998a). Boardman et al. (2011) suggest that “IRR may be used for selecting projects when there is only one alternative to the status quo” (p. 158). The IRR relative to the appropriate discount rate indicates whether the project should be chosen or not, thus if the IRR is greater than the discount rate one should proceed with the project, if not, one ought not to (Boardman et al., 2011).
There are several limitations to the use of IRR. Firstly, there may not only be one discount rate at which the NPV is zero. Secondly, IRR is a percentage and not a monetary value, thus caution should be applied when selecting a project from a group of projects that vary in size (Boardman et al., 2011). Nevertheless, if it is unique, the IRR express valuable information to decision
20 makers or other analysts who want to know how sensitive the results are to the discount rate (Boardman et al., 2011).
● Benefit-Cost Ratio
Analysts often evaluate projects based on the benefit-cost ratio. A benefit-cost ratio can be employed to establish the viability of a project during any given year or over a time span (Nas, 1996). The ratio can generally be defined as described below (Adopted from NOU, 1997).
ܥ
ܤ = ܲݎ݁ݏ݁݊ݐ ݒ݈ܽݑ݁ ݂ ݐℎ݁ ݃ݎݏݏ ܾ݂݁݊݁݅ݐݏ ݃݁݊݁ݎܽݐ݁݀ ܾݕ ݐℎ݁ ݎ݆݁ܿݐܲݎ݁ݏ݁݊ݐ ݒ݈ܽݑ݁ ݂ ݐℎ݁ ݃ݎݏݏ ܿݏݐݏ ݎ݈݁ܽݐ݁݀ ݐ ݐℎ݁ ݎ݆݁ܿݐ
The rule is that the ratio should be larger than or equal to one, which basically means that the present value of the benefits should be larger than the present value of the costs to be profitable (NOU, 1997). One could also choose the largest ratio when comparing projects that are mutually exclusive (Pearce et al., 2006).
Although popular and simple to use, there are some well documented problems with using the benefit-cost ratio. First, the rule is highly sensitive to how costs and benefits are defined (Pearce et al., 2006). Another problem is that the ratio rule is incorrect when applied to mutually exclusive contexts. Boardman et al. (2011) also state that the cost-benefit ratio may be prone to manipulations. Due to the limitations and critiques of this ratio, Boardman et al. (2011) recommend that “analysts avoid using benefit-cost ratios and rely instead on net benefits to rank policies” (p. 34). NPV will therefore be used in chapter 4 of this thesis to rank investment alternatives.
21 3.1.2.5. Discounting and the choice of discount rate
The choice of discount rate will often have a large impact on whether a project is profitable or not and is thus also one of the most debated issues in CBA. “Discounting refers to the process of assigning a lower weight to a unit of benefit or cost in the future, than to that unit now” (Pearce et al., 2006; p. 184). The further into the future the benefit or cost arises, the lower the weight attached to it. There are two main reasons why benefits and costs in a CBA are discounted. Firstly, the future is associated with uncertainty, thus one cannot place the same weight on
future factors as elements in period 0, since there will be a large amount of factors that can possibly change in a period of say 25 years (Nilsen, 2003). Secondly, financial capital will be tied up when investing in a project, which can represent an alternative cost, such as investing
the capital in other projects or in a bank (Nilsen, 2003).
The discount rate should reflect what it will cost from a socioeconomic standpoint to tie up capital in long-term applications and one can thus see the discount rate as a form of calculation price (NOU, 1998a). The discount rate consists of two elements
- A risk-free rate (risk-free alternative cost)
- A risk premium (compensation from carrying risks)
NOU (1997) suggests that the Norwegian risk free rate should be around 3, 5 % per year. This
rate may however bee to low for projects that have a higher risk than regular projects. NOU (1998a) state however that the risk associated with future inflation may point to a lower long-term risk-free interest rate. The risk-free interest rate was in 2004 almost 2% lower than in 1997 (NOU, 1997), which indicates that the time is right for adjustment of the discount rate level (Hervik, 2004). Investments into the electric power system are examples of projects with higher risk than normal, and thus the discount rate should reflect some risk premium. The risk premium is dependent on a variety of factors and should reflect the risk associated with the
particular project, such as cyclical sensitivity and the share of fixed costs (Finansdepartementet, 2005). Hervik (2004) reported in 2004 that there is currently a trend in the international science literature to scale down the risk premium.
22
● The discount rate in energy projects
The discount rate to be used in energy projects in Norway is dependent on the size of the investment. With large or important individual projects, separate estimates for the discount rates should be made (NVE, 2003). For smaller project, standardized interest rates are used that are divided into pre-defined risk classes. Within each risk group a discount rate of 4, 6 or 8% is used, which is based on a risk free rate of 3,5% and a risk dependent premium of 0,5, 2,5 or 4,5% (NVE, 2003). This rate is in compliance with the practice other countries, where most government agencies today suggest a base-case discount rate of 7 per cent (Nas, 1996). Various authors are on the other hand now discussing whether this discount rate is too high, refer (Hervik, 2004, Jenssen et al., 2004, Andersen and Skjeret, 2003). Hervik (2004) argue that there are currently many conditions that suggest that the discount rate should be somewhat adjusted downward. In his report from 2004, Hervik analyzed the discount rate to be used specifically in
power grid investments, and concluded that a discount rate of 6% would be a fair estimate, however 5% would also not have been unreasonable (Hervik, 2004). In their socioeconomic analysis of network investments in Hardanger, Hervik et al. (2011a) used a discount rate of 4 %. Based on the foregoing discussion, the thesis will use a discount rate of 6% in the CBA in chapter 4. A lower estimate of 4% will be used for sensitivity analysis.
● The discount rate in long-term projects
A main argument relating the choice of discount rate is the length of the analysis period. Projects with a long duration will be highly dependent on the size of the discount rate to determine its profitability (Dalen et al., 2008). Examples of economic profitability studies with lengthy time horizons are investments in transportation infrastructure, some investments in the petroleum industry as well as investments in climate politics and environmental measures (Dalen et al., 2008). Various authors (Dalen et al., 2008, Boardman et al., 2011) therefore suggests that the discount rate should time declining. Boardman et al. (2011) suggests that for long lived projects, “benefits and costs should be discounted at 3, 5 percent for the first 50 years, at 2,5 percent for years 50-100, 1, 5 percent for years 100-200, 0, 5 percent for years 200-300, and 0, 0 percent for years more than 300 in the future” (p.156).
23 3.1.2.6. Market failures and imperfections
A key principle in the economic welfare theory is that an economy with perfect competition in all markets, under certain conditions, will achieve an efficient allocation of society’s resources (NOU, 1997). In practice however, these conditions may not be met and there will be a market failure. Markets may fail to achieve economic efficiency in the real world, as a result of imperfections in the markets, as the inability to provide for public goods, the presence of externalities, information asymmetry, public goods and tendencies of imperfect competition are examples of (Nas, 1996). Boardman et al (2011) affirm that market failures are an important concept for CBA, “as their presence provides the prima facie rationale for most, although not all, proposed government interventions that are assesses though CBA” (p. 78).
● Public goods
Nas (1996) write that public goods have two fundamental characteristics: “(a) they are nonrival in consumption, and (b) exclusion is either impossible or very costly” (p. 31). Nonrival consumption occurs when one person can consume a commodity without preventing others from consuming the same commodity. Exclusion indicates that if a good is supplied to one consumer, it is available to all consumers. This phenomenon is sometimes referred to as “jointness in supply” (Boardman et al., 2011). Goods that contain both these characteristics are referred to as “pure” public goods, where an example might be a country’s national defense. Some goods are not pure public goods, as consumption might be dependent on how many people who use it, such as a road (NOU, 1997). Such goods can be called “rivalry” public goods (Boardman et al., 2011).
Optimal supply of pure public goods should be determined in a way that the total willingness to pay for an additional unit, is equal to the marginal costs of producing this unit. In effect, the consumers have different marginal WTP, but the access is equal to everyone (NOU, 1997). This is the opposite situation than for private goods, where the price of the good is the same, but the consumption is normally diverse. The characteristics associated with public goods, connote that if the good is going to be produced, the government needs to intervene by either producing the good itself or subsidizing its production (Boardman et al., 2011, NOU, 1997).
24
● Externalities
Externalities are costs and benefits imposed on third parties, where the effects are not conveyed through the price mechanism (Nas, 1996). This makes it difficult to elicit prices and willingness-to-pay for these externalities. There can generally be both be positive and negative externalities, which represent benefits or costs to society. Positive externalities is a situation where there is a underutilization of resources and an example may subsidizing programs that benefit a local neighborhood. Common negative externalities are often impacts on the environment, such as air and water pollution (Boardman et al., 2011). Firms are generally not held accountable for such negative costs to society and individuals subject to the externality may not be compensated for the harm imposed on them (Nas, 1996). In many circumstances, the handling of negative externalities are left to the public to deal with (NOU, 1997)(NOU, 1997)(NOU, 1997)(NOU, 1997). This might be through measures such as environmental taxes (Finansdepartementet, 2005)
The reason for including externalities in CBA is to account for over- or underestimations of costs or benefits of a project and to reflect that there is a discrepancy between private and public costs of resource employment. The reason is that these externalities will not commonly be part of private profitability calculations, and must therefore be included in economic profitability computation (NOU, 1997).
3.1.2.7. Valuing non-market goods
Many of the impacts addressed in a cost-benefit analysis is intangible in nature and are not traded in actual markets (Pearce et al., 2006). As mentioned earlier in this thesis, it is difficult to observe peoples willingness to pay in these non-markets. In these conditions, the cost-benefit literature provides several direct and indirect approaches to valuate goods that carry non-market characteristics (Nas, 1996). These can broadly be divided into three main methods, which are revealed preference methods, stated preference studies and benefit transfers.
Revealed preference methods are based on observed behaviors, where individuals reveal their
25 willingness to pay for changes in provision of non-market goods or willingness to accept compensation for such changes, through a direct survey approach (Pearce et al., 2006). See the table below for a summary of the most common revealed preference methods. Stated preference
methods are more indirect methods that involve people disclosing their preferences through actual choices (Boardman et al., 2011). This is achieved by measuring demand for complementary goods to deflect demand for other goods. General stated preference methods are also summarized in the table below.
The third way of valuing non-market goods, involves using shadow prices from secondary sources (Boardman et al., 2011). Shadow prices, also called “benefit transfers”, are used when
observed prices fail to reflect the social value of a good or when observed values do not exist. Some shadow prices mentioned by Boardman et al. (2011) includes the value of a statistical life, the value of a life-year, the cost of crashes and the cost of injuries, the cost of crime, the value of time, the value of recreation, the value of nature, the value of water and water quality, the cost of noise, the cost of air pollution, the social cost of automobiles and lastly the cost of taxation. The value and appropriateness of shadow prices will depend on the number of studies carried out, as well as the closeness of that study to the study where transfers of data will be carried out.
Table 3-1: Summary of revealed and stated preference methods
Revealed Preference Methods Stated Preference Methods
Hedonic Pricing Method (HPM)* Contingent Valuation Method (CV)* Travel Cost Method (TCM)* Choice Modelling (CM)
Defensive Expenditure Method Market Analogy Method The Trade-Off Method Intermediate Good Method Asset Valuation Method
*These methods are the most common valuation methods and will be described in more detail below