SUCCESSFULLY MANAGING WORK ORDER BACKLOG AND RESOURCES Anthony J. Werderitsch, PE, CCE, PMP
Timothy Orr, and Kenneth R. Cross, PE
ACM – Administrative Controls Management, Inc. INTRODUCTION
Effectively managing a significant number of backlogged work orders and the resources required to accomplish the backlog are critical to having a world class maintenance organization. There are several maintenance measurements that are routinely tracked. They include overall equipment reliability, the ratio of maintenance costs to asset-replacement value, and the percent of work orders planned and
scheduled. This paper focuses on the development and implementation of a successful scheduling process using a project management system, which in addition to the useful purposes and benefits described in this paper, provides for the tracking of the percent of work orders planned and scheduled.
This paper presents the authors’ experiences with developing and implementing the scheduling system to achieve the customer objectives. The objectives included significantly improving the flow-through of backlogged work orders, providing look-ahead reporting for future work order requirements to maintenance management, operations, and engineering, and better managing of crews performing the work. Additional benefits provided by the scheduling system included crew compliance
reporting, past due work order reporting, and the comparison of planned and scheduled work orders to emergency work orders.
The development and implementation of the scheduling process followed two parallel paths. One path examined the maintenance process, the existing computerized
maintenance system, and the methods for integrating the mainframe maintenance system into the personal computer based project management system. The second path involved training all maintenance supervision, operations, area engineers, and management in basic planning and scheduling concepts and in use of the system.
The process development commenced with a series of meetings and interviews to determine the planning and scheduling skills and knowledge of the users, the existing work order process, and explanation of what the scheduling process was expected to contribute to their work efforts.
This paper provides a background of the customer’s maintenance environment, briefly describes the training program, and provides a more in-depth explanation of the
schedule process development. Additionally, a summary of the results of the schedule process implementation is presented.
BACKGROUND
The schedule process was implemented for a major manufacturing company having several process facilities located within one geographical area.
Prior to the engagement of the authors, the customer retained a consultant to
examine its maintenance processes and practices and recommend improvements. One of the recommendations was to implement a work order scheduling process. It was determined that non-scheduled, non-emergency work orders were costing four times as much to perform as work orders which were planned and scheduled.
The existing maintenance organization consisted of several hundred crafts that reported to foremen. The foremen reported to supervisors for work assignments and supervisors reported to maintenance managers. Plant operations, engineering, and maintenance used a computerized system for initiating work orders from many locations within the customer’s facilities. The time to accomplish the work orders ranged from less than one hour to more than a day.
The maintenance environment reflected emergency work orders and lost time ranging between 45 to 65 percent of maintenance crews’ time. Over 60 percent of the non-emergency work orders were backlogged in excess of nine weeks. Between eight and ten thousand work orders were processed every two weeks.
Non-emergency work orders consisted of 38 percent with less than five weeks backlog and the remainder ranged from between five and nine weeks (29%) to more than 20 weeks (18%).
At the start of the assignment, the number of backlogged work orders were in excess of 25,000. A review to reduce this backlog was performed by maintenance, engineering and operations. The backlog was reduced by eliminating work orders that were either completed but not reported, completed but lacking required paperwork, or had aged beyond effectiveness. The review reduced the backlog to approximately 17,000 work orders. This is the approximate level of the current system.
TRAINING
One of the action items identified in the interviews was a need for training
maintenance staff in basic planning and scheduling concepts. This training provided the maintenance organization with an understanding of the scheduling process and the tools for better management of work order scope, time, and resources. The training consisted of several two-day classroom sessions to accommodate the staff’s schedules. Over 130 maintenance staff personnel were trained in the scheduling process. The software supplier provided hands-on software training to system users. In addition to basic scheduling, the staff was also trained in the use of several concepts including examples from the planned scheduling process.
Information and summary schedule training was also provided to non-maintenance staff including operations management and engineering. They were shown what
maintenance was learning, how it applied to assisting them in accomplishing their goals for better effectiveness and responsiveness, and how the scheduling process would affect them.
PROCESS DEVELOPMENT Meetings with Craft Management & Management
After the initial planning and scheduling training, two types of meetings were held to discuss the implementation of the new scheduling system. Group meetings were conducted to give the maintenance management an initial view of what the system was and an expected schedule for the implementation. Other group meetings were held to give further updates on the system. The consultant also met with all of the maintenance directors, managers, and supervisors on an individual basis. This was done so they could provide input into the system that was being developed. At the meetings, both the new scheduling system and existing maintenance strengths and weaknesses were discussed. These meetings were critical to the smooth introduction of the new system into the existing corporate culture.
Integration of Information Systems
The integration of information systems required extensive interfacing with the maintenance department’s information systems personnel. A thorough review of the clients’ computer work order system began. The client entered all work orders into their mainframe computer maintenance management system called the Maintenance Control Program (MCP). The MCP system used a FOCUS database to store work orders. Information needed for the scheduling system was located and reports were written by the client's maintenance information systems personnel to extract the necessary
information. It was decided that the system should consider the next six months of work for the crews. This six-month period included approximately 25,000 work order tasks. Emergency work orders were excluded from the selection. These work orders involved corrective maintenance work above the designated priority level and crews responded to them as needed. The system required that three separate extractions be run to download the information. One extraction was needed for each of the following categories: 1) Corrective Maintenance work orders (included capital projects); 2) Preventive Maintenance work orders; and 3) future Preventive Maintenance work orders. These extractions produced an SQL file that was used to transfer the information. The size of the SQL files on the mainframe usually required that the extractions be run two times so the files would fit in a reasonable space on the
mainframe computer system. The extractions were broken down by areas of the facility. A decision was made to run the extractions and produce reports on a bi-weekly
schedule.
While extractions were being developed, the maintenance crews had been assigned with "housekeeping" of their work order backlogs. All work orders for the crews were to be reviewed for continued relevance, estimated labor hours, and correct craft
assignments. This "housekeeping" step was another key element in the success of this system. The review resulted in a large reduction in estimated labor hours because of
the corrections to the estimated labor hours and the cancellation of work orders that were no longer needed by the plant.
The information downloaded into the SQL files, from the mainframe computer system, was converted into database files using a database (dBase) program. The dBase files were then imported into Primavera’s Finest Hour using a batch import file. The system has since been changed to operate using Microsoft Access and P3 (Primavera Project Planner) in place of dBase and Finest Hour. The work order tasks were split into four separate projects on Finest Hour because the scheduling software had problems when processing over 10,000 activities at one time. Even though Finest Hour was reported to handle 100,000 activities, it could not handle a large amount of activities with the
associated activity codes without causing processing problems. The data was split into the four separated projects based on crew assignments. Once imported into Finest Hour, the data was further refined using batch Finest Hour Global Changes. After the data was ready, the four projects were then scheduled independently and then merged into a single project to produce the reports for analysis. Once the merged "scheduled" project was complete, the four individual projects were resource leveled. The four individual "resource leveled" projects were then combined into a single "merged" project. The merged "scheduled" and "resource leveled" projects were then used to produce the various reports for analysis.
REPORTS AND ANALYSIS OF DATA Resource Histograms & Summary Sheet
The merged "scheduled" project was used to produce resource histograms for each individual crew and a total histogram for the entire maintenance department. Once the resource histograms were printed, they were annotated with the amount of allowable scheduled hours for each crew. The allowable scheduled hours were determined by reviewing the past history of each of the crews. This review determined the percentage of time spent by a crew working on non-emergency and non-lost time activities. For example, if a crew had a compliment of seven people and averaged 40% of its time on scheduled activities, then the histogram would be annotated with a line at 112 hours (7 people x .40 x 40 hrs./wk. = 112 hours). After the scheduled hours were annotated, then the "Excess Workable Backlog Hours" were calculated. The Excess Workable Backlog Hours were calculated by taking the current estimated labor hours and
subtracting the Allowable Scheduled Hours and then dividing that number by 40 hours. For example, if a crew had current estimated labor hours of 216 and the same 40% allowable scheduled hours as above, then the
crew would have an Excess Workable Backlog of (216 hrs - 112 hrs)/ 40 hrs = 2.60 manweeks. The Excess Workable Backlog number was annotated on the crew resource histogram (See Figure 1).
Figure 1
The legend for Figure 1 shows the various types of work orders. Horizontal lines indicate preventive maintenance, diagonal lines represent corrective maintenance, black represents capital projects, white represents work orders that are on hold because of equipment unavailability, and gray represents work orders waiting for parts to arrive. The Excess Workable Backlog number would also be entered into the Total Excess Work Backlog spreadsheet (See Figure 2). This table compiled the excess workable backlog from all of the crews. This report also listed the crew size, percent of scheduled work (based on historical data), amount of scheduled weeks excess workable backlog, and unscheduled weeks of excess workable backlog. The scheduled and unscheduled excess workable backlogs were added together to produce the total weeks excess workable backlog. The Total weeks excess workable backlog was divided by the crew size to obtain total excess workable backlog per person. This last calculation was done to provide a standard number for maintenance managers and supervisors to review their backlogs. The last two columns are labeled HOLDP weeks per crew and HOLDE weeks per crew. HOLDP weeks per crew shows the amount of estimated labor hours on hold because of a lack of parts. HOLDE weeks per crew shows the amount of estimated labor hours on hold because of equipment unavailability.
TOTAL EXCESS WORK BACKLOG AS OF 01/02/97 Crew Crew Description Size %
Sched Sched Weeks E.W.B. Unsched Weeks E.W.B. Total Weeks E.W.B. Total Weeks E.W.B. per Person HOLDP Weeks per Crew HOLDE Weeks per Crew ELECTRICAL SA2E AREA 2 1 15% 0.78 0.70 1.48 1.48 0.78 0.63 SA6E CHEM PLANT 2 15% 0.38 1.70 2.08 1.04 0.53 0.30 SA4E AREA 4 2 15% 1.58 0.48 2.06 1.03 0.58 0.05 GTRU ADMIN 3 30% 5.00 1.10 6.10 2.03 0.13 3.64 SHP9 SHIPPING 2 35% 3.63 1.00 4.63 2.32 1.73 0.00
10 16.35
PIPEFITTER
NMG5 NIGHT MAIN. GROUNDS 2 10% 0.30 2.55 2.85 1.43 0.00 0.00 SA4P AREA 4 3 20% 1.65 2.15 3.80 1.27 1.83 1.28 SA6P CHEM PLANT 3 20% 2.48 1.28 3.76 1.25 0.75 0.00 SA2P AREA 2 4 15% 0.90 2.70 3.60 0.90 1.60 0.18 SA9P PHARM/IMAGING CHEM 3 30% 3.35 1.80 5.15 1.72 1.28 0.53
15 19.16
Figure 2
Bar Chart
Resource leveled bar charts were produced and given to the maintenance department personnel. This report graphically illustrated the work schedule of the highest priority work orders based for the available crew time. The resulting schedule was realistic and achievable based on priorities and crew availability. It had been stressed in the
informational meetings held earlier that the schedules should not be viewed as a rigid rule, but used to assist and guide the craft in determining priorities. Figure 3 shows an example of a resource leveled schedule
for a specific crew. Bar charts, grouped by operating units and plant areas, were also produced.
Compliance & Time Report
A compliance & time report was developed to measure the number of completed activities for each cycle. The report was run on the Monday following the next report cycle production. The compliance report analyzed the number of work orders that were scheduled to be completed versus the actual number of completed work orders. The completion rate was tracked in three different categories which included the following: (1) Week 1; (2) Week 1 & 2; and (3) Weeks 1-5. This tracking method was developed to allow the crews to complete future work orders if current work orders were not ready to work.
A breakdown of the current period actual labor hours were inserted on the right side of the report. Labor hours were broken down into the following three major categories: 1) emergency; 2) lost time; and 3) scheduled work orders. This report gave maintenance managers and supervisors actual hours spent and a percent of the crew total time for each category (See Figure 4).
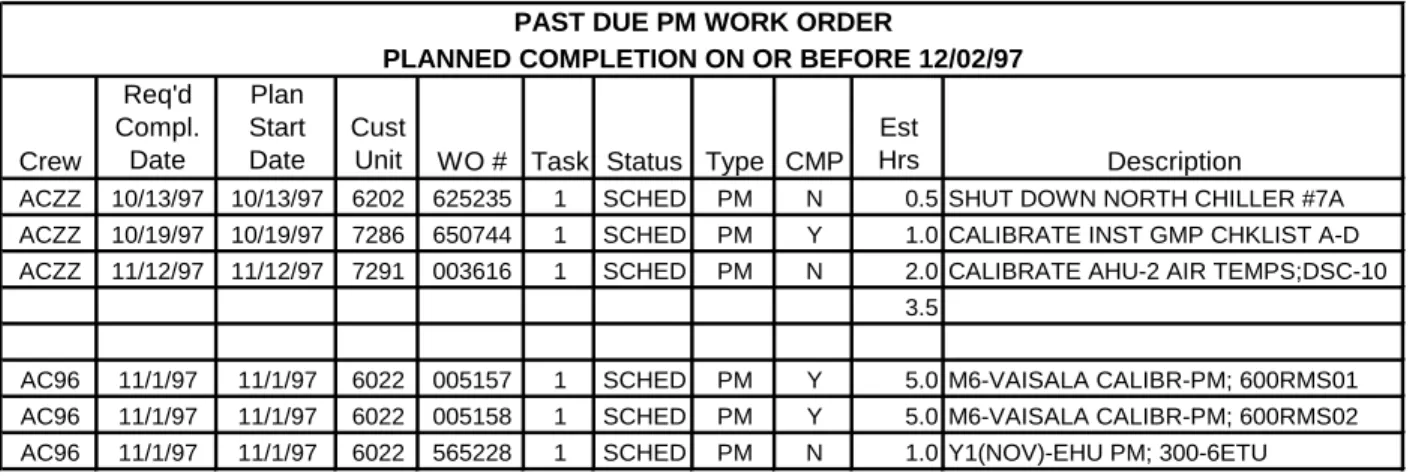
Past Due Work Order Reports
Past Due work order reports were developed for the various types of work orders. Figure 5 below shows the past due report sample for preventive maintenance work orders. The past due preventive maintenance work order report lists by crew the current work orders that are past due. The report for preventive maintenance work orders shows the requested/required completion date, current planned start, customer unit, work order number, work order task number, current work order status, certification maintenance program status or CMP, estimated labor hours and work order description. The certification maintenance program work orders were those work orders needed to meet federal regulations covering the industry. This column indicated whether a work order was part of that program. The reports for the other types of work orders contain information that is similar to Figure 5. Past due reports were created for the following types of work orders: emergency (EM), corrective/capital (SP), and shut down (SD).
Compliance Report for the First Quarter
Crew Week 1 Work Orders Week 1 & 2 Work Orders Week 1-5 Work Orders Emerg. Emerg. L.T. L.T. Schd Schd Compl'd Target % Compl'd Target % Compl'd Target % Hrs. % Hrs. % Hrs. % ACD1 9.0 53.0 17.0% 15.0 65.0 23.1% 16.0 105.0 15.2% 162.5 36.6% 71.0 16.0% 211.0 47.5% ACD2 45.0 120.0 37.5% 56.0 158.0 35.4% 67.0 217.0 30.9% 200.5 41.1% 150.5 30.8% 137.0 28.1% ACD3 10.0 14.0 71.4% 14.0 18.0 77.8% 37.0 51.0 72.5% 75.5 24.8% 56.0 18.4% 172.5 56.7% ACD4 10.0 16.0 62.5% 32.0 77.0 41.6% 41.0 102.0 40.2% 276.0 43.7% 249.5 39.5% 106.5 16.9% ACD5 8.0 9.0 88.9% 12.0 13.0 92.3% 17.0 18.0 94.4% 30.0 22.6% 70.5 53.2% 32.0 24.2% CF1 4.0 7.0 57.1% 4.0 8.0 50.0% 4.0 18.0 22.2% 22.0 39.3% 11.0 19.6% 23.0 41.1% CF2 27.0 39.0 69.2% 27.0 43.0 62.8% 27.0 73.0 37.0% 16.5 22.6% 20.0 27.4% 36.5 50.0% CF3 7.0 112.0 6.3% 8.0 120.0 6.7% 8.0 130.0 6.2% 82.0 40.0% 79.5 38.8% 43.5 21.2% CF4 29.0 35.0 82.9% 29.0 36.0 80.6% 30.0 48.0 62.5% 34.5 28.8% 53.5 44.6% 32.0 26.7% Figure 4
Figure 5 RESULTS
Improvement in the amount of time spent on scheduled activities is shown in Figure 6. Scheduled work showed a 14% improvement from 37% to 51%.
Figure 6 CONCLUSION
Benefits resulting from the scheduling process included a substantial reduction in emergency work order requests because non-emergency work orders were now being accomplished in a timely, organized, and prioritized basis. Plant operations and engineering were using planned and scheduled corrective maintenance work orders rather than relying on an emergency designation to get the work accomplished. The scheduling process assisted maintenance management and supervision to improve their utilization of critical crafts, and provide better coordination between maintenance, capital improvement projects, and operations. Management and supervision were able to resolve potential future resource assignment conflicts. The flow-through of work orders in the maintenance system improved significantly. Past due maintenance work orders were reviewed bi-weekly and priorities were re-established.
PAST DUE PM WORK ORDER
PLANNED COMPLETION ON OR BEFORE 12/02/97
Crew Req'd Compl. Date Plan Start Date Cust
Unit WO # Task Status Type CMP Est
Hrs Description
ACZZ 10/13/97 10/13/97 6202 625235 1 SCHED PM N 0.5 SHUT DOWN NORTH CHILLER #7A ACZZ 10/19/97 10/19/97 7286 650744 1 SCHED PM Y 1.0 CALIBRATE INST GMP CHKLIST A-D ACZZ 11/12/97 11/12/97 7291 003616 1 SCHED PM N 2.0 CALIBRATE AHU-2 AIR TEMPS;DSC-10
3.5
AC96 11/1/97 11/1/97 6022 005157 1 SCHED PM Y 5.0 M6-VAISALA CALIBR-PM; 600RMS01 AC96 11/1/97 11/1/97 6022 005158 1 SCHED PM Y 5.0 M6-VAISALA CALIBR-PM; 600RMS02 AC96 11/1/97 11/1/97 6022 565228 1 SCHED PM N 1.0 Y1(NOV)-EHU PM; 300-6ETU