STREAM METABOLISM ALONG AN URBAN TO RURAL GRADIENT IN LAKE SUPERIOR TRIBUTARY STREAMS
A THESIS SUBMITTED TO THE FACULTY OF THE GRADUATE SCHOOL OF THE UNIVERSITY OF MINNESOTA
BY
Jeremy Michael Erickson
IN PARTIAL FULFILLMENT OF THE REQUIREMENTS FOR THE DEGREE OF MASTER OF SCIENCE
Lucinda B. Johnson, Advisor
Acknowledgements
I would like to thank the following people for their help and support. I would like to thank my committee members, Dr. Lucinda Johnson, Dr. Richard Axler, and Dr. Brian Hill for their guidance in developing this project and also for their comments during the document preparation stage. I would also like to thank LaRae Lehto, Noah Kroening, Robert Hell, and Dan Breneman for their field assistance. I also received considerable help with understanding gas chromatography from John Ameel and using automated data logging equipment from Jerry Henneck and Elaine Ruzycki. Brian Black, Tom
Hollenhorst and the NRRI GIS lab provided extensive assistance in inverse distance-weighting of land use. Lastly, I would like to thank the Environmental Protection Agency Midcontinent Ecology Division for their laboratory analysis. This research was funded by Minnesota Sea Grant Project Number: R/EG-6.
Dedication
This thesis is dedicated to my parents Raymond and Lois Erickson who supported me throughout this endeavor and to Bailey Mae Erickson who instilled in me that every day in the outdoors is a good day.
Abstract
The North Shore streams of Lake Superior are known for their clear cool waters that flow through expanses of undeveloped land. However, many North Shore watersheds are experiencing rapid urbanization, resulting in increased impervious surface cover (ISC). Previous research on the impact of ecological disturbances on stream health have seldom focused on ecosystem processes such as stream metabolism. This study assesses the effect of increasing urbanization on whole stream community respiration (CR) and gross primary production (GPP) rates during summer and autumn base flow periods for nine low productivity, heterotrophic streams spanning a watershed ISC gradient. Land cover was measured as a percentage of the whole watershed and by distance-weighting to evaluate the possible influence of spatial position of land cover on stream function. Stream metabolism rates were determined using high frequency diel dissolved oxygen changes at a single station coupled with propane evasion to estimate stream reaeration rates. GPP estimates ranged from 0.02 to 2.02 g O2 m-2d-1 and CR from 0.17 to 6.09 g O2
m-2d-1. During summer base flows there were strong correlations between urban development measures and both stream metabolism and nutrients. However, the associations between land use and stream metabolism were not observed during the autumn base flow period. Our data suggest the variability in stream flow and leaf off along with stream temperature changes appear to be the dominant factors influencing the relationship between land use and stream metabolism in these Lake Superior tributary streams. Distance-weighting did not improve the predictive power on stream metabolism and water chemistry variables.
Table of Contents
Acknowledgements ... i Dedication ... ii Abstract ... iii Table of Contents ... iv List of Tables ... v List of Figures ... vi Introduction ... 1 Hypotheses ... 6 Methods... 6 Study area... 6Stream reach selection ... 7
Metabolism ... 7
Landscape analysis... 10
Data analysis ... 11
Results ... 12
Land cover ... 12
Reaeration estimates and metabolism ... 13
Summer base flows ... 13
Autumn base flows ... 14
Bulk versus inverse distance ... 15
Discussion ... 16
Stream metabolism... 16
Summer base flow... 16
Autumn base flow ... 19
Land use metrics: bulk versus distance-weighting ... 22
Conclusion ... 23
Bibliography ... 39
List of Tables
Table 1. Stream metabolism study site and watershed characteristics. (p. 26)
Table 2. Watershed bulk and inverse distance weighted (IDW) land cover gradients for the nine study streams. (p. 27)
Table 3. Mean stream metabolism estimates for the nine study streams during summer and autumn base flow. (p. 28)
Table 4. Pearson product-moment correlation coefficients relating summer base flow stream metabolism, chemical, physical, and habitat variables to 2001 NLCD watershed land cover proportions. (p. 29)
Table 5. Pearson product-moment correlation coefficients relating summer base flow chemical, physical and habitat variables to stream metabolism variables. (p. 30) Table 6. Pearson product-moment correlation coefficients relating autumn base flow stream metabolism, chemical, physical, and habitat variables to 2001 NLCD watershed land cover proportions. (p. 31)
Table 7. Pearson product-moment correlation coefficients relating autumn base flow chemical, physical, and habitat variables to stream metabolism variables. (p. 32) Table 8. Comparison of stream metabolism estimates from this study to other recent stream metabolism studies. (p. 33)
Appendix A. Mean water chemistry estimates for the nine study streams during summer and autumn base flow. (p. 46)
Appendix B. Mean physical and habitat estimates for the nine study streams during summer and autumn base flow. (p. 47)
Appendix C. Stream metabolism estimates for the nine study streams for the entire study. (pp. 48-49)
Appendix D. Stream physiochemical and habitat estimates for the nine study streams for the entire study. (pp. 50-51)
List of Figures
Figure 1. The balance of generation and consumption of oxygen, which forms the basis of stream metabolism measurements. (p. 35)
Figure 2. The streams and study site locations within the Lake Superior basin. (p. 36) Figure 3. The major land covers for each of the watersheds. (p. 37)
Figure 4. Relationship between stream metabolism variables GPP, CR, and NEP and land use proportions of impervious surface cover during summer and autumn base flows. (p. 38)
Introduction
The North Shore tributary streams of Lake Superior are known for their clear, cool waters that flow through expanses of undeveloped land. These streams also have a unique longitudinal profile consisting of gentle slopes in the headwaters that transition into steep slopes in the main and lower segments (Fitzpatrick et al. 2006). Along with aesthetic beauty, many of the streams have healthy ecosystems supporting diverse aquatic communities. The stream habitats also provide suitable conditions for trout with 16 designated trout streams in the vicinity of the city of Duluth, Minnesota alone. Several of the North Shore watersheds are experiencing rapid urban development, resulting in increased impervious surface, storm sewer drainage, riparian vegetation loss, and
deforestation. These types of anthropogenic alterations typically reduce stream health by generating flashier hydrographs, elevated sediments, temperatures, contaminants, and nutrients, altered channel morphology, and reduced biotic richness (Paul and Meyer 2001, Meyer et al. 2005, Walsh et al. 2005). Currently, 11 North Shore streams have been listed by the State of Minnesota as impaired for turbidity, and one (Miller) for increased water temperature under the total maximum daily load (TMDL) requirement of the Clean Water Act (MPCA 303.d List 2008). Previous research on the impact of ecological disturbances to stream health has relied on biotic community, physical habitat, or water chemistry studies, while few have focused on ecosystem function. Increasingly,
ecologists are attempting to measure stream ecosystem processes such as stream metabolism in assessing stream health (Bunn et al. 1999, Young and Huryn 1999,
Sweeney et al. 2004, Meyer et al. 2005, Bott et al. 2006, Izagirre et al. 2008, Young et al. 2008).
Stream metabolism is a collective term used to describe the stream ecosystem processes gross primary production (GPP) (the rate of formation of organic matter from inorganic carbon by photosynthetic and chemosynthetic organisms), and community respiration (CR) (the breakdown of organic matter to produce energy by both autotrophs and heterotrophs) (Bott 2006). By subtracting CR from GPP, one can calculate the net ecosystem production (NEP), a useful value in understanding whether the stream is autotrophic or heterotrophic. Similarly, calculating the gross primary production to community respiration ratio (P:R) helps quantify the amount of energy being supplied by autochthonous carbon sources versus allochthonous sources.Stream metabolism is
usually estimated by assuming that stream dissolved oxygen fluctuations are the net result of photosynthesis, respiration, and stream reaeration, the latter being the net flow of gases diffusing in and out of the stream (Figure 1).
Measuring stream metabolism in flowing waters was first performed by Odum (1956). He used diel hourly dissolved oxygen changes at an upstream and downstream site to estimate GPP and CR and used a series of empirically derived equations to correct for reaeration. To calculate CR the reaeration rate was subtracted from the dissolved oxygen rate of change. While Odum’s methods of utilizing upstream-downstream diel dissolved oxygen changes are still used in stream metabolism studies, more accurate methods and equations for estimating GPP, CR, and reaeration have since been
developed (Marzolf et al. 1994, Young and Huryn 1999, Hall and Tank 2005, Morse et al. 2007, Aristegi et al. 2009). Current methods for approximating whole stream
metabolism involve simultaneous measurements of stream diel dissolved oxygen concentration and stream reaeration.
A major challenge in accurately measuring stream metabolism metrics is accounting for stream reaeration, which is evident by the numerous estimation models and methods that have been developed (Genereux and Hemond 1992, Melching and Flores 1999, Morse et al. 2007). One of the most accurate methods, known as propane evasion, entails bubbling propane into the stream and then measuring stream propane concentration changes downstream to estimate the amount of gas diffusing out of the stream.
Stream metabolism estimates offer both an overview of stream health and also a general assessment of ecosystem services. Young et al. (2008) described stream
metabolism as being highly sensitive to many stressors including changes to riparian cover, siltation, nutrients, temperature, organic matter content, and discharge. Mulholland et al. (2005) further argued that stream metabolism is a valuable indicator of watershed disturbance because it is influenced by numerous stream characteristics, including hydrology, riparian width, in-stream vegetation, geomorphology, water chemistry, and biological communities, all of which are affected by watershed disturbances. Meyer et al. (2005) asserted that primary production and community respiration also provide valuable ecosystem services, such as removing nutrients from the water column.
Correlating stream metabolism with other parameters and as an indicator of stream health has had mixed results. Studies have found that GPP is often limited by light availability (Mulholland et al. 2001), nutrients, and grazing pressure (Rosemond et al. 1993). Community respiration has been linked to the availability of organic matter
(Petersen and Cummins 1974) and nutrients (Mulholland et al. 2001), while being regulated by temperature (Uehlinger et al. 2000). In their research on environmental controls of whole stream metabolism in one of the most industrialized regions of Spain, Izagirre et al. (2008) found GPP and NEP were negatively correlated with turbidity and population density. They also concluded CR was higher at sites with upstream
catchments containing industrial or urban sewage, as indicated by the positive correlation of ecosystem respiration with biological oxygen demand. However, they did not find a relationship between GPP and nutrient concentration or CR and water temperature. In contrast, Houser et al. (2005) concluded that CR in headwater stream catchments was negatively correlated with upland soil and vegetation disturbance, although GPP was insensitive to these stressors. They also found that intact riparian zones did not prevent the disturbed areas from affecting ecosystem respiration. In a study on the effect of differing vegetated land covers on stream metabolism, Young and Huryn (1999) found that different proportions of pasture affected rates of GPP, although, they had difficulty detecting any other effects of land cover on stream metabolism. Through research on indicators of response to riparian and catchment degradation, Bunn et al. (1999) determined that correlating primary production and respiration rates with degradation depended on primary land covers with the most robust relationships observed in
agricultural regions. Meyer et al. (2005) found that measures of stream metabolism were not correlated with catchment land cover or impervious surface cover (ISC) in urban streams. Aside from Meyer et al. (2005) relatively few studies have examined relationships between urban development and stream metabolism.
Stream GPP and CR are influenced by a large number of biotic and abiotic factors including nutrient levels, riparian zone characteristics, and geomorphic characteristics. These, in turn are strongly influenced by land cover within the basin. In understanding how land cover affects stream metabolism it is important to also consider what other stream characteristics including physiochemical and habitat factors that are altered.
Some researchers have focused on landscape inverse distance-weighting (IDW) as a means of addressing the spatial distribution of land uses relative to sample location (King et al. 2005, Van Sickle and Johnson 2008). In IDW, land use closer to the sample site is given a higher value or weight than the same land use farther from the site. King et al. (2005) quantified the effect of land use distances on in-stream nitrate-N and
macroinvertebrate assemblages, and concluded that cropland measured using IDW methods was a better predictor of nitrate-N in small watersheds than in large watersheds. They also determined that developed land located closer to the sampling site had the greatest effect on threshold macroinvertebrate assemblage responses. Van Sickle and Johnson (2008) evaluated how land use distance weighing affected the index of biotic integrity (IBI) of fish communities and found urban and agriculture many kilometers upstream of the sampling site still affected fish IBIs; however, they also concluded that land use greater than 30 m lateral to the stream channel had little, if any, effect on fish IBIs.Few, if any studies have looked at how spatial position of urban land use would affect stream metabolism.
Rapid development along the North Shore of Lake Superior is resulting in pronounced anthropogenic alterations to the stream watersheds (Anderson et al. 2003). While a few studies have looked at the impact of landscape on the biological, physical,
and chemical indicators of North Shore streams (Anderson et al. 2003, Brazner et al. 2004, Detenbeck et al. 2004, 2005), there have been no studies of the effects on ecosystem functions such as primary production, community respiration, and nutrient cycling. In this study, we determined the effects of increasing urbanization on stream metabolism. The specific objectives are to:
1) determine the effect of land use on whole stream metabolism along an urban to rural gradient,
2) assess the seasonal effects of flow on stream metabolism, and
3) determine whether distance-weighting of land cover categories (proportions of impervious surface cover and urban developed land use) influences whole stream metabolism.
Hypotheses
1) GPP and CR would be higher in watersheds with higher levels of urbanization due to higher nutrient inputs,
2) relationships between land use and metabolism would be strongest at low flow, and
3) distance-weighting would improve the explanatory strength of land cover on whole stream metabolism.
Methods Study area
This study was conducted on the western end of the Lake Superior basin in Minnesota, USA (Figure 2). Nine streams in the vicinity of Duluth, Minnesota (USA)
were selected, representing a gradient of increasing ISC and urban development. Urban development ranged from 2.5 to 45% with ISC ranging from 0.4 to 16.5% (Figure 3). The study streams have similar watershed areas, stream order, and slopes (Table 1).
Watershed areas ranged from 13.6 km2 to 46.9 km2. All of the streams were categorized as second order except one which was a first order stream. Stream characteristics are summarized in Table 1.
Stream reach selection
Stream reach distances were approximated for a single station study as per Chapra and DiToro (1991) resulting in stream reaches of 100 m to 150 m. Criteria for reach selection included dominance of run habitat, minimal riffle habitat, and no waterfalls. We also avoided reaches with stagnant pools, or tributaries to reduce interference with the downstream movement of conservative tracers.
Metabolism
Whole stream GPP and CR rates for the nine study streams were estimated using the single station diel method (Odum 1956). For each stream we calculated GPP and CR rates monthly during July, August, September, and October of 2008. Dissolved oxygen (DO) was measured every 15 minutes for 24 hours using Hach luminescent dissolve oxygen sensors (LDO). Sensors were calibrated prior to deployment and also checked for drift after deployment. Stream reaeration (kO2) was estimated using the propane evasion
and conservative tracer (chloride) method (Genereux and Hemond 1992). At the
upstream and downstream ends of our sample reach we collected propane samples using Monoject 60 ml syringes with a one-way stopcock. Same day analyses of propane
concentrations were performed by flame-ionization detection using a Hewlett Packard 5890A gas chromatograph (Hewlett Packard, Mississauga, Ontario, Canada) with a 6 ft 1/8 in stainless steel 80/100 mesh Polypak N column using helium as the carrier gas. The reaeration coefficient of propane was calculated using Marzolf et al.’s (1994) equation:
kpropane (1/min) = 1 ln (G1)/(C1)
Tt (G2)/(C2)
where, • G1 and G2 are the upstream and downstream propane concentrations,
• C1 and C2 are the upstream and downstream chloride concentrations, and
• Tt represents the time travel between stations.
Based on Rathbun et al. (1978), koxygen was calculated as:
koxygen = kpropane*1.39
We used Elmore and West’s (1961) equation to correct for the temperature effect on concentrations:
koxygen(t°C) =koxygen(i°C) X 1.024(t°C-i°C)
where, • t°C represents the water temperature during the field oxygen measurement and • i°C represents the water temperature during the propane evasion.
We estimated stream flow using the conservative chloride tracer as well as the discharge equation outlined by Nimick and Cleasby (2001):
Qi = Qpump (Concinj-Conci)
(Conci - Concb)
where, • Concinj was the injected chloride concentration,
• Conci was the stream plateau concentration,
• Qpump represented the flow rate of the chloride solution into the stream.
Along with discharge, the reach travel time was found by measuring the time between reaching 50% plateau chloride concentrations at the upstream and downstream stations. Travel time was divided by reach length to calculate velocity (v). The average stream width was estimated by measuring the width (w) every 10 m up the stream reach. We calculated the average stream depth (D) using the equation in Bott (2006):
D(mean) = Q/(v w(mean))
CR, GPP, NEP, and P:R were calculated using the equations for single station stream metabolism estimates outlined in Bott (2006) (Appendix C). While we were not able to measure the dissolved oxygen of ground water, we did address potential bias from groundwater inputs by estimating groundwater vertical velocity using the conservative (Cl-) tracer fractional decline equation in Hall and Tank (2005):
Qg/A = ((1-(Concds/Concus))*Qstream)/Areastream reach
where, • Concds was the background corrected downstream Cl- concentration,
• Concus was the background corrected upstream Cl- concentration, and
• Qstream was the stream flow.
Water samples from each site on each date were collected and analyzed for chloride (Cl-), ammonia-N (NH4-N+), total nitrogen (TN), and total phosphorus (TP)
using methods described in APHA 1998. Stream water temperature (averaged over a 24 hour period) and specific conductivity (SpCond) were also measured at each site using a Hydrolab MS5 data sonde (Appendix A and D).
Habitat surveys at each of the study sites were also conducted and included riparian canopy cover, substrate composition, sediment ash free dry weight (AFDW), and
coarse woody debris counts (CWD) (Appendix B and D). Each survey was done over a reach distance of 30 times the average stream width or at least 100 m. We measured riparian canopy cover using a densiometer every 10 m of the sample reach. Qualitative substrate percentages were estimated at seven locations across each 10 m transect. These percentages were then used to calculate median particle size (diameter (mm)) using calculations described by Kaufmann et al. (1999). AFDW sediment samples were collected at every 10 m transect. CWD (greater than 5 cm diameter) was counted for the entire reach. We chose these habitat and water chemistry variables to account for changes typically seen in urban streams (Walsh et al. 2005).
Landscape analysis
Watershed areas and land cover percentages were calculated using the ArcMap 9.3 (Environmental Systems Research Institute, Redlands, CA, USA) and Arc Hydro tools (Maidment 2002). This suite of tools allowed watershed areas to be calculated above our sample sites, along with flow direction and flow length for each pixel in the watershed. Land use measures were summarized as the proportion of the watershed upstream of each sample point (bulk) and as distance weighted measures (IDW).
In estimating the level of urbanization we calculated two different measures including ISC and urban development. ISC area was estimated using the 2001 National Land Cover Dataset (NLCD) (Homer et al. 2004) percent impervious layer in which each 30 X 30 m pixel has a calculated percent ISC. The percent ISC was calculated by
averaging all of the pixel percent ISC estimations in the watershed. Along with ISC, urban development percentages were also estimated by aggregating the 2001 NLCD
categories open development and low, medium, and high density development followed by dividing that area by the total watershed area. We believed that a substantial amount of stream nutrient inputs originates from fertilized lawns found in residential
neighborhoods (low density development) or golf courses (open development) and that these areas were appropriate for inclusion in the urbanization measurement. The 2001 NLCD was also used to estimate wetland and forest. Wetland and forest categories were aggregated from woody and emergent herbaceous wetland and deciduous, mixed and evergreen forest. These land cover classes were also summarized as a proportion of each watershed (Table 2). Because of the correlations between wetland and forest and the urbanization categories, our study focused only on the urbanization land use categories.
We also calculated IDW land use proportions using the equation of King et al. (2005):
1/[(flow length – min flow length) + 1]
where flow length is the shortest flow path distance from the pixel to the mouth of the stream. Minimum flow length is the distance from the stream sample site to the mouth of the stream. Adding “1” in the denominator ensures that all distance weighted values will be less than one. The proportion of distance weighted land use for a specific category, such as urban, was summed and then divided by the distance weighted summed values for all the pixels in the watershed, as described previously.
Data analysis
Initially we intended to collect all of our data during base flows. However, large intermittent rain storms occurred during September and October samplings, resulting in
substantially higher flows compared to July and August base flows. To account for this, all sample data were grouped by seasonal flow (summer base flow and autumn base flow). The summer base flow analysis pooled July and August data along with two samples at the beginning of September (n=19) while the autumn base flow analysis pooled September and October data (n=13) (Table 3). For each flow regime sample data was averaged for each site by flow regime. Impervious surface cover was further
categorized into low, medium and high groupings, based on the proportion of developed land cover. Relationships between land cover (either bulk or IDW) and nutrient, habitat, and stream metabolism measurements (CR, GPP, NEP, and P:R) were assessed by bivariate plots and Pearson correlation analysis. All statistical computations were calculated with Statistica (version 7, Statsoft, Tulsa, OK).
Results
Land cover
Bulk and IDW land use were remarkably similar for most categories (Table 2). The mean difference between bulk and IDW proportions for ISC and developed was 4.0% and 9.0% respectively. Wetland and forest had small mean differences of 2.0% and 9.0%
respectively. Overall, forest had the largest between-site difference while wetland had the smallest difference. Not surprisingly the dominant land use categories within each
watershed had the greatest shifts between bulk and IDW proportions. Keene Creek exhibited the greatest difference between bulk and IDW, with a shift of 30.0% and 25.0% for developed and forest respectively.
Reaeration estimates and metabolism
Over the four month study, kO2 estimated from propane evasion ranged from 10.8
day-1 to 76.3 day-1 (Table 3) (Appendix C). Overall, the streams had similar kO2 with a
mean of 32.0 day-1 (standard deviation = 8.0) during summer base flows and a mean of 42.6 day-1 (standard deviation =14.4) during autumn base flows. For both summer and autumn base flows, reaeration was correlated with percent canopy cover.
As a whole, GPP rates indicated that all the study streams had low productivity, ranging between 0.02 and 2.02 g O2 m-2d-1 (uncorrected per Hall and Tank 2005) (Table
3). CR varied more than GPP, ranging from -0.17 to -6.09 g O2 m-2d-1 (uncorrected per
Hall and Tank 2005). All but one of the P:R values were less than one while NEP values were negative for all but one of the samplings, indicating that all of the study streams were heterotrophic. Kingsbury (11/4/08), Mission (11/4/08), and Tischer (10/28/08) did not have large enough diel dissolved oxygen changes to accurately estimate GPP and CR rates.
Summer base flows
During summer base flow periods CR significantly increased (p<0.0002) and NEP significantly decreased (p<0.002) with increasing ISC (Figure 4). There was a weak positive association between GPP and ISC. There were no associations between P:R and land use (Table 4). There was a strong positive correlation between the proportion of ISC and Cl- and weak correlations between ISC and both NH4-N+and TN (Table 4). We also
Many of the associations observed with ISC were observed with the other urbanization measure, urban development. Similar to ISC, urban development had a strong positive association with CR and a strong negative association with NEP. Urban development also had similar associations with Cl-, NH4-N+, TN and canopy cover (Table
4). In addition urban development was a weakly (negatively) correlated with CWD abundance (-).
Each stream metabolism measure was significantly associated with at least one water chemistry or habitat variable (Table 5). We found a weak positive correlation between GPP and TN and a weak negative correlation of GPP with CWD. CR was positively correlated with NH4-N+, Cl-, and canopy cover and weakly correlated with TN.
Unlike CR, NEP was negatively associated with NH4-N+, Cl-, and canopy cover. There
was also a weak positive correlation between NEP and stream width. P:R had a strong positive correlation with stream width and weak negative correlations with NH4-N+ and
canopy cover (Table 5).
Autumn base flows
Many of the significant relationships detected during the summer base flow period were not observed during the autumn base flow period. Both water temperatures and stream flows were much more variable during the autumn base flow sample period (Appendix D). In contrast to summer base flows, there were no longer the strong associations between the urbanization categories ISC and development and the stream metabolism metrics CR and NEP (Table 6) (Figure 4). However, there was a positive correlation between ISC (distance-weighted) and P:R (Table 6).
Along with changes in associations between land use and stream metabolism we also observed some differences with associations between land use and both water chemistry and habitat variables during the autumn base flow period (Table 6). The correlations between the urbanization measures and the nutrients TN and NH4-N were no
longer found. However, ISC and development did have a strong positive correlation with Cl- and SpCond. There was also still a weak positive association between the urban measure development and canopy cover.
With the exception of GPP, stream metabolism was significantly correlated with several water chemistry variables (Table 7). As in summer, CR had a positive association with TN and NH4-N+, and was also positively associated with TP and water temperature.
However, we no longer observed the strong associations between CR and either Cl- or canopy cover. Conversely, NEP was negatively correlated with TP, TN, water
temperature and weakly correlated with NH4-N+. With the exception of NH4-N+, the NEP
correlations during autumn differed from the summer base flow correlations. P:R only had one significant correlation, a negative one with TN.
Bulk versus inverse distance
Overall we found IDW correlations were similar to or weaker than the bulk land cover correlations (Table 4 and 6). However, during higher base flow surveys in the fall, IDW land cover there were stronger correlations between both P:R and ISC, percent canopy cover and ISC, and NH4-N+ and urban development.
Discussion
Stream metabolism
We found strong relationships between stream metabolism and land use that were also highly influenced by seasonal patterns including flow regime and canopy cover. The stream metabolism estimates (NEP<0 and P:R<1) indicated that all nine study sites were located within highly heterotrophic streams. The range of GPP and CR were similar to other stream metabolism studies in forested streams (Table 8), while slightly lower than urban streams (Meyer et al. 2005). During summer base flows, both increasing ISC and development were associated with increasing CR and decreasing NEP. These results were consistent with the hypothesis that CR would increase with increasing urbanization. Although there were some positive associations between nutrients and both ISC and development, urbanization had very little effect on GPP. In contrast, during autumn base flows no significant relationships between land use and stream metabolism variables were apparent. Our data suggest that stream flow, leaf fall, and stream temperature changes are the dominant factors influencing the relationship between land use and stream metabolism in these unproductive and relatively pristine Lake Superior tributary streams.
Summer base flow
During the summer, the low GPP rates across the study sites were most likely due to canopy cover (ranging from 41 to 93%) which may have also masked other factors associated with urban development. In fact, in our study streams the canopy cover was highest in the watersheds with higher ISC, in contrast to many of our forested streams
whose riparian zones were dominated by herbaceous vegetation and shrubs. The dense canopy cover was partly attributed to the highly urbanized streams (Chester, Miller, and Tischer) having deep, narrow channels (Appendix B). In these confined channels the higher ISC would likely increase peak flows during storms thereby increasing bank and channel erosion (Paul and Meyer 2001). In addition, the immediate riparian zone of these streams is relatively natural with limited development. Streams with less urbanization including the French, Amity, and Mission were wider and thus less shaded by riparian vegetation. This unexpected relationship with decreasing canopy cover at the more rural sites meant more light would reach these streams. While GPP was not correlated with stream width, we did find positive associations between stream width and both NEP and P:R, thereby supporting this explanation. Overall, our urban streams appear to behave like forested streams, which have been found to be light-limited with low GPP rates (Mulholland et al. 2001, Fellows et al. 2006, Roberts et al. 2007).
Along with light limitation, our data also suggests that GPP was influenced by nutrient levels. There were no indications of any effects of urbanization on TP
concentrations, but there were moderate associations with NH4-N+ and TN. Although
previous nutrient limitation studies of western Lake Superior basin streams in Minnesota indicated N-deficiency or N+P limitation (but not P-deficiency) by the epilithon in summer (Wold and Hershey 1999, Rezanka and Hershey 2003), only a weak association was found between GPP and TN during our study. Despite the positive association between TN and GPP, and also between the urbanization categories and TN, we only observed a direct relationship between ISC and GPP but not with urban development
(Figure 4). We speculate that GPP was primarily regulated by nutrient availability in the rural streams and by light levels in the urban streams.
Contrary to GPP, ISC and urban development were strongly associated with increasing CR and decreasing NEP (Figure 4). Explanations for these trends could be attributed to a combination of dense canopy cover, elevated nutrient inputs, and potentially, organic carbon enrichment associated with urban development.
While canopy cover appears to have influenced GPP by decreasing light to the point of it limiting rates of photosynthesis, riparian vegetation likely also provided a source of nutrients for CR (Webster et al. 1997). In fact, strong relationships between canopy cover and both CR (+) and NEP (-) were observed during summer base flow. Allocthonous carbon and nutrient inputs from riparian vegetation have been observed in many studies to promote higher leaf decomposition and CR rates (Meyer and Johnson 1983, Suberkropp and Chauvet 1995, Webster et al. 1997, Greenwood et al. 2007, McTammany et al. 2007). We did observe higher TN and NH4-N+ in the urbanized
streams along with a weak positive correlation between canopy cover and NH4-N+. While
our data does suggest that both nutrients and allocthonous carbon could be supplied from the forest canopy, the higher stream nutrients could also be the result of nutrient loading from urbanization sources (e.g., lawn fertilizers, grass clippings, or road runoff).
Similar to canopy cover, the nutrients TN and NH4-N+ were positively associated
with ISC and urban development and CR. Higher TN (particularly NH4-N+) has been
regularly observed in urban streams (Paul and Meyer 2001) and has largely been attributed to lawn fertilizers (Carpenter et al. 1998, Groffman et al. 2004). The most urbanized watersheds in our study contain residential areas and golf courses with
well-manicured lawns suggesting fertilization throughout the summer. The positive correlation between nutrients and CR could reflect a substantial increase in autotroph respiration (Gücker et al. 2006). We would assume that as autotroph respiration increased we would also see an increase in GPP. However, we only saw a weak positive association between TN and GPP. Alternatively, higher inorganic nutrient levels could potentially relieve a limitation of bacterial and fungal metabolism, which has been reported in forested streams (Tank and Webster 1998, Stelzer et al. 2003).
We also found strong positive associations between Cl- and urbanization and also between Cl- and CR, a result consistent with the hypothesis that urbanization is increasing the loading of dissolved compounds to the streams (Hill et al. 2000). Since we did not include measures of dissolve organic carbon in this study, we can only speculate that this may have contributed to our results.
Autumn base flow
Unlike summer, there were no statistically significant associations between urbanization and GPP during the autumn base flow period. Possible reasons for the lack of a response include the higher variability in both stream flow due to rainstorms and canopy cover due to leaf fall. While every effort was made to complete sampling before leaf fall we were forced to extend our sampling due to rain events. During the autumn base flow period rain events of >3 cm occurred within a week of each of our field
surveys. Past studies have shown that GPP rates often drop significantly after a storm and remain low for a long period of time (Young and Huryn 1996, Uehlinger et al. 2003, Roberts et al. 2007), presumably due to scour of algae by bed moving flows and the
overall loss of photosynthetic biomass. The increased susceptibility of bed moving flows in urban streams is supported by data that suggests runoff can double in watersheds with 10 to 20% ISC compared to forested streams (Arnold and Gibbons 1996). This effect would imply that because of higher ISC the more urbanized streams would experience increased rock and sand scour from the higher peak flows (Lenat and Crawford 1994, Paul and Meyer 2001), resulting in lower GPP rates. Unfortunately, our study was not designed to immediately sample before and after storms. Therefore, in some instances we would sample two streams and then wait a week because of another storm that interfered with surveying the entire set of streams.
In addition to rain events, our attempt to maintain stable conditions during sampling was interrupted by leaf fall which dramatically decreased canopy cover, especially in the most urbanized streams. As a result, the overall mean GPP rates were much higher in October than during July. Hill et al. (2001) and Roberts et al. (2007) concluded that GPP rates can be much higher after leaf fall due to the increased sunlight, but would be moderated by reduced daylight hours in the autumn and shading by leaves in the channel. Along with increased sunlight, Lake Superior streams can also experience higher nutrient concentrations because of increased nutrient leeching from leaf fall (Wold and Hershey 1999). The stream samplings during the autumn base flow period were spread over the entire leaf fall season. Not surprisingly, stream temperatures also were quite variable during the autumn base flow period and also may have contributed to the lack of association between GPP and land use. Similar issues are likely to have played a role in the lack of association with CR as well.
Despite the lack of significant relationships between metabolism metrics and land use during the autumn base flow period, significant relationships were observed between metabolism and nutrient concentrations. The intermittent storms that occurred throughout the autumn base flow period potentially supplied the streams with both nutrients and allocthonous carbon. During this period there were associations between CR and NEP and TN, TP, and NH4-N+. Similar to GPP, CR rates can vary depending on when they are
sampled after a storm. Young and Huryn (1996), Uehlinger et al. (2003) and Roberts et al. (2007) found that while both GPP and CR rates decrease immediately after a storm, CR rates recover much more quickly. In fact, CR rates can sometimes surpass rates before the storm because of carbon inputs from the storm (Roberts et al. 2007). Similar to GPP, we believe that the autumn storms masked relationships between CR and land use.
Along with sampling between intermittent storms, the variability in when we sampled during leaf fall also potentially affected CR associations. Leaf fall began and was completed during the autumn sampling. A substantial supply of carbon and nutrients to the streams occurs during leaf fall (McTammany et al. 2007). Similar to GPP, we observed higher CR rates during October than in July, despite cooler water temperatures. The higher CR rates observed in the fall could be attributed to increased autotrophic and heterotrophic respiration from the elevated sunlight and organic matter. In support of this, very high CR rates from leaf litter accumulation have been observed even in pristine forest streams (Acuna et al. 2004). The observation that higher nutrients likely elevate decomposition rates also supports this argument (Meyer and Johnson 1983, Suberkropp and Chauvet 1995, Mulholland et al. 2001).
Finally, there was a positive association between CR and water temperature. This association has also been observed in studies by Bott el al. (1985), Sinsabaugh (1997), and Uehlinger et al. (2000). During summer base flows average daily temperatures ranged from 14.6 °C to 19.9 °C between sites. Over the course of the autumn base flow period stream temperatures dropped considerably with average daily temperatures of 2.8 °C to 13.2 °C between sites. Lower CR was most likely due to lower metabolic rates in the colder temperatures. However, this association was most likely mediated by the increased supply of organic matter (Roberts et al. 2007).
Land use metrics: bulk versus distance-weighting
We hypothesized that land cover IDW would improve the strength of the
relationship between stream metabolism and land cover. Overall, this hypothesis did not hold for stream metabolism metrics and abiotic stream characteristics, although, IDW did increase some of the correlation strengths for ISC and urban development during high base flows (Table 6). This observation is consistent with an assumption by Van Sickle and Johnson (2008) that during high flows land use farther from the stream would have increased in-stream influence from an expanded stream network caused by runoff. For the other land cover classes IDW did not consistently improve the correlations for any of the analyses. This does not align with the conclusions of King et al. (2005) and Strayer et al. (2003) who suggested that the spatial arrangement of land cover in small watersheds (< 10 km2) affects ecological response variables. King et al. (2005) found that IDW improved the predictive power of agriculture and development on nitrate-N and
found that land cover less than 30 m from the stream channel for many kilometers upstream influenced fish IBIs while land cover greater than 30 m from the stream had little if any effect. The median watershed size in the present study was over two times larger than the watershed size (<10 km) in which IDW improved land cover predictive power in previous studies (e.g., Strayer et al. 2003, King et al. 2005). In addition, the majority of urban land use in the Lake Superior tributary streams is located close to the sample points at the bottom of the watershed (Figure 3). Thus, distance-weighting would poorly discriminate spatial location in these streams. Along with spatial location the proportion of urbanization (specifically ISC) is relatively small with many of the watersheds being dominated by forest. Only two of the streams had ISC above 10% which is a threshold at which negative impacts have been observed (Klein 1979, Booth and Jackson 1997, Wang et al. 2000). It is possible that this gradient was not large enough to convey the impacts of having ISC or development close to the sample site. Another explanation is that urban watersheds typically have anthropogenic drainage networks that would lessen the signal of land covers near the stream, due to storm drains and other conveyance structures (Walsh et al. 2005). In other words, ISC away from the stream has much more influence to the stream than if it was not connected to storm drains. As a result, these North Shore streams may be poor candidates for analyzing land cover distance-weighting’s predictability on stream metabolism.
Conclusion
Our data suggests that while stream metabolism is indirectly influenced by urbanization because of nutrient inputs and canopy cover, these relationships can be
offset by natural phenomena including variability in hydrologic regime and leaf fall. The small size and steep gradients of these streams makes them much more susceptible to outside influences by both anthropogenic (nutrient loading and ISC influenced peak flows) and natural forces (rain events and seasonal changes) than large low gradient streams. This susceptibility can make it difficult to distinguish anthropogenic influences from natural influences on stream metabolism. While we attempted to control for as many variables (stream slope, watershed size, reach characteristics, reach habitat, and base flow) as possible, weather patterns and seasonal changes significantly influenced our study results. Our data does suggest that impervious surface ranging from 0 to 16.5% influences stream metabolism rates (especially CR and NEP), but these influences can be offset by variability in flow and light regimes. The drastic differences between seasonal flows exemplify the challenge of making stream metabolism generalizations for these streams and also other urban watersheds. Young et al. (2008) describe how anthropogenic changes to the landscape can have cooperative or antagonistic influences to a stream, an example being that the conversion of land to agriculture can raise GPP rates by increasing sunlight but also lower GPP rates by creating more turbid streams. The same concept holds true for understanding urban land cover effects on stream metabolism in the streams investigated in the present study.
Past studies have found significant bias in CR and GPP estimates from
groundwater inputs (McCutchan et al. 2002, Hall and Tank 2005). Using calculations described by Hall and Tank (2005) we found significant groundwater inputs (vertical groundwater velocities>0.20 m day-1) during most of our summer base flow samples and all our fall base flow samples. However, we were not able to determine whether the
increases in stream flow were due to groundwater inputs or upwelling of hyporheic water, although the fact that these streams area largely underlain with bedrock suggests that his increased flow may be largely derived from hyporheic sources. Without knowing the source or the dissolved oxygen concentrations of these inputs we were unable to calculate the bias to our stream metabolism measurements. However, these inputs could represent errors in our estimates.
From a management perspective one could argue that the higher CR rates found in urban streams are consuming more of the DO, consequently lowering stream DO levels. We did not observe a significant increase in GPP with increasing CR that would compensate for the consumed oxygen. However, the lowest DO levels were not below 6 mg/l which is considered a level harmful to many types of aquatic life. Authors including Bunn and Davies (2000), Gessner and Chauvet (2002), and Young et al. (2008), have argued that ecosystem services including stream metabolism should be included in stream assessments. Our data suggests that while stream metabolism measurements can be an overall indicator of stream function (our streams were highly heterotrophic even in an urban setting) they should not be used as a sole indicator of stream health because of the complexity in the confounding forces that affect them.
Table 1. Stream metabolism study site and watershed characteristics. Impervious surface classes L, M, and H represent 0.4-2.2%, 4.7-7.7%, and 10.0-16.5% respectively. Sites are ordered by increasing impervious surface cover.
Stream Watershed area (km2) Stream order Study reach slope (m/m) Study site elevation (m)
Watershed land use (proportion)
Impervious
class Impervious Developed Wetland Forest
French 46.9 2 0.01 246 L 0.00 0.03 0.07 0.85 Talmadge 13.6 2 0.02 251 L 0.01 0.04 0.14 0.77 Amity 42.8 2 0.01 215 L 0.02 0.09 0.01 0.80 Mission 27.2 2 0.01 207 L 0.02 0.10 0.02 0.73 Keene 14.2 1 0.01 198 M 0.05 0.20 0.01 0.69 Kingsbury 23.6 2 0.01 193 M 0.07 0.25 0.05 0.58 Chester 15.9 2 0.02 323 M 0.08 0.26 0.00 0.64 Tischer 18.9 2 0.02 232 H 0.10 0.37 0.01 0.58 Miller 24.8 2 0.02 335 H 0.17 0.41 0.02 0.48
Table 2. Watershed bulk and inverse distance-weighted (IDW) land cover gradients for the nine study streams. Urban developed
percentages were estimated from the 2001 National Land Cover Dataset (NLCD) land cover categories while impervious surface cover (ISC) percentages were estimated from the 2001 NLCD percent impervious layer. Sites are ordered by increasing ISC (bulk).
ISC Urban developed
Site Bulk IDW Bulk IDW
French 0.4 1.3 2.5 2.1 Talmadge 0.6 1.8 3.6 2.2 Amity 1.8 3.9 8.7 26.1 Mission 2.2 1.1 9.9 6.1 Keene 4.7 13.3 19.9 50.1 Kingsbury 6.8 12.2 24.5 25.9 Chester 7.7 11.6 25.5 35.1 Tischer 10.0 12.6 36.6 55.5 Miller 16.5 26.0 45.4 54.8
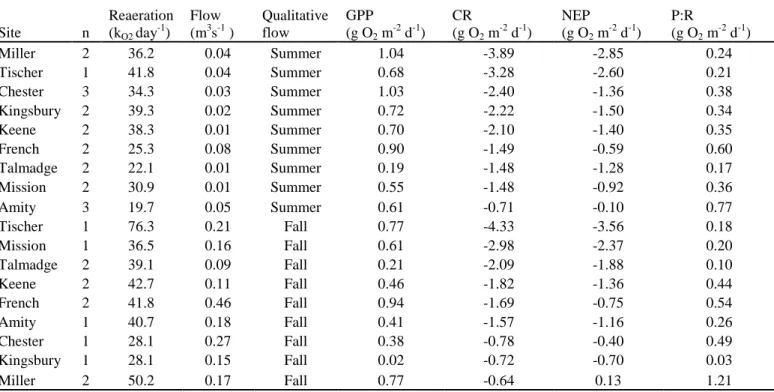
Table 3. Mean stream metabolism estimates for the nine study streams during summer and autumn base flow. The mean stream flow and reaeration rates are also displayed. Sites are ordered by qualitative flow and then decreasing CR.
Site n Reaeration (kO2 day-1) Flow (m3s-1 ) Qualitative flow GPP (g O2 m-2 d-1) CR (g O2 m-2 d-1) NEP (g O2 m-2 d-1) P:R (g O2 m-2 d-1) Miller 2 36.2 0.04 Summer 1.04 -3.89 -2.85 0.24 Tischer 1 41.8 0.04 Summer 0.68 -3.28 -2.60 0.21 Chester 3 34.3 0.03 Summer 1.03 -2.40 -1.36 0.38 Kingsbury 2 39.3 0.02 Summer 0.72 -2.22 -1.50 0.34 Keene 2 38.3 0.01 Summer 0.70 -2.10 -1.40 0.35 French 2 25.3 0.08 Summer 0.90 -1.49 -0.59 0.60 Talmadge 2 22.1 0.01 Summer 0.19 -1.48 -1.28 0.17 Mission 2 30.9 0.01 Summer 0.55 -1.48 -0.92 0.36 Amity 3 19.7 0.05 Summer 0.61 -0.71 -0.10 0.77 Tischer 1 76.3 0.21 Fall 0.77 -4.33 -3.56 0.18 Mission 1 36.5 0.16 Fall 0.61 -2.98 -2.37 0.20 Talmadge 2 39.1 0.09 Fall 0.21 -2.09 -1.88 0.10 Keene 2 42.7 0.11 Fall 0.46 -1.82 -1.36 0.44 French 2 41.8 0.46 Fall 0.94 -1.69 -0.75 0.54 Amity 1 40.7 0.18 Fall 0.41 -1.57 -1.16 0.26 Chester 1 28.1 0.27 Fall 0.38 -0.78 -0.40 0.49 Kingsbury 1 28.1 0.15 Fall 0.02 -0.72 -0.70 0.03 Miller 2 50.2 0.17 Fall 0.77 -0.64 0.13 1.21
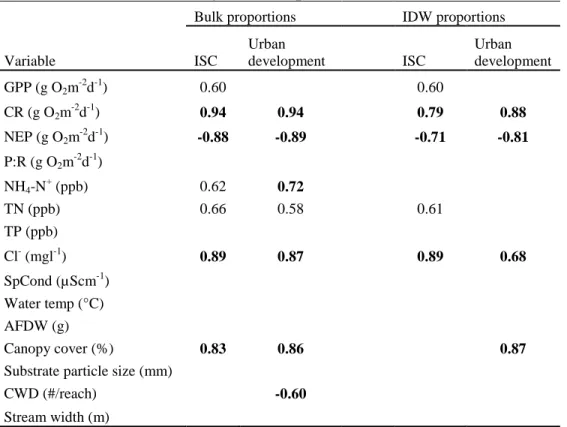
Table 4. Pearson product-moment correlation coefficients relating summer base flow stream metabolism, chemical, physical, and habitat variables to 2001 National Land Cover Dataset (NLCD) watershed land cover
proportions. Bold represents correlations significant at p<0.05 (n=9). Otherwise correlations are significant at p<0.10.
Bulk proportions IDW proportions
Variable ISC Urban development ISC Urban development GPP (g O2m-2d-1) 0.60 0.60 CR (g O2m-2d-1) 0.94 0.94 0.79 0.88 NEP (g O2m-2d-1) -0.88 -0.89 -0.71 -0.81 P:R (g O2m-2d-1) NH4-N+ (ppb) 0.62 0.72 TN (ppb) 0.66 0.58 0.61 TP (ppb) Cl- (mgl-1) 0.89 0.87 0.89 0.68 SpCond (µScm-1) Water temp (°C) AFDW (g) Canopy cover (%) 0.83 0.86 0.87
Substrate particle size (mm)
CWD (#/reach) -0.60
Table 5. Pearson product-moment correlation coefficients relating summer base flow chemical, physical and habitat variables to stream metabolism variables. Bold represents correlations significant at p<0.05 (n=9). Otherwise correlations are significant at p<0.10.
GPP (g O2m-2d-1) CR (g O2m-2d-1) NEP (g O2m-2d-1) P:R (g O2m-2d-1) GPP/AFDW ow (m3/s) NH4-N + (ppb) 0.70 -0.76 -0.64 0.69 TN (ppb) 0.64 0.59 TP (ppb) Cl- (mgl-1) 0.78 -0.72 SpCond (µScm-1) Water temp (°C) -0.59 Canopy cover (%) 0.85 -0.85 -0.60 0.61
Substrate particle size (mm)
Watershed area (km2) 0.60 0.85
Stream width (m) 0.59 0.81
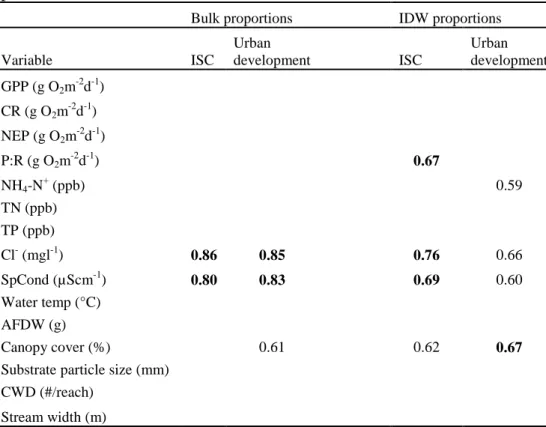
Table 6. Pearson product-moment correlation coefficients relating autumn base flow stream metabolism, chemical, physical, and habitat variables to 2001 NLCD watershed land cover proportions. Bold represents correlations significant at p<0.05 (n=9). Otherwise correlations are significant at
p<0.10.
Bulk proportions IDW proportions
Variable ISC Urban development ISC Urban development GPP (g O2m-2d-1) CR (g O2m -2 d-1) NEP (g O2m-2d-1) P:R (g O2m-2d-1) 0.67 NH4-N+ (ppb) 0.59 TN (ppb) TP (ppb) Cl- (mgl-1) 0.86 0.85 0.76 0.66 SpCond (µScm-1) 0.80 0.83 0.69 0.60 Water temp (°C) AFDW (g) Canopy cover (%) 0.61 0.62 0.67
Substrate particle size (mm) CWD (#/reach)
Table 7. Pearson product-moment correlation coefficients relating autumn base flow chemical, physical, and habitat variables to stream metabolism variables. Bold represents correlations significant at p<0.05 (n=9). Otherwise correlations are significant at p<0.10.
GPP (g O2m-2d-1) CR (g O2m-2d-1) NEP (g O2m-2d-1) P:R (g O2m-2d-1) Flow (m3/s) NH4-N+ (ppb) 0.60 -0.60 TN (ppb) 0.72 -0.82 -0.70 TP (ppb) 0.72 -0.69 Cl- (mgl-1) SpCond (µScm-1) Water temp (°C) 0.70 -0.71 Canopy cover (%)
Substrate particle size (mm) Watershed area (km2) Stream width (m)
Table 8. Comparison of our stream metabolism estimates to other recent stream metabolism studies. Many of the selected studies have similar methods to this study.
Authors Year Reaeration (kO2 day -1 ) Reaeration method GPP (g O2 m -2 d-1) CR (g O2 m -2 d-1) Stream metabolism method Location This study 2008 10.8-76.32 propane evasion 0.02-2.02 0.17-6.09 single station
Lake Superior North Shore streams Bernot et al. 2010 SF6, propane evasion 0.1-16.2 0.4-23.1 upstream downstream
Eight different regions in the US and Puerto Rico
Bott et al. 2006 4.55-59.16
propane
evasion 0.23-4.32 1.39-8.30
single station
Catskill Mountains mid to large size forested streams
Bott et al. 2006 4.6-234.1
propane
evasion 0.02-5.3 1.22-13.45
upstream downstream
Pennsylvania and Maryland forested and meadow streams
Hall and Tank 2003 SF6 0.13-0.6 1.59-5.76
upstream downstream
Wyoming limited to open canopy mountain streams
Hill et al. 1998 0-23.61 chambers
Appalachian mountain forest streams Houser et al. 2005 2-341 propane evasion 0.01-1.75 0.3-16.3 single station
Georgia 2nd and 3rd order plains streams
Meyer et al. 2005 0.43-1.89 1.31-8.72
Georgia forested and urban streams Mulholland et al. 2001 propane evasion 0.1-15 2.4-11 upstream downstream
Michigan and Oregon 1st to 3rd order streams Roberts et al. 2007 72-118.6 propane evasion 0.01-10.8 0.99 - 16.01 single station
Forested stream in eastern Tennessee Young and Huryn 1999 1-255 propane evasion 0.59-3.68 2.33-5.36 upstream downstream
New Zealand native and exotic forest and pasture
Figure Legends
Figure 1. The balance of generation and consumption of oxygen, which forms the basis of stream metabolism measurements.
Figure 2. The streams and study site locations within the Lake Superior basin. The nine study sites were located along the shore of Lake Superior near Duluth, Minnesota (USA). Figure 3. The major land covers for each of the watersheds. The 2001 NLCD categories were combined to form the classes developed (open, low, medium and high intensity development), forest (deciduous, mixed and evergreen forest), wetland (woody and emergent herbaceous wetland), and other. The category other includes the remaining 2001 NLCD categories.
Figure 4. Relationship between stream metabolism variables GPP, CR, and NEP and land use proportions of ISC during summer and autumn base flows.
Bibliography
Acuna, V., A. Giorgi, I. Munoz, U. Uehlinger, and S. Sabater. 2004. Flow extremes and benthic organic matter shape the metabolism of a headwater Mediterranean stream. Freshwater Biology 49:960-971.
Anderson, J., M. Evenson, T. Estabrooks, and B. Wilson. 2003. A water quality
assessment of trout streams on Lake Superior’s North Shore. Minnesota Pollution Control Agency Environmental Bulletin 2:1-8.
Arnold, C. L., and C. J. Gibbons. 1996. Impervious surface coverage: the emergence of a key environmental indicator. American Planners Association Journal 62:243-258. APHA, AWWA, and WEF. 1998. Standard Methods for the Examination of Water and
Wastewater, 20th ed. American Public Health Association, Washington, D.C. Aristegi, L., O. Izagirre, and A. Elosegi. 2009. Comparison of several methods to
calculate reaeration in streams, and their effects on estimation of metabolism. Hydrobiologia 635:113-124.
Bernot, M. J., D.J. Sobota, R. O. Hall, P. J. Mulholland, W. K. Dodds, J. R. Webster, J. L. Tank, L. R. Ashkenas, L. W. Cooper, C. N. Dahm, S. V. Gregory, N. B. Grimm, S. K. Hamilton, S. L. Johnson, W. H. McDowell, J. L. Meyer, B. Peterson, G. C. Poole, H. M. Valett, C. Arango, J. J. Beaulieu, A. J. Burgin, C. Crenshaw, A. M. Helton, L. Johnson, J. Merriam, B. R. Niederlehner, J. M. O’Brien, J. D. Potter, R. W. Sheibley, S. M. Thomas, and K. Wilson, 2010. Inter-regional comparison of land-use effects on stream metabolism. Freshwater Biology 55:1874–1890.
Booth, D.B. and C.R. Jackson, 1997. Urbanization of Aquatic Systems: Degradation Thresholds, Stormwater Detection, and the Limits of Mitigation. Journal of the American Water Resources Association 33(5):1077-1090.
Bott, T.L. 2006. Primary productivity and community respiration. Pages 533-556 in E R. Hauer and G. A. Lamberti (editors). Methods in stream ecology. Academic Press, San Diego, California 533-556.
Bott, T. L., J. T. Brock, C. S. Dunn, R. J. Naiman, R. W. Ovink, and R. C. Petersen. 1985. Benthic community metabolism in four temperate stream systems: an inter biome comparison and evaluation of the river continuum concept. Hydrobiologia 123:3-45.
Bott, T. L., J. D. Newbold, and D. B. Arscott. 2006. Ecosystem metabolism in Piedmont streams: reach geomorphology modulates the influence of riparian vegetation. Ecosystems 9:398-421.
Brazner, J. C., D. K. Tanner, N. E. Detenbeck, S. L. Batterman, S. L. Stark, L. A. Jagger, and V. M. Snarski. 2004. Landscape character and fish assemblage structure and function in western Lake Superior Streams: general relationships and
identification of thresholds. Environmental Management 33(6):855-875. Bunn, S. E., and P. M. Davies. 2000. Biological processes in running waters and their
implications for the assessment of ecological integrity. Hydrobiologia 422:61-70. Bunn, S. E., P. M. Davies, and T. D. Mosisch. 1999. Ecosystem measures of river health
and their response to riparian and catchment degradation. Freshwater Biology 41:333–345.
Carpenter, S. R., N. F. Caraco, D. L. Correll, R. W. Howarth, A. N. Sharpley, and V. H. Smith. 1998. Nonpoint pollution of surface waters with phosphorus and nitrogen. Ecological Applications 8(3):559-568.
Chapra, S. C. and D. M. Di Toro. 1991. Delta method for estimating primary production, respiration, and reaeration in streams. Journal of Environmental Engineering– ASCE 117:640–655.
Detenbeck, N. E., V. J. Brady, D. L. Taylor, V. M. Snarski, and S. L. Batterman. 2005. Relationship of stream flow regime in the western Lake Superior basin to watershed type characteristics. Journal of Hydrology 309:258-276.
Detenbeck, N. E., C. M. Elonen, D. L. Taylor, L. E. Anderson, T. M. Jicha, and S. L. Batterman. 2004. Region, landscape, and scale effects on Lake Superior tributary water quality. Journal of the American Water Resources Association 40(3):705-720.
Elmore, H. L., and W. F. West. 1961. Effect of water temperature on stream reaeration. Journal of the Sanitary Engineering Division ASCE 87:59-71.
Fellows, C. S., J. E. Clapcott, J. W. Udy, S. E. Bunn, B. D. Harch, M. J. Smith, and P. M. Davies. 2006. Benthic metabolism as an indicator of stream ecosystem health. Hydrobiologia 572:71-87.
Fitzpatrick, F. A., M. C. Peppler, M. M. DePhilip, and K. E. Lee. 2006. Geomorphic characteristics and classification of Duluth-area streams, Minnesota. USGS Scientific Investigations Report 2006-5029 1-54.
Gessner, M. O., and C. Chauvet. 2002. A case for using litter breakdown to assess functional stream integrity. Ecological Applications 12:498-510.
Genereux, D. P. and H. F. Hemond. 1992. Determination of gas exchange rate constants for a small stream on Walker Branch Watershed, Tennessee. Water Resources Research 28:2365-2374.
Greenwood, J. L., A. D. Rosemond, J. B. Wallace, W. F. Cross, and H. S. Weyers. 2007. Nutrients stimulate leaf breakdown rates and detritivore biomass: bottom-up effects via heterotrophic pathways. Oecologia 151(4):637-649.
Groffman, P. M., N. L. Law, K. T. Belt, L. E. Band, and G. T. Fisher. 2004. Nitrogen fluxes and retention in urban watershed ecosystems. Ecosystems 7(4):393-403. Gücker, B., M. Brauns, and M. T. Pusch. 2006. Effects of wastewater treatment plant
discharge on ecosystem structure and function of lowland streams. Journal of the North American Benthological Society 25(2):313-329.
Hall, R. O. and J. L. Tank. 2003. Ecosystem metabolism controls nitrogen uptake in streams in Grand Teton National Park, Wyoming. Limnology and Oceanography 48(3):1120-1128.
Hall, R. O. and J. L. Tank. 2005. Correcting whole-stream estimates of metabolism for groundwater input. Limnology and Oceanography: Methods 3:222-229.
Hill, B. H., R. K. Hall, P. Husby, A. T. Herlihy, and M. Dunne. 2000. Interregional comparisons of sediment microbial respiration in streams. Freshwater Biology 44: 213-222.
Hill, B. H., A. T. Herlihy, P. R. Kaufmann, and R. L. Sinsabaugh. 1998. Sediment microbial respiration in a synoptic survey of mid-Atlantic region streams. Freshwater Biology 39:493-501.
Hill, W. R., P. J. Mulholland, and E. R. Marzolf. 2001. Stream ecosystem responses to forest leaf emergence in spring. Ecology 82:2306-2319.
Homer, C. C. Huang, L. Yang, B. Wylie and M. Coan. 2004. Development of a 2001 National Landcover Database for the United States. Photogrammetric Engineering and Remote Sensing. 70(7):829-840.
Houser, J. N., P. J. Mulholland, and K. O. Maloney. 2005. Catchment disturbance and stream metabolism: patterns in ecosystem respiration and gross primary
production along a gradient of upland soil and vegetation disturbance. Journal of the North American Benthological Society 24:538-552.
Izagirre, O., U. Agirre, J. Pozo, and A. Elosegi. 2008. Environmental controls of whole-stream metabolism identified from continuous monitoring of Basque whole-streams. Journal of the North American Benthological Society, 27(2):252-268.
Kaufmann, P. R., P. Levine, G. E. Robison, C. Seeliger, and D. V. Peck. 1999.
Quantifying physical habitat in wadeable streams. United States Environmental Protection Agency. EPA/620/R-99/003.
King, R. S., M. E. Baker, D. F. Whigham, D. E. Weller, T. E. Jordan, P. F. Kazyak, M. and K. Hurd. 2005. Spatial considerations for linking watershed land cover to ecological indicators in streams. Ecological Applications 15:137-153.
Klein, R.D. 1979. Urbanization and stream quality impairment. Water Resources Bulletin 15:948-963.
Lenat D. R. and J. K. Crawford. 1994. Effects of land use on water-quality and aquatic biota of three North Carolina Piedmont streams. Hydrobiologia 294:185-199. Maidment D. R. 2002. Arc Hydro: GIS for water resources, ESRI Press, Redlands, Calif. Marzolf, E. R., P.J. Mulholland, and A. D. Steinman. 1994. Improvements to the diurnal
upstream-downstream dissolved oxygen change technique for determining whole-stream metabolism in small whole-streams. Canada Journal of Fisheries and Aquatics 51:1591-1599.
McCutchan Jr., J. H., J. F. Saunders III, W. M. Lewis Jr., and M. G. Hayden. 2002. Effects of groundwater flux on open-channel estimates of stream metabolism. Limnology and Oceanography 47:321-324.
McTammany, M. E., E. F. Benfield, and J. R. Webster. 2007. Recovery of stream
ecosystem metabolism from historical agriculture. Journal of the North American Benthological Society 26:532-545.
Melching, C. S. and H. E. Flores. 1999. Reaeration equations derived from US
Geological Survey Database. Journal of Environmental Engineering 125:407-414. Meyer, J. L. and C. Johnson. 1983. The influence of elevated nitrate concentration on rate
of leaf decomposition in a stream. Freshwater Biology 13:177-183. Meyer, J. L., M. J. Paul, and W. K. Taulbee. 2005. Stream ecosystem function in
urbanizing landscapes. Journal of North American Benthological Society 24(3):602-612.
Morse, N., W. B. Bowden, A. Hackman, C. Pruden, E. Steiner, and E. Berger. 2007. Using sound pressure to estimate reaeration in streams. Journal of the North American Benthological Society 26:28–37.
MPCA, 2008. Final MPCA 2008 TMDL List. Minnesota Pollution Control Agency, Environmental Outcomes Division, St. Paul, MN, St. Paul, MN,
http://www.pca.state.mn.us/water/tmdl/tmdl-303dlist.html.
Mulholland, P. J., C. S. Fellows, J. L. Tank, N. B. Grimm, J. R. Webster, S. K. Hamilton, E. Martí, L. Ashkenas, W. B. Bowden, W. K. Dodds, W. H. McDowell, M. J. Paul, and B. J. Peterson. 2001. Inter-biome comparison of factors controlling stream metabolism. Freshwater Biology 46:1503–17.
Mulholland, P. J., J. N. Houser, and K. O. Maloney 2005. Stream diurnal dissolved oxygen profiles as indicators of in-stream metabolism and disturbance effects: Fort Benning as a case study. Ecological Indicators 5:243-252.
Nimick, D. A., and T. E. Cleasby. 2001. Quantification of metal loads by tracer injection and synoptic sampling in Daisy Creek and the Stillwater River, Park County, Montana, August 1999: U.S. Geological Survey Water-Resources Investigations Report 00-4261.
Odum, H. T. 1956. Primary productivity in flowing waters. Limnological Oceanography 1:102–117.
Paul, M. J. and J. L. Meyer. 2001. Streams in the urban landscape. Annual Review of Ecology and Systematics 32:333-365.
Petersen, R. C. and K. W. Cummins. 1974. Leaf processing in a woodland stream. Freshwater Biology 4:343–368.
Rathbun, R. F., D. W. Stephens, D. J. Schultz, and D. Y.Tai. 1978. Laboratory studies of gas transfer for reaeration. Journal of Environmental Engineering 104:2377-2385. Rezanka, K. M., and A. E. Hershey. 2003. Examining primary producer-consumer
interactions in a Lake Superior tributary using 15N-tracer, grazer-reduction, and nutrient bioassay experiments. Journal of the North American Benthological Society 22(3):371-387.
Roberts, B. J., P. J. Mulholland, and W. R. Hill. 2007. Multiple scales of temporal variability in ecosystem metabolism rates: results from two years of continuous monitoring in a forested headwater stream. Ecosystems 10:588-606.
Rosemond, A. D., P. J. Mulholland, and J. W. Elwood. 1993. Top-down and bottom-up control of stream periphyton: effects of nutrients and herbivores. Ecology 74:1264–1280.
Sinsabaugh, R. L. 1997. Large-scale trends for stream benthic respiration. Journal of the North American Benthological Society 16:119-122.
Stelzer, R. S., J. Heffernan, and G. E. Likens. 2003. The influence of dissolved nutrients and particulate organic matter quality on microbial respiration and biomass in a forest stream. Freshwater Biology 48:1925-1937.
Strayer, D. L., R. E. Beighley, L. C. Thompson, S. Brooks, C. Nilsson, G. Pinay, and R. J. Naiman. 2003. Effects of land cover on stream ecosystems: roles of empirical models and scaling issues. Ecosystems 6:407-423.
Suberkropp, K., and E. Chauvet. 1995. Regulation of leaf breakdown by fungi in streams: influences of water chemistry. Ecology 76:1433-1445.
Sweeney, B. W., T. L. Bott, J. K. Jackson, L. A. Kaplan, J. D. Newbold, L. J. Standley, and W. C. Hession. 2004. Riparian deforestation, stream narrowing, and loss of stream ecosystem services. Proceedings of the National Academy of Sciences 101:14132-14137.
Tank, J. L. and J. R. Webster. 1998. Interaction of substrate and nutrient availability on wood biofilm processes in streams. Ecology 79:2168-2179.
Uehlinger, U., B. Kawecka, and C. T. Robinson. 2003. Effects of experimental floods on periphyton and stream metabolism below a high dam in the Swiss Alps. Aquatic Science 65:199-209.
Uehlinger, U., C. Konig, and P. Reichert. 2000. Variability of photosynthesis-irradiance curves and ecosystem respiration in a small river. Freshwater Biology 44:493-507.
Van Sickle, J. and C. B. Johnson. 2008. Parametric distance weighting of landscape influence on streams. Landscape Ecology 27:227-235.
Walsh, C. J., A. H. Roy, J. W. Feminella, P. D. Cottingham, P. M. Groffman, and R. P. Morgan. 2005. The Urban Stream Syndrome: Current Knowledge and the Search for a Cure. Journal of the North American Benthological Society 24(3):706-723. Wang L., J. Lyons, P. Kanehl, R. Bannerman, and E. Emmons. 2000. Watershed
urbanization and changes in fish communities in southeastern Wisconsin streams. Journal of the American Water Resources Association 36:1173-1189.
Webster, J. R., J. L. Meyer, J. B. Wallace, and E. F. Benfield. 1997. Organic matter dynamics in Hugh White Creek, Coweeta Hydrologic Laboratory, North Carolina, USA. Journal of the North American Benthological Society 16(1):74-78.
Wold, A. P., and A. E. Hershey. 1999. Spatial and temporal variability of nutrient limitation in six North Shore tributaries to Lake Superior. Journal of the North American Benthological Society 18(1): 2-14.
Young, R. G., and A. D. Huryn. 1996. Interannual variation in discharge controls ecosystem metabolism along a grassland river continuum. Canadian Journal of Fisheries and Aquatic Sciences 53:2199-2211.
Young, R. G. and A. D. Huryn. 1999. Effects of land use on stream metabolism and organic matter turnover. Ecological Applications 9:1359–1376.
Young, R. G., C. D. Matthaei, and C. R. Townsend. 2008. Organic matter breakdown and ecosystem metabolism: functional indicators for assessing river ecosystem health. Journal of the North American Benthological Society 27(3):605-625.