SPECTROSCOPYEUROPE 17
ARTICLE
ARTICLE
www.spectroscopyeurope.com
reached some 25 years ago with the advent of lasers capable of delivering pulses of light of tens of femtosecond duration. Femtosecond spectroscopy consists in exciting the system under study with a first pulse (called the pump) and probing it with a second laser pulse (called the probe), the time delay of which, with respect to the first, can be continuously tuned from tens of fs to several tens of ps, with the help of opti-cal delay lines. The huge development of ultrafast spectroscopy for the study of molecular systems gave birth to the field of femtochemistry, which was recognised by the Nobel Prize awarded to Ahmed H. Zewail in 1999.1 However, probe pulses
in the UV to visible spectral range cannot retrieve molecular structure and the next challenge was to generate ultrashort pulses of electrons or X-rays in order to directly probe the structural dynamics of the systems under study.
While several impressive develop-ments have been achieved since the early 1990s using ultrafast electron and X-ray diffraction and crystallography, our group has adopted the approach based on X-ray absorption spectroscopy.2,3 The
X-ray absorption spectrum of a given atom consists of saw-tooth-like features (called edges) at specific energies, riding on a continuous background, which correspond to transitions from core shells (1s, 2s, 2p1/2, 2p3/2…) to the ionisation
threshold. These edges are named after the core orbitals (K, L1, L2, L3…etc.) they
originate from. A zoom into one of the edges shows that they contain absorp-tion bands below the edge and modula-tions on the edge and beyond it (Figure
ARTICLE
ARTICLE
FASTLINK / ENTER 008 FOR FURTHER INFORMATION
Introduction
“If you want to understand function, study structure”, this sentence by Francis Crick, the co-discoverer of the double helix DNA structure, underlies the entire development of structural stud-ies with atomic resolution. This has had a profound impact not only in biology, but also enabling us to understand reac-tions in chemistry and phase transforma-tions in materials. However, functransforma-tions, reactions or phase changes represent a sequence of events over time. Therefore, it would be more accurate to state: “If you want to understand function, study time-dependent structure”. For this to be possible, one needs to combine the atomic resolution of modern structural tools [X-ray and electron diffraction, X-ray absorption spectroscopy, nuclear magnetic resonance (NMR)] with the atomic resolution of time, i.e. femto-seconds (1 fs = 10–15 s) to picoseconds
(1 ps = 10–12 s), which are the times
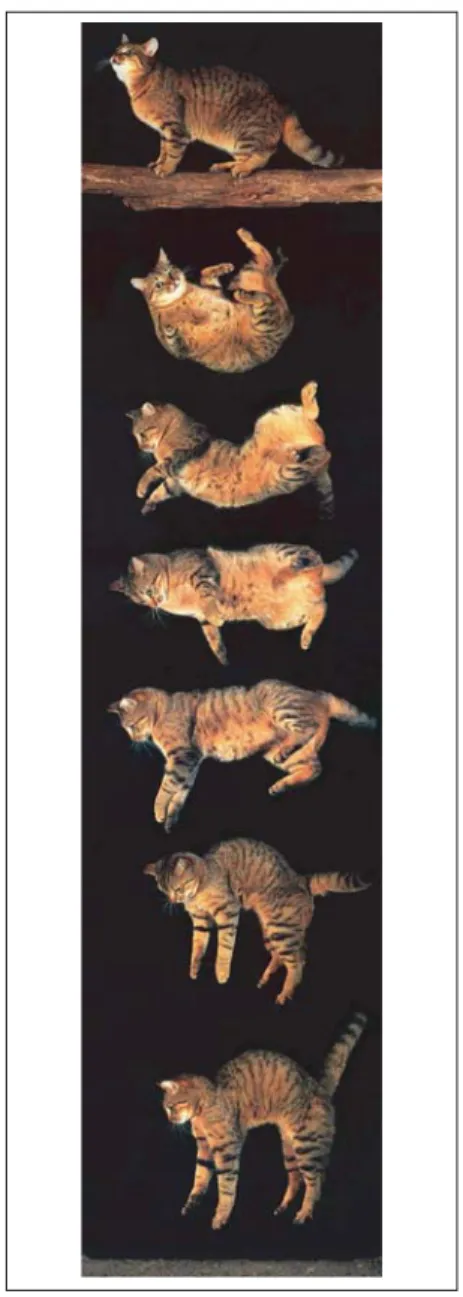
over which atoms and groups of atoms move in molecules, solid materials and proteins. In a way, we need to repeat what the French physiologist and anato-mist Etienne-Jules Marey did at the end of the XIXth century. Marey was studying animal motion and, in order to isolate it into snapshots, he developed the first shutter camera with millisecond resolu-tion, giving birth to cinematography (see Figure 1).
The atomic resolution of space was achieved almost a century ago with the advent of X-ray diffraction and, later, electron and neutron diffraction, X-ray absorption spectroscopy and NMR meth-ods. The atomic resolution of time was
Time-resolved X-ray absorption
spectroscopy
C.J. Milne
aand M. Chergui
ba
SwissFEL, Paul-Scherrer-Institut, CH- 5232 Villigen, Switzerland
b
Ecole Polytechnique Fédérale de Lausanne, Laboratoire de Spectroscopie Ultrarapide, ISIC,
Faculté des Sciences de Base, Station 6, CH-1015 Lausanne, Switzerland
Figure 1. Snapshots of a cat falling paws up and landing on them. Such films were first recorded at the end of the XIX century by the French anatomist and physiologist Etienne-Jules Marey, who developed a shutter camera for this purpose. Credit Line ????
2). The pre-edge features correspond to transitions from the core orbitals to the partially, or fully, unoccupied valence orbitals just below the ionisation thresh-old. They thus contain information about the occupancy, the nature and the split-ting of the valence orbitals, as well as about the oxidation state of the system. This is important, since the valence orbitals are those that make the chem-ical bonds of the atom with its neigh-bours. In a chemical transformation, be it photoinduced or otherwise, these valence orbitals will be affected and the changes can be visualised via the pre-edge transitions. The region at and just beyond the edge is called the XANES (X-ray Absorption Near Edge Structure) while the region approximately 50 eV or more beyond the edge is called the EXAFS (Extended X-ray Absorption Fine Structure). It is characterised by weaker modulations of the spectrum than in the XANES region.
The XANES and EXAFS modula-tions are due to the interference of the out going photoelectron wave that is generated at the X-ray absorbing atom, with the wave that is backscat-tered by the neighbouring atoms. These
modulations are, therefore, absent in the case of isolated atoms (for example, in the gas phase). The EXAFS is commonly used in structural studies of materials, molecules and proteins, due to its simple modelling. Briefly, after subtracting the pure atomic background and converting the spectrum from energy to wave vector units, the resulting EXAFS spectrum can be Fourier transformed to provide the number of and distances to the nearest neighbours. In other words, the EXAFS spectrum provides information very simi-lar to that of a radial distribution function with an accuracy better than 10–3 Å. It is
clear, therefore, that any change in the local structure will affect the amplitude and the pattern of the modulations.
To summarise, the advantages of X-ray absorption spectroscopy are that: (i) it can be implemented in any phase of matter and, especially as far as we were concerned, in liquids; (ii) it is element-specific, as one tunes to the atomic core transitions of a given element; (iii) it delivers information about the electronic structure of the element in question (type of bonding to neighbours, occu-pancy of valence orbitals, oxidation state etc.); (iv) it delivers structural information
numbers) about the nearest neighbour atoms.
X-ray absorption
spectroscopy with
picosecond to
femtosecond resolution
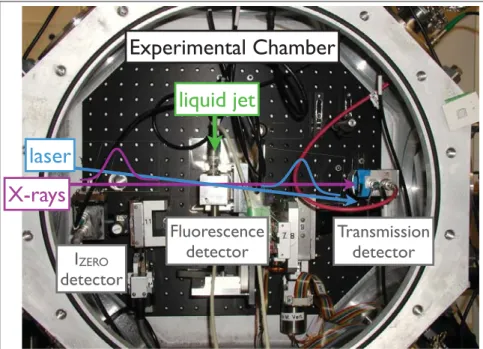
The implementation of time-domain X-ray absorption spectroscopy (XAS) requires a source of intense and energy-tuneable X-ray pulses and the best option to meet these requirements is synchrotron radiation. Synchrotrons are, however, limited in time resolution since the intrinsic synchrotron pulse duration is typically 50–100 ps. More recently,4 itbecame possible to extract femtosecond hard X-ray pulses from a synchrotron by co-propagating an intense femto second laser pulse with the electron bunch within a specialised insertion device in the stor-age ring, so that the interaction between them slices out two wedges that have the time structure of the laser pulse. With adequate X-ray optics, it is then possi-ble to separate the femto second X-ray pulses from the background X-rays due to the 50–100 ps pulse. The cost of this scheme is a dramatic drop in flux, but experiments are nevertheless feasible, as we will see later. We implemented time-resolved X-ray absorption spectroscopy in a pump–probe geometry (Figure 3), with the pump laser synchronised to the radiofrequency cavity of the synchrotron, exciting the sample, which is generally a flowing lamellar jet of the solution under study. The excitation occurs at a given repetition rate, while the X-ray absorption of the sample is recorded at twice the repetition rate of the laser, so that one can generate, on-line, the transient X-ray absorption spectrum [Ilaser -on( )t – Ilaser -off( )t ] at a given time delay t. For picosecond experiments, the time delay between the laser and the synchrotron pulses is controlled electron-ically. For femtosecond experiments with the slicing scheme, the same laser that slices the electron bunch is also used for sample excitation and the time delay between pump and probe is controlled by optical delay lines. In the following, we will present examples of characteristic studies on transition metal complexes in Figure 2. In X-ray absorption spectroscopy, an atom is excited from a core orbital by an X-ray
photon creating a photoelectron, which scatters off its nearest neighbours. The interference between the outgoing and backscattered photoelectron wave results in a modulation of the absorption cross-section. The three relevant energy regions are depicted on the right with the pre-edge describing transitions to valence orbitals below the ionisation threshold of the atom, the low-energy XANES region, where the photoelectron has a large de Broglie wavelength, allowing it to scatter off multiple nearest neighbours and the high-energy EXAFS region, where the cross-section modulations result from single-scattering events.
SPECTROSCOPYEUROPE 19
ARTICLE
ARTICLE
www.spectroscopyeurope.com
both the picosecond and the femtosec-ond timescales.
Applications
The photophysics of transition metal complexes is generating intense research activity due to the promise of applications such molecular complexes hold in areas such as solar energy, OLEDs (organic light emitting diodes) and PHOLEDs (phosphorescent organic light emitting diodes), biomedical imaging, magnetic data storage, photocatalysis, biology etc. As a first example, we will present our study on polypyridine complexes of ruthenium and, in particular, ruthenium tris-bipyridine ([Ru(bpy)3]2+),5 which has
become a model system for the family of Ru complexes used in the so-called Graetzel cells, also called dye-sensi-tised-solar-cells (DSSCs). Excitation of the complex in the visible reaches the so-called metal-to-ligand-charge-transfer (MLCT) states, leading to an electron being transferred to the bipyridine (bpy) ligand. An ultrafast spin conversion popu-lates the 3MLCT state,6 which then decays
with a lifetime of several hundreds of nanoseconds. This long-lived charge separation is one of the reasons for the
success of Ru dyes in DSSCs. Our aim was to retrieve the detailed electronic and molecular structure in the excited state. In the predominantly octahe-dral field of the complex, the d-orbitals split into lower t2g orbitals and upper eg orbitals. Figure 4 shows the ruthe-nium L3,2 (2p3/2,1/2–4d) XAS of the
ground state complex (a), along with the transient spectrum at 50 ps time delay (b) and spectrum of the excited complex (c), which is extracted using the transient and the ground state spectra. In the ground state, all six 4d electrons are in the lower t2g orbital, while the eg
orbital is empty and, therefore, only the B
band [2p4d(eg)] appears. In the MLCT state, an electron is transferred to the bpy ligand, thus opening up a new transition [2p
4d(t2g), feature A¢
]. Also, the blue-shift of the B feature reflects the change of oxidation state. The XANES region was analysed by ligand field multiplet theory,7in very good agreement with the data [Figure 4(d)]. Transient changes are also seen at higher energy around feature
D [Figure 4(b)]. This is due to a shift to higher energy of the EXAFS modulations resulting in feature D¢, which indicates a shortening of the Ru–N bonds by
20–40 mÅ in the excited state, empha-sizing the precision of the method. The Ru L2 (2p1/2–4d) XAS delivers additional
information about the spin state of the system.5 This example shows the power
of time-resolved X-ray absorption spec-troscopy at retrieving the photo induced electronic and geometric structure changes of molecular systems. However, in [Ru(bpy)3]2+, the lifetime of the 3MLCT
state is infinitely longer compared to the time resolution of our experiment. More relevant to chemistry and biology is the ability to capture “on the fly” (cf. Figure 1) the intermediates of a reaction.
Iron tris-bipyridine ([Fe(bpy)3]2+) is the
smallest representative of the extended family of Fe(II)-polypyridine complexes, which are known to undergo spin cross-over, where the spin of the molecule changes from S=0 to S=2, under the effect of light, temperature or pressure. This class of molecules has been much studied over the past 20 years due to their potential use in optical writing/ magnetic reading of stored data. In [Fe(bpy)3]2+, the spin cross-over can
only be induced by light, for example, by excitation into the MLCT states. Once in the lowest excited quintet state (high spin, HS), the system decays back to the ground state (low spin, LS) in approxi-mately 650 ps, which is the reason why its structure had not previously been determined. In addition, for this family of complexes, neither the pathway lead-ing from the initially excited MLCT state to the lowest quintet state, nor its time-scale, were known when we started our study. Picosecond and femtosecond X-ray absorption allowed us to answer these questions.
Figure 5(a) shows the Fe K-edge absorption spectrum of ground state (LS) [Fe(bpy)3]2+, along with the spectrum for
the HS state, which we retrieve from the LS spectrum and the transient at 50 ps, shown in Figure 5(b). In order to ensure that the changes in the latter are, indeed, due to the HS state, we recorded the time evolution of the features therein and found them to decay on the same time scale as that of the HS state.8
The inset in Figure 5(a) zooms into the XANES region, where the intensity of the edge feature (labelled B) increases
laser
X-rays
Experimental Chamber
I
ZEROdetector
Fluorescence
detector
Transmission
detector
liquid jet
Figure 3. The experimental chamber for time-resolved X-ray absorption spectroscopy at the Swiss Light Source (Paul-Scherer-Institut, Villigen) in an optical pump (laser beam)/X-ray probe geometry. The sample is a recirculating liquid jet. The X-ray absorption through the sample is recorded at twice the repetition rate of the laser by detectors, either in transmission and/or in total fluorescence yield, and the difference spectrum is recorded on-line.
analysis of the XANES and EXAFS regions allowed us to retrieve an Fe–N bond distance elongation of 0.2 Å in going from the LS to the HS state.9 This bond
elon-gation is due to the fact that two elec-trons are moved from the bonding d(t2g) orbitals to the antibonding d(eg) orbit-als, as result of photoexcitation. Since the X-ray absorption spectrum shows a fingerprint of the quintet state [the ampli-tude of the B feature, Figure 5(a)], one can use it to determine the time it takes to populate it. Indeed, this state is spec-troscopically silent in the visible so it is difficult to probe its population time. To this purpose, one needs sub-picosecond time resolution in the hard X-ray regime (near the Fe K-edge), which is provided by the slicing scheme at the Swiss Light Source.4 By sitting on the maximum
feature shown in Figure 5(b) and scan-ning the time between laser pump pulse and X-ray probe pulse, we could deter-mine the population time of the quintet to be ~150 fs.10 As shown in Figure 5(b),
the transient at 300 fs delay looks the same as at 50 ps. The speed of this time scale also provided us with the relaxa-tion pathway from the MLCT state to the HS state, which turns out to be a direct process that avoids all the intermediate electronic states lying between them. Thus, due to the combination of ultra-fast optical and X-ray absorption spectro-scopy, we could retrieve the complete photocycle of [Fe(bpy)3]2+.11 This
photo-cycle turns out to be representative of
Figure 4. (a) L2,3 edge X-ray absorption spectrum of aqueous [Ru(bpy)3]2+ in its ground state
(thick black line) together with fits of its most prominent features (labelled), except for the two residual bands (green areas) near the ionisation potential. The edge step functions (blue line) represent the ionisation thresholds. See Reference 5 for details of the fit. (b) Transient absorption spectrum (open red circles with error bars) and fit of this transient (blue line) using the ground state spectrum and the (energy-shifted) decomposed bands shown in (a). (c) Reconstructed X-ray absorption spectrum of the 3MLCT state (blue data points) together with a fit to the most
prominent features. (d) The A(A’) and B(B’) features extracted from the spectrum after subtrac-tion of the edge step and the higher-lying weak bound–bound absorpsubtrac-tions shown in (a), compared to multiplet calculations. The vertical lines (thick for the ground state and thin for the excited state) are the transitions which are broadened with the Gaussian and Lorentzian widths due to the experimental resolution and the core hole lifetime width, to generate the solid (red) curves. (Figure reproduced from Reference 3.)
Figure 5. (a) XANES spectrum of the ground state (LS) state of [Fe(bpy)3]2+ (black) and the HS state (red circles). The latter is extracted from the
difference spectrum (B) and the LS spectrum. (b) XANES region of the transient spectrum at 50 ps time delay (red circles) and at 300 fs (blue squares) obtained with the slicing scheme.
SPECTROSCOPYEUROPE 21
ARTICLE
ARTICLE
www.spectroscopyeurope.com
Chem. Phys. 393, 51–57 (2012). doi:
10.1016/j.chemphys.2011.11.022
7. F. De Groot and A. Kotani, Core Level Spectroscopy of Solids. Taylor & Francis, New York, USA (2008).
8. W. Gawelda, V.T. Pham, M. Benfatto, Y. Zaushytsin, M. Kaiser, D. Grolimund, S. Johnson, R. Abela, C. Bressler and M. Chergui, “Ultrafast dynamics of coherences in a quantum hall system”, Phys. Rev. Lett.
98, 057401–057401 (2007). doi: 10.1103/ PhysRevLett.97.057401
9. W. Gawelda, V.T. Pham, R.M. van der Veen, D. Grolimund, R. Abela, M. Chergui and C. Bressler, “Structural analysis of ultra-fast extended X-ray absorption fine struc-ture with sub picometer spatial resolution: Application to spin crossover complexes”, J. Chem. Phys. 130, 124520 (2009). doi:
10.1063/1.3081884
10. C. Bressler, C. Milne, V.T. Pham, A. El Nahhas, R.M. van der Veen, W. Gawelda, S. Johnson, P. Beaud, D. Grolimund, M. Kaiser, C.N. Borca, G. Ingold, R. Abela and M. Chergui, “Femtosecond XANES study of the light-induced spin crossover dynamics in an iron(II) complex”, Science 323, 489–492 (2009). doi: 10.1126/science.1165733
11. A. Cannizzo, C.J. Milne, C. Consani, W. Gawelda, C. Bressler, F. van Mourik and M. Chergui, “Light-induced spin crossover in Fe(II)-based complexes: The full photocycle unraveled by ultrafast optical and X-ray spec-troscopies”, Coordin. Chem. Rev. 254, 2677– 2686 (2010). doi: 10.1016/j.ccr.2009.12.007
12. V.T. Pham, T.J. Penfold, R.M. van der Veen, F. Lima, A. El Nahhas, S.L. Johnson, P. Beaud, R. Abela, C. Bressler, I. Tavernelli, C.J. Milne and M. Chergui, “Probing the transition from hydrophilic to hydrophobic solvation with atomic scale resolution”, J. Am. Chem. Soc.
133, 12740–12748 (2011). doi: 10.1021/ ja203882y
13. N. Huse, T.K. Kim, L. Jamula, J.K. McCusker, F.M.F. de Groot and R.W. Schoenlein, “Photo-induced spin-state conversion in solvated transition metal complexes probed via time-resolved soft X-ray spectroscopy”, J. Am. Chem. Soc. 132, 6809–6816 (2010). 14. F.A. Lima, C.J. Milne, D.C.V. Amarasinghe,
M.H. Rittmann-Frank, R.M. van der Veen, M. Reinhard, V.T. Pham, S. Karlsson, S.L. Johnson, D. Grolimund, C. Borca, T. Huthwelker, M. Janousch, F. van Mourik, R. Abela and M. Chergui, “A high-repetition rate scheme for synchrotron-based picosecond laser pump/ X-ray probe experiments on chemical and biological systems in solution”, Rev. Sci. Instrum. 82, 063111–063111 (2011). d oi:
10.1063/1.3600616 the entire family of Fe(II) spin-cross over
complexes.
The methodology for picosecond XAS is now well established and we, and other groups, have obtained results about the photoinduced electronic and structural changes in Ru, Pt, Re, Cu, Ni, Zn and Co molecular complexes, as well as on highly-correlated solid mate-rials and on metal oxide nanoparticles. Ps and fs X-ray absorption spectroscopy is also starting to be used to investigate solvation dynamics and structure upon photo excitation of solutes.12 In parallel,
its spectral domain has been extended to the soft X-ray regime,13 allowing the
K-edges of light elements (for example, N, O, P etc.) as well as the L-edges of transition metals to be reached, both of which are highly relevant to biology and coordination chemistry. Another recent development has been the implementa-tion of a high repetiimplementa-tion rate pump laser that runs at a fraction (typically half) of the repetition rate of the synchro-tron (typically MHz’s). This has allowed a significant increase in signal-to-noise ratio so that low concentration samples, for example, biological systems, can be investigated.14 Indeed, we recently
stud-ied the photoinduced ligand detach-ment and rebinding from haem proteins (myoglobin) under physiological condi-tions. The other outcome of the high repetition rate scheme is that it allows the implementation of photon-poor methods on a routine basis in time-domain experiments and recent work has demonstrated ps X-ray emission (XES), resonant inelastic X-ray scattering (RIXS) and X-ray diffraction (XRD) using such a scheme.
Closing remarks
In conclusion, there is a real surge in time-resolved X-ray absorption studies in
chemistry, biology and materials science. Picosecond time resolution is routinely achieved and the toolbox of available methods has been extended to other core-level spectroscopies and scattering techniques. Femtosecond time resolution has been demonstrated at synchrotrons, but at the cost of a significantly reduced photon flux. However, the advent of hard X-ray-free electron lasers, such as the ones already operating in the USA (Linear Coherent Light Source (LCLS)-Stanford) and in Japan [Spring-8 Ångström Compact Free Electron laser (SACLA)], or under construction in Hamburg (Germany) and in Villigen (Switzerland), provide a ten-order-of-magnitude increase in flux with a pulse duration <50 fs, allowing such stud-ies to become routine.
References:
1. A.H. Zewail, “Femtochemistry: Atomic-Scale Dynamics of the Chemical Bond Using Ultrafast Lasers (Nobel Lecture) Angew. Chem. Int. Ed. 39, 2587–2631 (2000). doi: 10.1002/1521-3773(20000804)39:15<2586:: AID-ANIE2586>3.0.CO;2-O
2. M. Chergui and A.H. Zewail, “Electron and X-ray methods of ultrafast struc-tural dynamics: advances and applications Chemphyschem, 10, 28-43 (2009). doi:
10.1002/cphc.200800667
3. M. Chergui, “Picosecond and femtosecond X-ray absorption spectroscopy of molecular systems”, Acta Crystallogr. A 66, 229–239 (2010). doi: 10.1107/S010876730904968X
4. P. Beaud, S.L. Johnson, A. Streun, R. Abela, D. Abramsohn, D. Grolimund, F. Krasniqi, T. Schmidt, V. Schlott and G. Ingold, “Spatiotemporal stability of a femtosecond hard-X-ray undulator source studied by control of coherent optical phonons”, Phys. Rev. Lett. 99, 174801 (2007). doi: 10.1103/ PhysRevLett.99.174801
5. W. Gawelda, M. Johnson, F.M.F. de Groot, R. Abela, C. Bressler and M. Chergui, “Electronic and molecular structure of photoexcited [RuII(bpy)
3]2+ probed by picosecond X-ray
absorption spectroscopy”, J. Am. Chem. Soc.
128, 5001–5009 (2006). doi: 10.1021/ ja054932k
6. O. Bram, F. Messina, A.M. El-Zohry, A. Cannizzo and M. Chergui, “Polychromatic fe m to s e c o n d f l u o re s c e n c e s t u d i e s of metal–polypyridine complexes in solution”,
![Figure 5. (a) XANES spectrum of the ground state (LS) state of [Fe(bpy) 3 ] 2+ (black) and the HS state (red circles)](https://thumb-us.123doks.com/thumbv2/123dok_us/9497184.2432208/4.892.84.571.171.628/figure-xanes-spectrum-ground-state-state-black-circles.webp)
