The investigation team wishes to recognize those individuals who supported this study in the Denver Metro area of Colorado at the OSHA Region VIII office and the HBA of Metropolitan Denver who made this research possible and the Centers for Disease Control and Prevention, the National Institute for Occupational Safety and Health (NIOSH) for their support and funding via the awards 1 R03 OH04199-0: Occupational Low Back Pain in Residential Carpentry: Ergonomic Elements of Posture and Strain within the HomeSafe Pilot Program sponsored by OSHA and the HBA.
Correspondence and requests for offprints should be sent to David P. Gilkey, Department of Environmental and Radiological Health Sciences, Colorado State University, Ft. Collins, CO 80523-1681, USA. E-mail: <[email protected]>.
Low Back Pain Among Residential
Carpenters: Ergonomic Evaluation Using
OWAS and 2D Compression Estimation
David P. Gilkey
Thomas J. Keefe
Department of Environmental and Radiological Health Sciences, Colorado State University, Ft. Collins, USA
Philip L. Bigelow
Institute for Work and Health, Toronto, Ont., Canada
Robin E. Herron
Kirby Duvall
Department of Environmental and Radiological Health Sciences, Colorado State University, Ft. Collins, USA
Jacob E. Hautaluoma
Department of Psychology, Colorado State University, Ft. Collins, USA
John S. Rosecrance
Department of Environmental and Radiological Health Sciences, Colorado State University, Ft. Collins, USA
Richard Sesek
Department of Mechanical Engineering, Ergonomics and Safety Program, University of Utah, Salt Lake City, USA
Occupational low back pain (LBP) remains a leading safety and health challenge. This cross-sectional investigation measured the prevalence of LBP in residential carpenters and investigated ergonomic risk factors. Ninety-four carpenters were investigated for LBP presence and associated risk factors. Ten representative job-tasks were evaluated using the Ovako Working Posture Analysis System (OWAS) and ErgoMaster™ 2D software to measure elements of posture, stress, and risk. Job-tasks were found to differ significantly for total lumbar compression and shear at peak loading (p < .001), ranging from 2 956 to 8 606 N and 802 to 1 974 N respectively. OWAS indicated that slight risk for injury was found in 10 job-tasks while distinct risk was found in 7 of the 10 job-tasks. Seven of the 10 job-tasks exceeded the National Institute for Occupational Safety and Health (NIOSH) action limit of 3 400 N for low back loading. The point prevalence for LBP was 14% while the annual prevalence was 38%.
1. INTRODUCTION/BACKGROUND
Occupational low back pain (LBP) is America’s number one workplace safety challenge [1]. LBP is a leading cause of lost work-time, second only to the common cold, and it accounts for up to 240 million lost workdays per year [2, 3, 4, 5]. Primary and secondary cost estimates to the nation’s economy due to LBP range from US $50 to 100 billion annually [6, 7, 8, 9].The construction industry is the sixth largest employer nationwide employing more than 7 million men and 687 000 women, representing 6% of the nation’s labor force [10, 11, 12, 13, 14, 15, 16]. This industry accounts for 15–17% of all reported workplace injuries, and 10% of all disabling injuries [15, 17]. Holmström, Lindell, and Moritz [18, 19] found an annual prevalence rate of LBP of 54% among the 1 773 construction workers studied. Guo et al. [7, 8] evaluated data from over 30 000 respondents and found that construction laborers and carpenters had the highest prevalence of back pain within the construction industry when comparing trades and industries. Among construction workers, back pain is endemic [5] in part due to workplace risk factors such as awkward postures, heavy lifting, pushing and pulling, and prolonged exertion [20, 21, 22, 23, 24, 25, 26, 27].
While the literature clearly establishes that LBP is a problem among construction workers of all types, a gap still exists between the current literature on prevalence of LBP among nonunion residential construction workers, appropriate and effective ergonomic assessment tools for residential builders, and characterization of risk factors for musculoskeletal disorders (MSDs) including those for LBP. This study hypothesized that ergonomic assessment of common carpentry job-tasks would identify and characterize known risk factors for LBP among construction framers. We also hypothesized that the prevalence rates seen in our study population of nonunion framing carpenters would be greater than those of the general population. The annual prevalence of annual acute LBP among the U.S. population has been estimated at 4–5% [9]. LBP among the general working population varies greatly and
has been estimated between 7.8% for private households up to 23.9% for lumber handling in building materials retailing [7, 8]. Investigators evaluated work-related risk factors for MSDs using a specifically designed survey instrument for residential framing carpenters, and the Ovako Working Posture Analysis System (OWAS) work assessment tool to characterize posture-related risk for MSDs as well as ErgoMaster™ 2D software to estimate low back compression and shear forces among the study population [23, 26, 28].
The OWAS work assessment tool was first reported by Karhu, Kansi, and Kuorinka [28] when evaluating ergonomic posture-related risk factors among Finnish steel mill workers. Since that time OWAS has been used in several industries including construction [23, 29, 30], commercial egg production [31], emergency medical response [32], nursing [33], and soft drink handling and distribution [34] as well as other types of work. However, OWAS has not been used in the evaluation of tasks in residential framing carpentry and this research will provide important information for future prevention studies for these workers.
Lumbar spine compression has been considered an important parameter of measurement when considering risk of injury to the lumbar spine [9, 26, 35, 36, 37, 38, 39, 40, 41]. Waters, Putz-Anderson, Garg, et al. [42] investigated the basis for selecting criteria to develop the Revised NIOSH Lifting Equation. These criteria included the research done on biomechanical modeling, e.g., the two-dimensional compression model for estimation of spinal loading. These researchers felt that the dynamic components of job-tasks such as lifting could be especially important in understanding the potential for injury. Investigators also concluded that compressive forces could be accurately estimated using computer-based modeling such as the two-dimensional software available in the Ergonomics Laboratory at Colorado State University. Schultz and Andersson [41]concluded that loads on the lumbar spine were related to back injury, potential aggravation to unstable spines, and increased chance of lost workdays. Straker, Stevenson,
Twomey, et al. [43] investigated compression and shear forces on the lumbar spine using the two-dimensional compression model to assess risk of injury. Compression and shear forces were evaluated in combination with other ergonomic variables to predict relative risk of LBP. Norman, Wells, Neumann, et al. [44] investigated peak versus cumulative exposure loads in LBP sufferers in a case-control study using the two-dimensional compression model. They found that workers in the top 25% loading category were at 6 times the risk for reporting LBP. Neumann, Wells, Norman, et al. [40] investigated four spinal peak measurement methods against measured lumbar spine compression, moment, and shear forces. These investigators compared different methods in ergonomic analysis such as video analysis, checklist, questionnaire, and work sampling. They concluded that video analysis was the gold standard. This type of work sampling facilitated accurate force determination and thus prediction of relative risk. ErgoMaster™ is a commercially available software program containing multiple computer-based tools to measure risk factors including the lift analysis two-dimensional compression model. This tool was used to estimate lumbar spine compression and shear forces related to job-tasks by analyzing body anthropometry, position and load. Research in lumbar compression led the National Institute for Occupational Safety and Health (NIOSH) to establish the action limit (AL) at 3 400 N (770 lbs) [42]. Although loads have been evaluated among previous construction worker populations and job-tasks, specific characterization of loads associated with framing job-tasks have not. In addition EgoMaster™ is capable of providing more data than just total compression. Our study was able to evaluate internal and external contributions to the total estimation. There exists a running debate regarding the role of peak versus cumulative loading and its impact on the risk of injury; this can only be solved with a deeper understanding of true peak loads and outcomes. No data are presently available on similar populations directly comparable to the specific job-tasks evaluated in this workplace assessment.
2. STUDY DESIGN AND METHODS
This investigation was a nested cross-sectional study of 94 nonunion residential framing carpenters within a larger longitudinal cohort study evaluating the effectiveness of the HomeSafe Pilot Program, a safety and health program designed by OSHA Region VIII and the Home Builders Association of Metropolitan Denver to reduce injuries and fatalities in residential construction [45]. Approximately 5 500 framing carpenters were identified within the larger residential construction population of approximately 50 000 working in the program area, which was restricted to five counties in the Denver metropolitan area. A randomly selected sample of 94 nonunion framing carpenters was identified through participating general contractors within the HomeSafe Pilot Program. The study was conducted in three phases with the first phase being a series of focus groups to pilot test survey questions and gather information on the tasks performed in the construction of a typical wood-framed home. Phase 2 was the administration of the survey to gather information on tasks and LBP prevalence from all 91 participants. The third phase was an in-depth evaluation of job tasks using OWAS and computer based tools.In Phase 1, 17 focus groups, conducted in both Spanish and English, were held in construction sites in the Denver Metro area. Subjects, who were all nonunion framing carpenters, were asked to identify and discuss the major procedures and tasks they performed in the construction of a typical wood-framed house. Additionally, questions about an individual’s experience of musculoskeletal pain and subjective rating of the degree of exertion required to perform specific tasks were pilot tested.
In Phase 2, data were collected using a 91-item report questionnaire focused on self-reporting of LBP and exposure to known risk factors for LBP based upon a review of the literature. On the questionnaire, LBP was defined as pain felt in the low back which resulted in lost time from work and/or altered some aspect of the normal activities of daily living and/or
caused the sufferer to seek medical care. Within the survey, subjects were asked to rate perceived strain to the low back while performing 44 major job-tasks identified in Phase 1. The following 5-point perceived exertion scale was used: 0—job-task not performed, 1—no strain, 2—low strain, 3—moderate strain, 4—high strain and 5—very high strain.
In Phase 3, from the list of 44 job-task strain scores, a subset of 10 job-tasks was identified for ergonomic analysis on the basis of their representativeness of routine carpentry tasks; it provided a range of perceived strain to the low back. Job-tasks were selected on the basis of their low back strain scores and probability of being sampled. While many job-tasks are performed routinely through the home building process/ cycle, others are only performed rarely and only at specific times throughout the entire home building process. Job-tasks were dichotomized to two groups by their mean strain scores estimated below 2 or greater than 2. Of the 10 job-tasks evaluated, five job-tasks were identified as easy and five as hard based upon subjective strain score ratings. Field investigators video recorded approximately 50 hrs of framing carpentry work to capture multiple examples and cycles of the 10 job-tasks of interest. OWAS and ErgoMaster™ 2D software were then used to estimate risk of injury, forces of compression, and shear forces to the lumbar spine. The computer-based evaluations were carried out in the Ergonomics Laboratory at Colorado State University, USA. The OWAS evaluation was carried out using methods consistent with prior research [29, 30, 46] and in accordance with the operations manual [47]. Methods involved isolating the job-tasks of interest from the overall video footage and collecting data on four key posture elements on a repeating basis. The software is designed for the observer to manually record body postures and external loads at 30-s intervals. The observer views the framing carpenter working and records the position of the back as (a) straight, (b) bent, (c) twisted, or (d) bent and twisted. The position of the arms were recorded as follows: (a) below the shoulders, (b) one arm above the shoulder, or (c) both arms above the shoulders.
The general body position was recorded as (a) sitting, (b) standing on two legs, (c) standing on one leg, (d) both knees bent, (e) one knee bent, (f) kneeling on one leg, or (g) walking. External loads were recorded into one of three categories: (a) under 10 kg, (b) between 10 and 20 kg, or (c) over 20 kg. Job-tasks were evaluated through 10 cycles and observations recorded by the laboratory observer. OWAS characterizes risk for musculoskeletal injury into four Action Categories (AC): AC 1—no risk defined as work postures considered normal with no particular harmful effect on the musculoskeletal system, no intervention action is warranted; AC 2—slight risk defined as work postures have some harmful effect on the musculoskeletal system, light stress is present, no immediate intervention is warranted but improvements should be considered in future plans; AC 3—distinct risk, defined as work postures have some distinct harmful effect on the musculoskeletal system and work methods should be changed as soon a possible; AC 4— extreme risk, defined as work postures with an extremely harmful effect on the musculoskeletal system require immediate corrective actions for postural improvement [30]. OWAS has been used and validated in previous studies [28, 29, 30, 48, 49]. The ErgoMaster™ software was used to evaluate the biomechanical components of spinal compression and shear. Laboratory methods and procedures were followed consistent with the operations manual from the manufacturer [50]. To use this ergonomic assessment tool, the laboratory observer identified and determined peak loading segments within the job-task and capture still images. Specialty software was used to extract single frame images at 15 per second. The still images that best-represented peak load resulting from forward bent postures and external loads were then downloaded into ErgoMaster™ for biomechanical analysis. Each working file or image required the height and weight of the subject observed, horizontal distance to the load, and weight of the load. A known scale device was worn by the subject to allow accurate measurement of body dimensions. Still images were then marked using the computer cursor by the analyst to identify key anatomical locations
to establish moment arms and vectors for biomechanical estimations. The analyst identified points at the ankle, knee, hip, shoulder, ear, elbow, and hand. Using the information provided, the software produced estimates of compression and shear forces. The protocol was approved by Colorado State University’s Human Research Committee (Campus Institutional Review Board). Data were entered into SPSS® version 13.0 and 14.0 for storage, management, and descriptive analysis. SAS® version 8 was principally used for statistical analysis. Descriptive statistics, frequencies, univariate analysis, and correlations were derived for the analysis using appropriate methods [51, 52, 53, 54]. Survey data were found to be normally distributed using the one-sample Kolomorov–Smirnov test [53]. Logistic regression (LR) was used to evaluate the relationship of job-task low back strain scores as independent variables and health endpoints of interests such as presence or absence of LBP. Predicative values were generated as estimated odds ratios (OR) with 95% confidence intervals (CI). Forward variable selection was used to develop a final model and adjusted for age.
3. RESULTS
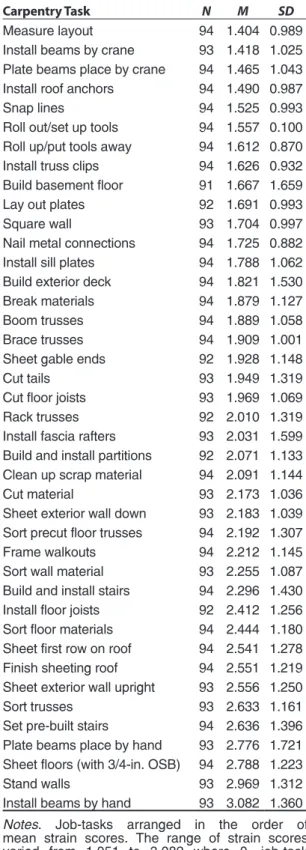
A total of 44 major carpentry tasks were identified during the focus group sessions. Survey results in terms of perceived strain for each of the 44 tasks are shown in Table 1. Mean strain scores for all 94 respondents ranged from 1.051 when creating a cut list to 3.082 when installing a beam by hand. No mean strain scores were above 4, indicating no tasks had mean ratings within the high or very high strain categories. However, the standard deviation of the highest mean score (3.082 for installing beams by hand) was 1.36 indicating that many carpenters had rated the strain level for this task in the high/very high categories.
TABLE 1. Mean Strain Scores for 44 Major Carpentry Tasks
Carpentry Task N M SD
Create cut list 93 1.051 0.854 Set up cut station 93 1.357 0.997 Cut roof vents 94 1.374 1.036
TABLE 1. (continued)
Carpentry Task N M SD
Measure layout 94 1.404 0.989 Install beams by crane 93 1.418 1.025 Plate beams place by crane 94 1.465 1.043 Install roof anchors 94 1.490 0.987 Snap lines 94 1.525 0.993 Roll out/set up tools 94 1.557 0.100 Roll up/put tools away 94 1.612 0.870 Install truss clips 94 1.626 0.932 Build basement floor 91 1.667 1.659 Lay out plates 92 1.691 0.993 Square wall 93 1.704 0.997 Nail metal connections 94 1.725 0.882 Install sill plates 94 1.788 1.062 Build exterior deck 94 1.821 1.530 Break materials 94 1.879 1.127 Boom trusses 94 1.889 1.058 Brace trusses 94 1.909 1.001 Sheet gable ends 92 1.928 1.148 Cut tails 93 1.949 1.319 Cut floor joists 93 1.969 1.069 Rack trusses 92 2.010 1.319 Install fascia rafters 93 2.031 1.599 Build and install partitions 92 2.071 1.133 Clean up scrap material 94 2.091 1.144 Cut material 93 2.173 1.036 Sheet exterior wall down 93 2.183 1.039 Sort precut floor trusses 94 2.192 1.307 Frame walkouts 94 2.212 1.145 Sort wall material 93 2.255 1.087 Build and install stairs 94 2.296 1.430 Install floor joists 92 2.412 1.256 Sort floor materials 94 2.444 1.180 Sheet first row on roof 94 2.541 1.278 Finish sheeting roof 94 2.551 1.219 Sheet exterior wall upright 93 2.556 1.250 Sort trusses 93 2.633 1.161 Set pre-built stairs 94 2.636 1.396 Plate beams place by hand 93 2.776 1.721 Sheet floors (with 3/4-in. OSB) 94 2.788 1.223 Stand walls 93 2.969 1.312 Install beams by hand 93 3.082 1.360
Notes. Job-tasks arranged in the order of mean strain scores. The range of strain scores varied from 1.051 to 3.082 where 0—job-task not performed, 1—no strain, 2—low strain, 3—moderate strain, 4—high strain, 5—very high strain). N < 94 means that data were not reported by one or more subjects. Oriented Strand Board (OSB) is a type of building material used in place of plywood. The material comes in many thicknesses ranging from 1.1 to 1.9 cm (7/16–3/4 in.). Flooring requires 1.9-cm (3/4-in.) thick OSB which is bulky to handle and weighs 18 kg.
Based on the survey results using responses to the question on current or LBP in the last 2 weeks, the point prevalence was 14% (95% CI: 7.0–21.0). Thirty-eight percent of respondents (95% CI: 28.2–47.8) reported that they had suffered an episode of LBP within the past 12 months sufficient to seek treatment or alter some aspect of normal living. Fifty-four percent of respondents (95% CI: 43.9–64.1) reported that they had suffered an episode of LBP or injury in their lifetime that had caused them to seek medical care or altered some aspect of normal living. The 10 job-tasks selected for a more detailed ergonomic evaluation are listed in Table 2. These job-task strain scores ranged from 1.051 for the easiest to 2.96 for the most strenuous. The five easy tasks all had subjective mean strain scores lower than 2.0 compared to the 5 hard tasks whose mean strain scores were all greater than 2.0.
TABLE 2. Easy Tasks Versus Hard Job-Tasks With Mean Strain Scores
Easy Tasks Mean Strain Score Create a cut list 1.051 Set up cut station 1.357 Measure layout 1.404
Roll out 1.557
Lay out plates 1.691
Hard Tasks
Sort wall material 2.255 Install floor joists 2.412
Sort trusses 2.633
Sheet floors 2.788
Stand walls 2.969
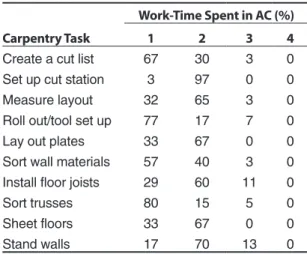
In Phase 3 of the investigation, OWAS ACs were derived based upon worker anthropometry, work postures, and loads managed for each job-task. OWAS values represent the percentage of time in any given AC throughout the entire job-task cycle. Total OWAS job-task evaluation values add up to 100%. Table 3 provides a summary of OWAS risk ratings for all 10 of the selected tasks. It should be noted that all job-tasks evaluated demonstrated some risk. Slight risk (OWAS AC 2) varied from a low of 17% of work-time for the job-task roll-out/tool setup to a high of 97% of work-time for setting up a
cut station. Distinctly harmful postures (OWAS AC 3) were associated with 7 of the 10 job-tasks with the greatest exposure seen for installing floor joists and raising walls 11% and 13% of work-time posing distinct postural risk respectively. No job-tasks were classified as extremely harmful (AC 4).
TABLE 3. Comparing Ovako Working Posture Analysis System (OWAS) Action Categories (ACs) Among Tasks
Carpentry Task
Work-Time Spent in AC (%)
1 2 3 4
Create a cut list 67 30 3 0 Set up cut station 3 97 0 0 Measure layout 32 65 3 0 Roll out/tool set up 77 17 7 0 Lay out plates 33 67 0 0 Sort wall materials 57 40 3 0 Install floor joists 29 60 11 0
Sort trusses 80 15 5 0
Sheet floors 33 67 0 0
Stand walls 17 70 13 0
Notes. Values represent percentage of time spent in each AC with the value of 100% being the complete job-task cycle. AC 1—normal postures, no action required; AC 2—the posture is slightly harmful, actions to change postures should be taken in the near future; AC 3—the posture is distinctly harmful, actions to change postures should be taken as soon as possible; AC 4—the posture is extremely harmful, actions to correct postures should be taken immediately.
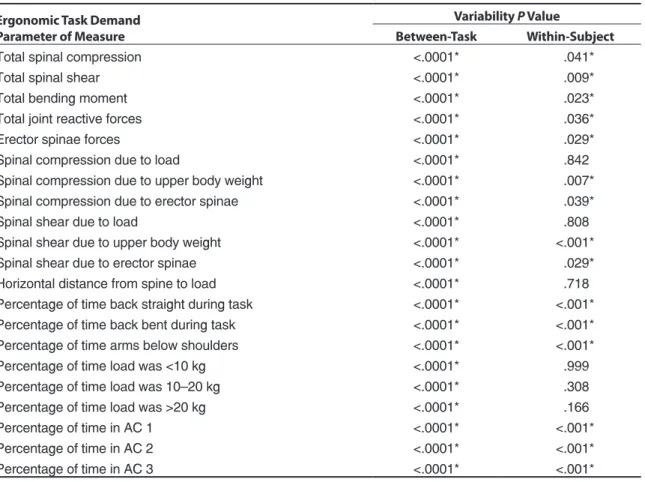
The 10 job-tasks of interest were evaluated and compared for between and within variability for total spinal compression, total spinal shear, bending moment, joint reaction forces, erector spinae forces and compression due to load, upper body weight, and erector spinae muscles (Table 4). Great variability was seen in the parameters measured between all the 10 job-tasks evaluated. It should also be noted that much variability was also present within those subjects performing the same job-tasks. Differences were also observed in the contributions to compression and shear from endogenous and external factors such as weight and height of subject as well as weight of load and distance from the body. Significant differences (p < .001) were seen between all job-task parameters evaluated. Within-subject variability was significant (p < .05) for 15 of the 21 parameters listed in Table 4.
When comparing easy versus hard job-tasks, fewer differences were seen in biomechanical and postural parameters. Less variability was noted in the subset of 10 job-tasks on the same parameter measured than between the combined 44 job-tasks. Significant differences (p < .05) were seen in only 8 of the 21 ergonomic parameters estimated (Table 5). Major differences between easy and hard were seen in spinal compression due to load and compression and shear due to upper body weight. Total lumbar compression was greater on average by over 700 N for those job-tasks classified as hard whereas the total spinal shear values were very similar (1 045 N hard and 1 019 N easy). There were no significant differences seen in horizontal distances to load, bending moments, total reactive forces and erector spinae forces. However, we found that spinal compression due load and was markedly greater in hard versus easy job-tasks by a factor of nearly 18 (218 N hard versus 12 N easy). Moreover, it is interesting that significant differences were
also noted in compression and shear due to body weight (p < .05). The spinal shear due to external loading (54 N easy versus 209 N hard) was nearly significant (p < .059). Additional differences were not significant between the parameter due to erector spinae muscles. Differences in the OWAS variables are presented as percentage of time engaging the various load ranges, positions of arms and back, and ACs 1, 2, and 3. There was a number of differences between the easy versus hard job-tasks including work-time spent with a bent and twisted spine, arm position, and weight of loads managed. The easy jobs handled lighter loads of less than 10 kg 87% of work-time whereas the hard job-tasks required heavier loads of over 20 kg 36% of work-time. Medium weight loads were equal between the job groups. There were no significant differences between the overall work-time spent within the three ACs. Approximately half of the work-time was spent in ACs 1 and 2 with only small percentages of the total spent in AC 3 where distinct risk was rated.
TABLE 4. Comparing Differences in Ergonomic Measures Due To Task Demands
Ergonomic Task Demand Parameter of Measure
Variability P Value
Between-Task Within-Subject
Total spinal compression <.0001* .041*
Total spinal shear <.0001* .009*
Total bending moment <.0001* .023*
Total joint reactive forces <.0001* .036*
Erector spinae forces <.0001* .029*
Spinal compression due to load <.0001* .842*
Spinal compression due to upper body weight <.0001* .007* Spinal compression due to erector spinae <.0001* .039*
Spinal shear due to load <.0001* .808*
Spinal shear due to upper body weight <.0001* <.001* Spinal shear due to erector spinae <.0001* .029* Horizontal distance from spine to load <.0001* .718*
Percentage of time back straight during task <.0001* <.001* Percentage of time back bent during task <.0001* <.001* Percentage of time arms below shoulders <.0001* <.001* Percentage of time load was <10 kg <.0001* .999*
Percentage of time load was 10–20 kg <.0001* .308*
Percentage of time load was >20 kg <.0001* .166*
Percentage of time in AC 1 <.0001* <.001* Percentage of time in AC 2 <.0001* <.001* Percentage of time in AC 3 <.0001* <.001*
TABLE 5. Comparing Ergonomic Parameters Between Easy and Hard Tasks
Ergonomic Task Demand Parameter of Measure
Easy Tasks Hard Tasks Difference
M (N) M (N) P Value
Total spinal compression 3 681 4 436 .226
Total spinal shear 1 045 1 019 .879
Total bending moment 179 194 .653
Total joint reactive forces 4 582 5 311 .376
Erector spinae forces 3 595 3 897 .649
Horizontal distance from spine to load 45 42 .620 Spinal compression due to load 12 218 <0.001* Spinal compression due to body weight 132 358 .002* Spinal compression due to erector spinae 3 437 3 736 .666
Spinal shear due to load 54 209 .059
Spinal shear due to upper body weight 459 308 .009*
Spinal shear due to erector spinae 499 541 .648
OWAS Parameter of Measure M M P Value
Percentage of time back straight during task 55 56 .878 Percentage of time back bent during task 43 36 .214 Percentage of time arms below shoulders 0.3 7 .032*
Percentage of time load was <0 kg 89 82 .008*
Percentage of time load was 10–20 kg 0.5 7 .007*
Percentage of time load was >20 kg 87 57 <.001*
Percentage of time in AC 1 6 6 1.000
Percentage of time in AC 2 6 36 <.001*
Percentage of time in AC 3 47 48 .884
Percentage of time back straight during task 46 48 .648 Percentage of time back bent during task 6 3 .161
Notes. *significant at p < .05. OWAS— Ovako Working Posture Analysis System, AC—action category.
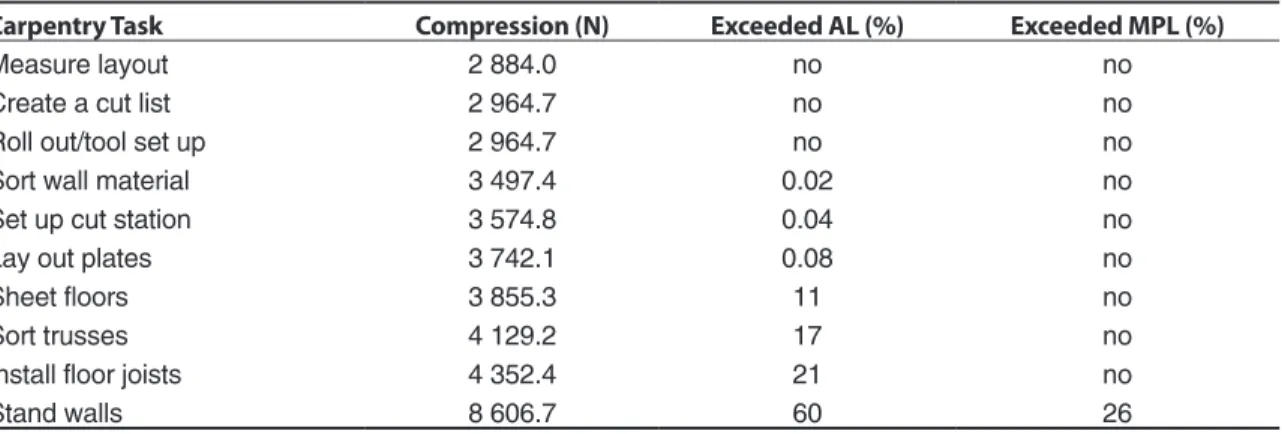
TABLE 6. Percentage of Spinal Compression Exceeding National Institute for Occupational Safety and Health (NIOSH) Action Limit (AL) and Maximum Permissible Lift (MPL) by Task
Carpentry Task Compression (N) Exceeded AL (%) Exceeded MPL (%)
Measure layout 2 884.0 no no
Create a cut list 2 964.7 no no
Roll out/tool set up 2 964.7 no no
Sort wall material 3 497.4 0.02 no
Set up cut station 3 574.8 0.04 no
Lay out plates 3 742.1 0.08 no
Sheet floors 3 855.3 11 no
Sort trusses 4 129.2 17 no
Install floor joists 4 352.4 21 no
Stand walls 8 606.7 60 26
Notes. NIOSH AL = 3 425 N, MPL = 6 361 N.
Table 6 presents peak compression values for all 10 job-tasks. The values are compared to the NIOSH AL (3 400 N) and maximum permissible lift (MPL) (6 600 N) reference values. Measured values that exceed AL and MPL are reported as a percentage above the reference value. It was found that estimated forces exceeded the AL threshold
in 7 of 10 job-tasks. Two of the easy job-tasks, sorting wall material and setting up a cut station, created forces slightly above the AL. All five of the hard job-tasks generated compression forces above the AL but only one job-task, standing walls, exceeded the NIOSH MPL (>26%) with a mean peak load estimated at over 8 600 N.
4. RELATIONSHIP BETWEEN
REPORTED LBP AND REPORTED
TASKS
After looking at the Pearson’s correlation coefficients for the endpoints of interest—recent, the past year, and any occurrence (i.e., lifetime prevalence) of LBP in the 10 job-tasks evaluated— several significant relationships were identified. They are presented in Table 7. Recent reported LBP (past 2 weeks) was positively correlated with four of the five easy job-tasks: creating a cut list, measuring layout, rolling out/tool set up, and laying out of plates. Conversely, only one hard job-task, sorting trusses, was positively correlated (Table 7).
TABLE 7. Pearson Correlation Coefficients for Low Back Pain and 10 Job-Tasks Evaluated
Carpentry Task
Pearson Correlation Coefficients
Point Prevalence Annual Prevalence Lifetime Prevalence
Create a cut list 0.249* 0.014 0.015
Set up cut station 0.167 0.187 0.085
Measure layout 0.222* 0.198 0.227*
Roll out/tool set up 0.263* 0.201 0.024
Lay out plates 0.208* 0.217* 0.088
Sort wall materials 0.134 0.244 0.290*
Install floor joists 0.195 0.360* 0.327*
Sort trusses 0.222* 0.167 0.333*
Sheet floors 0.147 0.356* 0.300*
Stand walls 0.136 0.095 0.288*
Notes. *<.05 significance at the 95% confidence level.
TABLE 8. Odds Ratio (OR) for Point (Recent) Low Back Pain (LBP) Due to 10 Job-Tasks Evaluated
Carpentry Task
LBP Point Prevalence Estimate
OR L-CI U-CI
Create a cut list 2.206 0.754 6.456 Set up cut station 0.488 0.168 1.415 Measure layout 0.990 0.984 0.990 Roll out/tool set up 2.099* 1.024 4.303 Lay out plates 1.395 0.471 4.129 Sort wall materials 0.896 0.414 1.938 Install floor joists 1.452 0.595 3.544 Sort trusses 1.611 0.634 4.096 Sheet floors 0.855 0.342 2.137 Stand walls 0.664 0.286 1.538
Notes. *<.05 significance at the 95% confidence unadjusted; N = 88 of 94 cases in analysis; L-CI— lower confidence limits, U-CI—upper confidence limits. Forward Selection Evaluation with all 10-job-tasks entered into the model
Roll out/tool set up 1.970* 1.135 3.421
Notes. *<.05 significance at the 95% confidence level, adjusted for age.
Reported LBP in the past year was significantly (p < .05) correlated with only two job-tasks, laying out plates and sheeting floors; these were classified as easy and hard respectively. Lifetime prevalence (any report ever of LBP) was positively correlated with all of the hard job-tasks and only one easy job-task, measuring layout. Tables 8, 9, and 10 provide OR estimates for point, annual, and lifetime prevalence due to job-tasks using the low back strain scores as surrogates of exposure. Unadjusted values reveal limited increase of risk associated with the easy job-task, rolling out/ tool set up, with OR = 2.099 (CI = 1.024–4.303) (Table 8). Using forward selection technique and adjusting for age, the job-task of rolling out/tool set up remained in the model with a slightly decreased OR = 1.97 (CI = 1.135–3.421). Evaluating the annual prevalence using LR techniques revealed a protective effect (OR = 0.504, CI = 0.269–0.942) for standing walls. When entering all 10 job-tasks
into a forward selection process and adjusting for age, standing wall dropped out and installing floor joists remained in the model with an increased risk estimate (OR = 1.964, CI = 1.290–2.991) (Table 9). Evaluation of lifetime LBP initially revealed no significant relationships (p < .05) with the initial LR procedure (Table 10). When using forward selection, a single job-task, sorting roof trusses remained in the model; adjusting for age resulted in OR = 2.109 (CI = 1.334–3.332) suggesting increased risk for LBP due to job-tasks exposure.
TABLE 9. Odds Ratio (OR) for Annual Low Back Pain (LBP) Due to 10 Job-Tasks Evaluated
Carpentry Task
LBP Annual Prevalence Estimate
OR L-CI U-CI
Create a cut list 0.664 0.280 1.577 Set up cut station 1.137 0.516 2.505 Measure layout 0.881 0.432 1.798 Roll out/tool set up 1.514 0.832 2.756 Lay out plates 1.073 0.482 2.391 Sort wall materials 1.470 0.796 2.714 Install floor joists 1.855 0.934 3.806 Sort trusses 0.795 0.404 1.564 Sheet floors 1.829 0.901 3.716 Stand walls 0.504* 0.269 0.942
Notes. *<.05 significance at the 95% confidence unadjusted; N = 88 of 94 cases in analysis; L-CI— lower confidence limits, U-CI—upper confidence limits.
Forward Selection Evaluation with all 10-job-tasks entered into the model
Install floor joists 1.964* 1.290 2.991
Notes. *<.05 significance at the 95% confidence level, adjusted for age.
TABLE 10. Odds Ratio (OR) for Lifetime Low Back Pain (LBP) Due to 10 Job-Tasks Evaluated
Carpentry Task
LBP Lifetime Prevalence Estimate
OR L-CI U-CI
Create a cut list 1.914 0.672 5.450 Set up cut station 0.769 0.325 1.816 Measure layout 1.820 0.848 3.906 Roll out/tool set up 0.587 0.330 1.148 Lay out plates 0.467 0.203 1.076 Sort wall materials 1.343 0.733 2.458 Install floor joists 1.693 0.838 3.418 Sort trusses 1.364 0.709 2.621 Sheet floors 0.945 0.474 1.920 Stand walls 1.504 0.795 2.843
Notes. N = 89 of 94 cases in analysis; L-CI—lower confidence limits, U-CI—upper confidence limits. Forward Selection Evaluation with all 10-job-tasks entered into the model.
Sort trusses 2.109* 1.334 3.332
Notes. *<.05 significance at the 95% confidence level, adjusted for age.
5. DISCUSSION AND LIMITATIONS
There has been a paucity of studies that have focused on nonunion, residential construction carpentry and evaluated specific job-tasks. The scope of our study included the reported prevalence of LBP among our study population and perception of specific job-task strain to the low back as well as descriptive data on the postural and biomechanical factors that have been associated with LBP. We had deliberate interest in exploring the biomechanical stresses of the job to better understand why construction carpenters might have such high LBP rates and proportions, and make estimates of risk. Using the self-report, low back strain rating scale enabled us to obtain meaningful values about perceived stress by carpenters as they performed their everyday work. We believe that those values represent exposures that led to our evaluation of the relationship to the LBP endpoints of interest. Our evaluation of the data from this study revealed useful findings. First, we identified significant differences (p < .05) between the 10 job-task evaluated for nearly all parameters measured. This supports the contention shared by many researchers that construction work is highly variable and thus a challenge for identifying, measuring, and characterizing risks for MSDs including LBP.Our strategy for estimating risk was based principally on two approaches: (a) job-related ORs derived with statistical methods and (b) OWAS estimates based upon posture and load exposures. Using logistic regression, ORs were generated using LBP as the dependent variable and the low back strain scores from the 10 job-tasks having biomechanical and postural data as independent variables. This strategy seemed logical as the low back strain scores are surrogates for physical stress and are likely to represent multiple biomechanical, postural as well as environmental and personal stressors. We are aware that the subjective ratings offered by individuals may vary based upon many factors; however, we only adjusted for age in this study.
The recent occurrence of LBP (point prevalence) was associated with an increase in risk for only one job: rolling out/ tool set up.
While this was rated a no-to-low-strain job-task (mean strain score 1.6), it typically occurs early in the morning, is delegated to the less experienced workers, and may be hurried. Specific job-task requirements are highly variable between work crews. For example, a well-organized crew may have an onsite trailer where tool put-away and storage are very strict with specific protocols for both put-away and tool-setup. While on other job-sites, workers may arrive with their own tools in their truck or car. Unloading tools and equipment from individual vehicles necessitates different mechanical stressors than removing tools from a well-designed and organized onsite tool trailer. Physical effort made early in the morning before workers warm up may carry increased risk of LBP associated with lifting and twisting activities. In addition, those younger, less senior workers most frequently do more of the tool setup than the skilled and experienced carpenters. Inexperienced construction workers are unfamiliar with many safe-work techniques and are at higher risk for injury than experienced workers.
Evaluation of annual and lifetime LBP end-points to strain scores yielded increased risk for LBP associated with hard job-tasks: installing floor joists (OR = 1.964, CI = 1.290–2.991) and sorting trusses (OR = 2.109, CI = 1.334–3.332). Both of these job-tasks were subjectively rated low-to-moderatestrain on the low back. Annual and lifetime LBP are more likely to be affected by length of exposure on the job as well as other factors; therefore, we adjusted for age. It should be noted that some job-tasks may be rated with higher low back strain scores but they are performed far less frequent during the home building cycle. For example, placing beams by hand has a higher low back strain score but is performed far less often. Installing floor joists and sorting trusses are job-tasks that require much larger proportions of work-time and thus present longer exposure to stresses.
No job-tasks were classified into OWAS AC 4, requiring immediate intervention. One might express concern that OWAS underestimates the risk of MSD and LBP among residential framing carpenters given the estimated values
for spinal compression associated with hard job-tasks and the prevalence of reported LBP. Also consider that the lifetime LBP prevalence proportion for our study population was 54% with an average age of 37 years. The high prevalence is likely to be linked to job-task exposure including biomechanical and postural factors. Looking at those job-tasks rated in AC 3 (7 out of 10), most had exposure from 3 to 6% of the time. This also may represent a lower risk estimate given biomechanical stresses and prevalence proportions. The job-task of standing walls was assigned 13% of the exposure time in AC 3; this was by far the highest exposure of all 10 tasks with spinal compression estimated far above the OSHA/NIOSH MPL of 6 600 N. Marras [55] reported that spinal loads of 6 375 N were noted to cause vertebral endplate microfracture; should this be characterized as AC 4? A study by Kivi and Mattila [29] evaluated 12 jobs and 39 essential tasks in commercial construction but did not include carpenters in their sample. They did, however, identify timbermen and construction workers at less than 10% of the time in OWAS AC 3; the four trades exceeding 10% were cement, repair, concrete workers, and bricklayers. These trades may compare well to carpenters in that they also do not appear to rank high in AC 3, recognized as distinctly harmful. Carpenters perform many tasks bent forward but have much greater mobility and variability in posture throughout the course of their workday than do concrete and cement workers who must remain bent for greater proportions of time doing their work. Much of their work is performed at ground level and requires prolonged forward bending and heavy lifting. Work done in the kneeling position that requires excessive and prolonged forward reaching might generate higher AC ratings. Li [23] investigated construction workers in China and evaluated their postures using OWAS among construction trades on two sites performing ironwork-related tasks, form installation, cement pouring and finishing, and scaffold work but did not evaluate carpenters. He found that more than 30% of all work postures were characterized as harmful, with the majority of risk characterized by AC 2 and that scaffold work had the highest
exposure of 43.3%. Mattila, Karwowski, and Vikki [30] investigated construction workers performing hammering activities including framers and roofers over a 2-month period. They found 40.6% of work postures fell into OWAS AC 1, 51.4% into AC 2, 3.4% into AC 3, and 4.4% into AC 4. Their findings are consistent with this study and other investigators who have identified the majority of risk in AC 2, slightly harmful, and only a few postures warrant AC 3 or 4 characterizations. OWAS-based study findings in construction may suggest that OWAS underestimates the risk of LBP given the high prevalence reported by many investigators [18, 19, 23, 56, 57]. Construction job-tasks are highly variable in posture and loading and may not be captured well with OWAS as the primary risk assessment tool.
The ErgoMaster™ 2D software used in the study quantifies and separates contributing portions of spinal compression due to body weight, weight of load, and joint reactive forces. Worth noting are total compression and shear values that exceeded previous limits determined to be associated with increased risk. The present study findings yielded 2 884 to 8 606 N for spinal compression estimates, much higher than seen by other investigators evaluating construction-related job-tasks. Prior research led NIOSH to establish the AL at 3 400 N to protect workers from low back injury [42]. Mirka, Kelaher, Nay, et al. [39] did not find values necessarily similar to those seen in this study when looking at framing carpenters. Their team integrated compression values over the entire work shift and did not present peak loading per job-task as done in this study. They found the most common range of load to be 1 980–2 640 N; however, they estimated one job task at 6 600 N where four sheets of plywood were lifted from the ground. As a consequence, over 90% of job-tasks were classified with less than 2 640 N and fell into NIOSH lifting index of 0.0–1.1 indicating low risk exposure. They also used the lumbar motion monitor to evaluation acceleration and direction variables. Our findings focus on peak loading and do not account for the proportion of the total daily exposure. In this study 7 of
the 10 job-tasks evaluated breached the AL, whereas the standing-walls job-task exceeded the MPL by 26%. Standing walls can be a very stressful job-task depending on the size and weight of the wall. Peak loading may be more indicative of acute traumatic risk versus cumulative injury risk. Lumbar spine loads of 650 kg (6 375 N) were reported to have caused vertebral endplate microfracture [55]; we estimated forces as high as 10 000 N when raising walls in select lifts. Neumann et al. [40] looked at peak spinal loading among a group of automotive plant maintenance workers using four different assessment techniques. Their techniques estimated load in the range of 3 293 to 3 752 N. They found good agreement between techniques but preferred perpendicular video recordings due to precision of estimation and this technique was used in our study. Marras Lavender, Leurgans, et al. [58] looked at three-dimensional trunk motion and found that multiple factors increased risk for low back disorders. Most significant included maximum moment with OR = 5.17 (CI = 3.19–8.38), followed by the average moment (OR = 4.08, CI = 2.62–6.34), and maximum weight of load (OR = 3.17, CI = 2.19–4.58). Additional predictors included average weight handled, job satisfaction, vertical location of destination, and maximum horizontal distance from load to L5–S1. While many investigators have studied loading and motion factors independently, Marras, Lavender, Leurgans, et al. [59] emphasized that it was the combined effect of force and motion factors that produced greater risk. They also advised that a trade-off of factors could be manipulated to reduce the risk for LBP.
The present study has certain limitations inherent to its design and conclusions. The design was a nested cross-sectional study within a larger cohort of volunteer residential construction workers in the Denver Metro area of Colorado participating in the HomeSafe Pilot Program. By virtue of their voluntary participation, the subjects were not truly randomly selected and may not represent the average framing carpenter either in Colorado or in the USA [60, 61]. The use of a cross-sectional design is inherently limiting [62].
The findings represent a slice in time and cannot establish causation. The order of risk factors, endpoints, and other potential confounders and their actual interactions cannot be determined with this type of study [63]. The full dimension of job-task variability may not have been captured due to sample size. Construction is difficult and physically demanding work and is clearly affected by survivor bias [63, 64]. Men and women who cannot manage the stresses and strains inherent in this work leave the industry resulting in a healthy-worker effect with survivor bias. The use of a self-report survey instrument is inherently influenced by a multitude of factors that can potentially affect personal opinions [65, 66]. Although the ergonomic assessment tools in the present study have had great acceptance in the research community and appeared appropriate, their exact use in this study may not have represented their optimum performance. The workers may have been affected by the presence of investigators onsite collecting video recordings of their work, a Hawthorne effect [67]. Job-task sampling time was limited in many cases due to the fragmented nature of construction work, erratic building schedules, lack of materials supply, weather, lack of cooperation by workers or management, etc. Materials or equipment availability, tool operations, job-task skills, authority, interest, or management factors may have resulted in job-task changes moment by moment. Framing carpenters followed a building plan but may have had many divergent paths to achieve the overall goal of building a house with little regard for investigational activities on site. Decisions were made by the investigator about the representative sampling necessary to capture the job-task demands of interest. Inadequate exposure assessment has been identified as a significant limiting factor in studies looking at ergonomic risk factors for LBP and other MSDs [62, 63, 64].
The nature of two-dimensional sampling is inherently limited in its ability to assess real-life activities and motions but captures all factors necessary to make reliable estimates for spinal compression and shear in all planes. This type of assessment makes no effort to describe torsional
forces, which may also pose significant risk. Our investigation may underestimate the risk by omitting measurement of tosional forces and acceleration in non-neutral planes. OWAS evaluation includes spinal twisting as a variable included in the algorithm for estimating risk. The field investigators were limited by hazards on the job-site as well as the need to be inconspicuous and nondisrupting to the usual work process. The tools and materials were weighed with a force gauge provided by the Industrial Hygiene Laboratory from the Department of Environmental and Radiological Health Sciences at Colorado State University. OWAS is a validated assessment tool for ergonomic risk but the sensitivity for detecting posture change is still limited to 30-s captures making it more applicable for use in the evaluation of highly repetitious job-tasks.
Larger sample sizes are more robust for making external inferences about findings including the prevalence of LBP among residential carpenters and associated biomechanical and postural factors. Statistical power has been identified as a limiting factor by other investigators [62, 64, 68]. Regardless of the quality of tools used for exposure assessment in this study, the multidimensional nature of factors attributable to LBP cannot be fully measured [64]. The definition of LBP was vague. The verbiage represented standard medical terminology used in performing medical evaluations of injured and/or disabled workers with LBP [69]. There was no attempt to delineate types of pain or diagnosis. The inexact nature of symptomatic complaints such as LBP has been recognized as a source of potential bias by many investigators [68, 70].
Many prior studies have focused on the presence of ergonomic risk factors such as heavy loads, high trunk stresses, and awkward postures, or epidemiological approaches to identify problematic job-tasks [3, 18, 19, 20, 21, 26, 64, 71, 72]. Carpenters appear to be a group of workers exposed to greater levels of risk relating to LBP; however, limited job-task associations can be made. Findings from this study provide some insight about the biomechanical and postural risk factors by way of the relationship
to the low back strain scores for specific job-tasks. Future research should focus on the link between subjective and objective measures and the prediction of LBP and risk due to acute and cumulative exposures.
6. FINAL CONCLUSIONS
The forces and risks experienced daily in residential framing are significant and need to be accurately characterized before being addressed. LBP remains a problem in all areas of construction, both residential and commercial. This investigation has pioneered ergonomic research in nonunion, residential framing carpentry. The benefits of such research can be achieved through the development of control strategies to reduce workload stresses from their present measured levels thereby reducing risk of LBP in workers. The present study establishes new ground for understanding framing carpentry, asking questions, and suggesting improved methodologies for additional research. It is hoped that more can be learned about the multifactorial nature of LBP and its influences on framing work in residential carpentry. There remains an interest in developing integrated models to predict LBP among carpenters using ergonomic and psychosocial factors as well as control strategies to reduce the incidence of LBP.
REFERENCES
1. Occupational Safety and Health
Administration (OSHA). Back injuries— nation’s number one workplace safety problem (Fact Sheet No. OSHA 93-09). Washington, DC, USA: OSHA; 1993. Retrieved July 2, 2007, from: http://www .osha.gov/pls/oshaweb/owadisp.show _document?p_table=FACT_SHEETS&p _id=146
2. Deyo RA, Weinstein JN. Low back pain. N Engl J Med. 2001;344:363–9.
3. National Institute for Occupational Safety and Health. Musculoskeletal disorders and workplace factors (Publication No. 97-141). Cincinnati, OH, USA: Department of Health and Human Services; 1997.
4. Kahlil TM, Abdel-Moty EM, Rosomoff RS, Rosomoff HL. Ergonomics in back pain. New York, New York, USA: Van Nostrand Reinhold; 1993.
5. Center to Protect Workers’ Rights (CPWR). The construction chart book. Washington, DC, USA: CPWR; 1997.
6. Bureau of National Affairs, 1993. Back pain identified as major problem for U.S. workers in NIOSH study of 1988 data. Occupational Safety & Health Reporter. 1993:22;2068–9.
7. Guo HR, Tanaka S, Cameron LL, Seligman PJ, Behrens VJ, Ger J, et al. Back pain among workers in the United States: mational estimates and workers at high risk. Am J Ind Med. 1995;28:591–602.
8. Guo HR, Tanaka S, Halperin WE, Cameron LL. 1999. Back pain prevalence in the US and estimates of lost workdays. Am J Public Health. 1999;89:1029–35. 9. Marras WS. Occupational low back
disord-er causation and control. Ergonomics. 2000; 43:880–902.
10. Bureau of Labor and Statistics. 1998–99 occupational outlook handbook [University Missouri—St. Louis Libraries edition, derived and modified in 1998]. Retrieved July 2, 2007, from: http://www.umsl.edu/ services/govdocs/ooh9899/161.htm
11. U.S. Department of Labor (USDL), Bureau of Labor and Statistics (BLS). Workplace injuries and illnesses in 1997 (News, USDL 98-494). Washington, DC, USA: USDL, BLS; 1998. Retrieved July 2, 2007, from: http://www.bls.gov/iif/oshwc/osh/os/ osnr0007.pdf
12. Bureau of Labor and Statistics (BLS), U.S. Department of Labor (USDL). Career guide to industries. Washington, DC, USA: USDL, BLS; 2005. Retrieved July 2, 2007, from: http://www.bls.gov/oco/cg/cgs003 .htm#nature
13. Bureau of Labor and Statistics (BLS), U.S. Department of Labor (USDL). [The ten occupations with the largest number of cases by case and worker characteristics, 1997]. Retrieved July 2, 2007, from: http:// www.bls.gov/iif/oshwc/osh/case/ostb0661 .pdf
14. Kisner SM, Fosbroke DE. Injury hazards in the construction industry. J Occup Med. 1994;36:137–43.
15. National Institute for Occupational Safety and Health (NIOSH). Construction (Publica-tion No. 97-152). Washington, DC, USA: NIOSH; 1997.
16. Robinson CF, Burnett CA. Mortality pat-terns of US female construction workers by race, 1979–1990. J Occup Med. 1994;36: 1228–33.
17. Toscano G, Windau J, Drudi D. Using BLS occupational injury and illness classification system as a safety and health management tool. In: Compensation and Working. 1996; (September):34–44.
18. Holmström EB, Lindell J, Moritz U. Low back and neck/shoulder pain in construction workers: occupational work-load and psychosocial risk factors. Part I: relationship to low back pain. Spine. 1992; 17:663–71.
19. Holmström EB, Lindell J, Moritz U. Low back and neck/shoulder pain in construction workers: occupational work- load and psychosocial risk factors. Part II: relationship to neck and shoulder pain. Spine. 1992;17:672–7.
20. Bhattacharya A, Greathouse L, Warren J, Li Y, Dimov M, Applegate H, et al. An ergonomic walkthrough observation of carpentry tasks: a pilot study. Appl Occup Environ Hyg. 1997;14:278–87.
21. Buchholz B, Paquet V, Punnett L, Lee D, Moir S. 1996. Path: a work sampling-based approach to ergonomic analysis for con-struction and other non-repetitive work. Appl Ergon. 1996;12:177–87.
22. Latza U, Kohlmann T, Deck R, Raspe H. Influence of occupational factors on the relation between socioeconomic status and self-reported back pain in population-based sample among German adults with back pain. Spine. 2000;25:1390–7.
23. Li KW. Improving postures in construction work. Ergonomics and Design. 2000;(Fall): 11–16.
24. Schneider S, Griffin M, Chowhurry. Ergono-mic exposures of construction workers: an analysis of the U.S. Department of Labor Employment and Training Administration
databases on job demands. Appl Occup Environ Hyg. 1998;13:238–41.
25. Schneider S, Susi P. Ergonomics and con-struction: a review of potential hazards in new construction. Am Ind Hyg Assoc J. 1994;55:635–49.
26. Stubs DA. Trunk stresses in construction and other industrial workers. Spine. 1981;6: 83–88.
27. Xu Y, Bach E, Orhede E. Occupation and risk for the occurrence of low-back pain (LBP) in Danish employees. Occup Med (Lond). 1996;46:131–6.
28. Karhu O, Kansi P, Kuorinka I. Correcting working postures in industry: a practical method for analysis. Appl Ergon. 1977;84: 199–201.
29. Kivi P, Mattila M. Analysis and improvement of work postures in the building industry: application of the computerized OWAS method. Appl Ergon. 1991;22:43–8.
30. Mattila M, Karwowski W, Vikki M. Analysis of working postures in hammering tasks on building construction sites using the computerized OWAS method. Appl Ergon. 1993;24:405–12.
31. Scott GB, Lambe NR. Working practices in a perchary system, using the OVAKO working posture analysis system (OWAS). Appl Ergon. 1996;27:281–4.
32. Doormaal MT, Driessen AP, Lande-weerd JA, Drost MR. Physical workload of ambulance assistants. Ergonomics. 1995; 38:361–76.
33. Engles JA, Landeweerd JA, Kant Y. An OWAS-based analysis of nurses’ working posture. Ergonomics. 1994;37:909–19. 34. Wright EJ, Haslam RA. 1999. Manual
handling risks and controls in a soft drinks distribution center. Appl Ergon. 1999; 30:311–8.
35. Andrews DM, Wells NRP. Accuracy and repeatability of low back spine compression force estimates from self report of body posture during load handling. Int J Ind Ergon. 1996;18:251–60.
36. Lavender SA, Oleske DM, Nicholson L, Andersson GB, Hahn J. Comparison of five methods used to determine low back
disorder risk in manufacturing environment. Spine. 1999;24:1441–8.
37. Marras WS, Granata KP, Davis KG. Var-iability in spine loading model of per- formance. Clin Biomech (Bristol, Avon). 1999:14:505–14.
38. Marras, WS, Ferguson SA, Gupta P, Bose S, Parnianpour M, Kim J, et al. The quantification of low back disorders using motion measures. Spine. 1999;24: 2091–100.
39. Mirka G, Kelaher DP, Nay DT, Law-rence BM. Continuous assessment of back stress (CABS): a new method to quantify low back stress in jobs with variable biomechanical demands. Hum Factors. 2000;42:209–25.
40. Neumann WP, Wells RP, Norman RW, Andrews DM, Frank J, Shannon HS, et al. Comparison of four peak spinal loading measurement methods and their association with low-back pain. Scand J Work Environ Health. 1999;25:404–9.
41. Schultz AB, Andersson GBJ. Analysis of loads on the lumbar spine. Spine. 1981; 6:76–82.
42. Waters TR, Putz-Anderson V, Garg A, Fine LJ. Revised NIOSH equation for the design and evaluation of manual lifting tasks. Ergonomics. 1993;36:749–76. 43. Straker LM, Stevenson MG, Twomey LT,
Smith LM. 1997. A comparison of risk assessment of a single and combination manual material handling tasks: biome-chanical measures. Ergonomics. 1997;40: 708–28.
44. Norman R, Wells R, Neumann W, Frank J, Shannon H, Kerr M. A comparison of peak vs. cumulative physical work exposure risk factors on the reporting of low back pain in the automotive industry. Clin Biomech (Bristol, Avon). 1998;13:561–73.
45. Gilkey DP, Bigelow PL, Herron RE, Greenstein S, Chadwick BR, Fowler JK. The HomeSafe pilot program: a novel approach to injury prevention in residential construction. Work (Reading, Mass.). 1998;10:167–80.
46. Karhu O, Harkonen R, Sorvali P, Vepsalainen P. Observing working
pos-tures in industry: examples of OWAS application. Appl Ergon. 1981;12:13–7. 47. Tampere University of Technology. Win
OWAS—software for OWAS analysis. Tampere, Finland: Tampere University of Technology; 1992.
48. Kant I, Notermans JHV, Botm PJH. Observations of working postures in garage using Ovako working posture analysis system (OWAS) and consequent work load recommendations. Ergonomics. 1984; 33:199–201.
49. Mattila M, Vikki M, Tiilikainen I. A com- puterized OWAS analysis of work postures in the papermill industry. In: Mattila M, Karwowski W, editors. Computer applica-tions in ergonomics, occupational safety and health. Amsterdam, The Netherlands: North-Holland; 1992. p. 365–72.
50. NexGen Ergonomics. ErgoMaster™ opera-tions manual. Pointe Claire, Montreal, Que., Canada: Nexgen Ergonomics; 2001. 51. Neter J, Wasserman W, Whitmore G.
Applied statistics. Boston, MA, USA: Allyn and Bacon; 1993.
52. SAS. SAS/STAT® user’s guide version 8 (Vol. 1, 2, 3). Cary, NC, USA: SAS Insti-tute; 1999.
53. SPSS. SPSS® Base 10.0 user’s guide. Chicago, IL, USA: SPSS; 1999.
54. SPSS. SPSS® advanced models 10.0 user’s guide. Chicago, IL, USA: SPSS; 1999. 55. Marras WS. Biomechanics of the human
body. In Salvendy G, editor. Handbook of human factors and ergonomics. New York, NY, USA: Wiley Interscience; 1997. p. 233–67.
56. Andersson GBJ. The epidemiology of spinal disorders. In: Frymoyer JW, editor. The adult spine: principles and practices. 2nd ed. Philadelphia, PA, USA: Lippincott Raven Publishers; 1997. p. 93–217.
57. Zwerling C, Miller ER, Lynch CF, Torner J. Injuries among construction workers in rural Iowa: emergency surveillance. J Occup Environ Med. 1996;38:698–704.
58. Marras WS, Lavender SA, Leurgans SE, Rajula SL, Allread WG, Fathallah FA, et al. The role of dynamic three-dimensional trunk motion in occupationally-related low back disorders. Spine. 1993;18:617–28.
59. Marras WS, Lavender SA, Leurgans SE, Fathallah FA, Ferguson SA, Allread WG. Biomechanical risk factors for occupatio-nally related low back disorders. Ergono-mics. 1995;38:377–410.
60. Bigelow PL, Greenstein S, Keefe TJ, Gilkey DP. Development of an on-site, behavior-based safety audit for the residential construction industry. Work (Reading, Mass.). 1998;11:11–20.
61. Bigelow PL, Gilkey DP, Greenstein S, Kirsch MP. Evaluation of HomeSafe: an injury and illness prevention program in residential construction. Work (Reading, Mass.). 1998;11:21–33.
62. Heacock H, Koehoorn M, Tan J. 1996. Applying epidemiological principles to ergonomics: a checklist for incorporating sound design and interpretation of studies. Appl Ergon. 1996;28:165–72.
63. Sorock GS, Courtney TK. Epidemiologic concerns for ergonomists: illustrations from the musculoskeletal disorder literature. Ergonomics. 1996;39:562–78.
64. Burdorf A, Sorock G. Positive and negative evidence of risk factors for back disorders. Scand J Work Environ Health. 1997;23: 243–56.
65. Davis KG, Heaney CA. The relationship between psychosocial work characteristics
and low back pain: underlying
methodological issues. Clin Biomech (Bristol, Avon). 2000;15:389–406.
66. Viikari-Juntaura E, Rauas S, Martikainen R, Kuosma E, Riihimaki H, Takala E, et al., Validity of self-reported physical work load in epidemiological studies of musculoskeletal disorders. Scand J Work Environ Health. 1996;22:251–9.
67. Rossi PH, Freeman HE, Wright SR. Evaluation: a systemic approach. Beverly Hills, CA, USA: Sage; 1979.
68. Bouter LM, van Tulder MW, Koes BW. Methodological issues in low back pain research in primary care. Spine. 1998;23: 2014–20.
69. Gilkey DP, Williams HA. The IME Guide Book. Ft. Collins, CO, USA: D&H; 1998. 70. Miettinen OS, Caro JJ. Medical research on
a complaint: orientation and priorities. Ann Med. 1989;21:399–401.
71. Kelsey JL, White AA. 1980. Epidemiology and impact of low-back pain. Spine. 1980; 5:133–42.
72. Kelsey JL, Golden AL. Occupational and workplace factors associated with low back pain. In: Deyo RA, editor. Occupational back pain: spine, state of the art reviews. Philadelphia, PA, USA: Hanley & Belfus; 1987. p. 7–31.