SHIA_Landslide:
Developing a physically based model to
predict shallow landslides triggered by
rainfall in tropical environments
by
EDIER VICENTE ARISTIZÁBAL GIRALDO
A thesis submitted to the Department of Geosciences and Environment of the Universidad Nacional de Colombia - Medellín in partial fulfillment of the requirements for the degree of
“...even if it were the case that the natural laws had no longer any secret for us, we could still only know the initial situation approximately. If that enabled us to predict the succeeding situation with the same approximation, that is all we require, and we should say that the phenomenon had been predicted, that it is governed by laws. But it is not always so - it may happen that small differences in the initial conditions produce very great ones in the final phenomena. A small error in the former will produce an enormous error in the latter...”
Henri Poincaré (1854-1912) Initial conditions (Science and Method, 1914, p.68)
Cover photograph: Landslides triggered by rainfall in the September 21, 1990 rainstorm in La Arenosa catchment, to the northern of the Colombian Central cordillera taken from Mejía & Velásquez (1991).
ii
SHIA_LANDSLIDE: DEVELOPING A PHYSICALLY BASED
MODEL TO PREDICT SHALLOW LANDSLIDES TRIGGERED BY
RAINFALL IN TROPICAL ENVIRONMENTS
EDIER VICENTE ARISTIZÁBAL GIRALDO
Director:
I.C. Jaime Ignacio Vélez Upegui, MSc. PhD
Codirector:
I.G. Hernán Eduardo Martínez Carvajal, MSc. PhD
DOCTORADO EN INGENIERÍA – RECURSOS HIDRÁULICOS ESCUELA DE GEOCIENCIAS Y MEDIO AMBIENTE
FACULTAD DE MINAS
UNIVERSIDAD NACIONAL DE COLOMBIA SEDE MEDELLÍN 2013
iii
To my brother, you will be with me forever, I love you. For my son, thank you for giving meaning to my life again.
iv
Acknowledgments
This project would not have come to fruition without the input, assistance, and guidance of many people.
Above all, I would like to express my deepest gratitude to my supervisors, Prof. Jaime Ignacio Vélez Upegui, in the National University of Colombia, and, Prof. Hernán Eduardo Martinez Carvajal, in the University of Brasilia in Brazil, for their support, valuable guidance and advice. Thank you so very much.
Also, I wish to thanks to Prof. Michel Jaboyedoff, in the University of Laussane (Switzerland), an honorable mention to the CERG-C staff (Assessment and Management of Geological and Climate Related Risk program) in the Section of Earth and Environmental Sciences, University of Geneva (Switzerland), especially to Dr. Corine Frischknecht and Prof. Costanza Bonadonna. The internship programme and specialization certificate was possible thanks to the financial support from the Hans Wilsdorf Foundation to the author.
Thanks to the Colombian Association of Petroleum Geologists and Geophysicist (ACGGP), who provided partial funds during my first year.
Thanks to ISAGEN S.A. E.S.P., who kindly allowed me access to information on La Arenosa catchment, and permitted the presentation of this case study.
I would also like to thank Dr. Oscar Mesa for your advice, help and encouragement at the beginning of this journey; Cristian Herrera and Nicolas Velásquez for assistance with FORTRAN; Johanna Jimenez, Armando Ealo, Cristina Martinez, Tommy González, and Carlos Restrepo, who provided data used in this research; Matthew Wahl and Helena Barbosa, I appreciate your generous help in editing this manuscript. I sincerely thank the official reviewers of the dissertation, Professor Willy Lacerda of Federal University of Rio de Janeiro in Brazil, Dr. Pedro Restrepo, senior scientist of the National Weather Service of the United States government, and Professor Edwin García of the Antioquia University in Colombia; for their time, careful work and valuable comments and suggestions on the work.
Finally, special thanks to my family and wife Maria Isabel, whose support was invaluable.
v
Abstract
Landslides are one of the main causes of human and economic losses worldwide. Therefore, landslide hazard assessment and the capacity to predict these phenomenon has been a topic of great interest within scientific community for implementation of early warning systems. Although, several models has been proposed to forecast shallow landslides triggered by rainfall, no model has yet incorporated geotechnical factors into a complete hydrologic model, one that simulates the storage and movement of rainwater through soil profile, providing multiple components that can be calibrated along with measurements of surface discharge and perched water table fluctuation. The present paper develops a conceptual and physically based model, named SHIA_Landslide, for shallow landslide prediction triggered by rainfall in tropical environments and complex terrains supported by geotechnical and hydrological aspects occurring over a basin wide scale. SHIA_Landslide is an original and significant contribution that offers a new perspective to analyses shallow landslide processes, incorporating a full and comprehensive distributed hydrological tank model that includes water storage in the soil, coupled with a geotechnical and classical analysis of infinite-slope stability under saturated conditions. SHIA_Landslide can be distinguished by: (i) the capacity to capture the surface topography and its effects concerning the overland flow and the concentration cells of subsurface flow; (ii) it uses DTM to establish the relationships among cells, geomorphologic parameters, slope angle, direction, etc., needed for the model; (iii) rainfall dataset can be incorporated with the spatial and temporal resolution preferred and available; (iv) continuous simulation for long periods of rainfall data (years) or event simulations for specific storms; (v) consider the effect of horizontal and vertical flow; (vi) is at a basin scale; (vii) includes a hydrologically complete water process that permits perched water table calibration. All these conditions of SHIA_Landslide make the model as an interesting tool to be implemented in early warning system, combined with real-time rainfall monitoring and dissemination of alerts and communication.
vi
Resumen
Los deslizamientos son una de las principales causas de pérdidas humanas y económicas alrededor del mundo. Por lo que la evaluación de la amenaza por deslizamientos, y la capacidad de predecir estos fenómenos ha sido un tema de gran interés e la comunidad científica para la implementación de sistemas de alerta temprana. Aunque diferentes modelos se han propuesto para el pronóstico de deslizamientos superficiales detonados por lluvia, ningún modelo ha incorporado elementos geotécnicos en un modelo hidrológico completo, que simule el almacenamiento y el movimiento del agua lluvia a través del perfil del suelo, proporcionando nuevas variables que pueden ser calibradas con mediciones como caudales y flujo subsuperfical. En el presente trabajo se desarrolla un modelo conceptual y con base física, denominado SHIA_Landslide, para la predicción de deslizamientos superficiales detonados por lluvias en ambientes tropicales y terrenos complejos, soportado en aspectos geotécnicos e hidrológicos a escala de cuenca. SHIA_Landslide es una contribución original y significativa que ofrece una nueva perspectiva al análisis de los procesos de deslizamientos superficiales, que incorpora un modelo hidrológico distribuido de tanques que incluye el almacenamiento del agua en el suelo, con un análisis geotécnico y clásico de estabilidad de talud infinito en condiciones saturadas. SHIA_Landslide se distingue por: (i) la capacidad de capturar la topografía de la superficie y sus efectos sobre el flujo superficial y las áreas de concentración de flujo subsuperficial , (ii) utiliza el DTM para establecer las relaciones entre las celdas necesarias para el modelo como los parámetros geomorfológicos, ángulo de inclinación, dirección, etc; (iii) la precipitación puede ser incorporado con la resolución espacial y temporal preferida y disponible; (iv) simulación continua durante largos períodos de datos de lluvia (años) o simulaciones de eventos para tormentas específicos; (v) considera el efecto de flujo horizontal y vertical; (vi) es en una escala de la cuenca; (vii) incluye un modelo hidrológico completo que permite la calibración del flujo subsuperficial. Todas estas condiciones hacen de SHIA_Landslide una herramienta interesante para ser implementado en un sistema de alerta temprana, combinado con el monitoreo en tiempo real de la lluvia y la difusión de alertas.
vii
Table of contents
Abstract
Introduction ... 1
1. Statement of the issue ... 5
1.1 Background ... 5
1.2 The need of a landslide early warning system for the Aburrá Valley-Colombia ... 9
1.3 Hazard and vulnerability in the Aburrá Valley ... 10
1.4 Risk condition of the Aburrá Valley ... 12
1.5 The target area for the implementation of the model ... 13
1.6 The September 21, 1990 rainstorm in La Arenosa catchment ... 16
2. Formulation of the problem ... 21
2.1 Objective ... 21
2.2 Specific objectives ... 21
2.3 Working hypothesis ... 22
2.4 Research questions and hypothesis testing ... 22
2.5 Scope ... 23
3. Rainfall-induced shallow landslides ... 25
3.1 Characteristics and mechanisms of shallow landslides triggered by rainfall ... 26
3.2 Variables of landslides triggered by rainfall ... 28
3.3 Models for hazard assessment and prediction of landslides triggered by rainfall ... 34
3.4 Statistical methods for defining critical thresholds of rainfall ... 37
3.5 Physical methods to define critical rainfall thresholds ... 39
3.5.1 Hydrological analysis in physical methods ... 40
3.5.2 Geotechnical aspects of physical methods ... 46
3.6 Landslide prediction and early warning systems ... 52
3.6.1 Conceptual models for landslide prediction ... 54
3.6.2 Landslide early warning systems around the world ... 57
4. The model: SHIA_Landslide ... 61
4.1 Introduction ... 61
4.2 Conceptual model for landslide triggered by rainfall in tropical and mountainous ... 63
4.3 tropical weathering ... 63
4.4 Subhorizontal flow formation ... 68
viii
4.6 Soil capacity for storing water ... 69
4.7 Water content in the soil... 71
4.8 Rainfall ... 72
4.9 Vegetation ... 73
4.10 Spatial and temporal scale ... 73
4.11 Hydrological module ... 74
4.12 Geotechnical module ... 87
4.13 Correction factors ... 93
4.14 Model evaluation ... 94
4.15 The coupled hydrologic-geotechnical model: SHIA_Landslide ... 96
4.16 Programming language ... 96
4.17 Subroutines ... 97
4.18 Input and output data ... 98
4.19 Graphical user interface (GUI) ... 102
5. Calibration and implementation of the model: La Arenosa case ... 109
5.1 Introduction ... 109
5.2 Digital Terrain Model (DTM) ... 110
5.2.1 Digital elevation model (DEM) ... 111
5.2.2 Slope map ... 111
5.2.3 Direction flow map ... 111
5.2.4 Flow accumulation map ... 113
5.3 Soil properties ... 113
5.3.1 Geotechnical parameters ... 118
5.3.2 Hydrological parameters ... 118
5.4 Historical rainfall and stream flow data ... 122
5.5 Geomorphological and correction parameters of the model ... 125
5.5.1 Geomorphological Kinematic Wave (GKW) parameters ... 125
5.5.2 Correction parameters ... 125 5.5.3 Initial conditions ... 126 5.6 Calibration procedure ... 127 5.6.1 Hydrological calibration... 130 5.6.2 Geotechnical calibration ... 133 5.6 Validation ... 137
ix
6.1 Comparing linear and nonlinear model ... 147
6.2 Spatial performance of the model ... 149
6.2.1 Susceptibility map ... 150
6.2.2 Hazard map ... 151
6.3 Temporal performance of the model ... 152
6.4 ROC analysis and comparing ... 153
6.5 Sensitivity analysis ... 159
6.5.1 Antecedent rainfall ... 160
6.5.2 Hydraulic conductivity changes ... 161
6.5.3 Rainfall thresholds ... 162
6.5.4 Saturated conditions ... 165
6.6 An early warning system ... 166
6.7 Final remarks ... 171
7. Conclusions ... 178
References ... 182 Appendix A: SHIA_LANDSLIDE program
x
List of figures
Figure 1.1Average seasonal cycle of distribution of landslide occurrence in the period 1880 - 2007 (blue bars) versus average monthly precipitation for the Aburrá Valley (black line) (Hormaza, 1991; Saldarriaga, 2003; Aristizábal &
Gómez, 2007) ... 8
Figure 1.2 Location of the Aburrá Valley. Red color represents urban development. ... 9
Figure 1.3 Location of the La Arenosa catchment, in the southeastern side of the humid tropical and complex terrains of Central Andean Cordillera in Colombia. ... 14
Figure 1.4 General topography of La Arenosa catchment. The basin is highly dissected with steep hillslopes. ... 15
Figure 1.5 Mean seasonal cycle of La Arenosa precipitation in mm. It is characterized by a bimodal rainfall pattern, with maximum peaks in May and October. ... 15
Figure 1.6 Hourly rainfall histogram of the September 21, 1990 rainstorm. In less than 3 hours a precipitation of 208 mm fell within the study area, triggering 808 landslides in La Arenosa catchment ... 17
Figure 1.7.General view of the La Arenosa upper catchment with distribution of shallow landslide triggered by rainfall in the September 21, 1990 rainstorm (Taken from Mejía & Velásquez, 1991). ... 17
Figure 1.8 Landslides material removed from the upper catchment slopes was later carried away by runoff producing torrential floods that destroyed 27 houses (left picture) and severe damaged to the Calderas Hydroelectric Plant of ISAGEN (right picture) (Taken from Mejía & Velásquez, 1991). ... 18
Figure 1.9 Landslides scars produced by the September 21, 1990 rainstorm. Read lines shows the landslide scars according to landslide database elaborated by Mejía & Velásquez (1991) and INTEGRAL (1990). ... 19
Figure 1.10 Detailed of shallow landslide triggered by rainfall in the September 21, 1900 rainstorm in La Arenosa catchment (Taken form Mejía & Velásquez, 1991).. ... 20
Figure 3.1 Factors controlling the occurrence and distribution of landslide in the hillslope systemOOOOO26 Figure 3.2 Two possible mechanisms for the saturation for shallow landslides triggered by rainfall: left: rising perched water table with parallel to slope seepage; right: wetting front advancing from the slope surface (modified from Xie et al., 2004)... ... 28
Figure 3.3 Schematic three-dimensional weathering profile of a convergent morphology slope under rainfall conditions. (Ө) volumetric water content (Ψ) pore pressure, (k) permeability, (W) weight.... ... 29
Figure 3.4 Classification of landslide zonation methods.... ... 35
Figure 4.1 Typical weathering profile of tropical environments and complex terrains.... ... 65
Figure 4.2 Catena and hillslope hydrological processes. Soil thickness distribution varies according to the slope inclination... ... 67
Figure 4.3 Water content into the soil and water available. Root depth (Zr), Soil thickness (Zs), permanent wilting point (Wpwp), field capacity (Wfc), Saturation (Ws)... ... 71
Figure 4.4 Hydrological conceptual model. Static storage (T1),surface storage (T2), Gravitational storage (T3), aquifer (T4), channel (T5), rainfall (R1), excedence (R2), Infiltration (R3), Percolation (R4), groundwater outflow (R5), overland flow (E2), subsurface flow (E3), base flow (E4), stream flow (E5), inflow to the tanks (D1:5), and evapotranspiration (EVP).... ... 75
Figure 4.5 Hydrological module proposed, modified Vélez (2001) ... 78
Figure 4.6 Interconnection tanks of the hydrological module ... 86
Figure 4.7 Schematic division of the basin into grid cells and flows ... 87
Figure 4.8 Geotechnical conceptual model proposed. FS = factor of safety, C is the effective cohesion, g is the gravitational acceleration, is the soil bulk density, is the water density, is the saturated soil thickness above the slip surface, Z, is the soil thickness measured vertically, is the gradient of the hillslope. ... 89
Figure 4.9 Landslide susceptibility as a function of slope angle and soil thickness (modified from D’Odorico & Fagherazzi, 2003). ... 91
Figure 4.10 Geotechnical module of SHIA_Landslide ... 92
xi
Figure 4.12 Flow chart of SHIA_Landslide program ... 99
Figure 4.13 Format for the ASCCI files to introduce the parameters to SHIA_Landslide. ... 100
Figure 4.14 Format for the rainfall data to introduce to SHIA_Landslide. Each ID number corresponds to a raingauge station. ... 100
Figure 4.15 Graphical user interface main window designed for SHIA_Landslide. ... 102
Figure 4.16 Result window provides for SHIA_Landslide.. ... 104
Figure 4.17 SHIA_Landslide products. Left-up: simulated and observed stream flow, right-up: simulated perched water table. Left-down: susceptibility map, right-down: hazard map.. ... 106
Figure 5.1 Digital Elevation Model of La Arenosa catchment. ... 110
Figure 5.2 Slope map of La Arenosa catchment.. ... 112
Figure 5.3 Direction flow map of La Arenosa Catchment... ... 112
Figure 5.4 Flow accumulation map of La Arenosa Catchment.... ... 113
Figure 5.5 Soil map of La Arenosa catchment elaborated by IGAC (2007a)... ... 114
Figure 5.6 Land cover map of La Arenosa catchment elaborated by IGAC (2007b)... ... 117
Figure 5.7 Soil thickness map of La Arenosa catchment.. ... 119
Figure 5.8 Maximum static storage for La Arenosa catchment... ... 120
Figure 5.9 Maximum gravitational storage for La Arenosa catchment... 121
Figure 5.10 Potential evapotranspiration map for La Arenosa catchment. ... 122
Figure 5.11 Shows the time series of rainfall for the Calderas and La Arenosa rain gauges. ... 123
Figure 5.12 Hourly rainfall of Calderas rain gauge between august 2007 and December 2012 ... 123
Figure 5.13 Hourly rainfall in La Arenosa catchment for the period August 2007 - December 2012 ... 124
Figure 5.14 Hourly stream flow time series simulated of La Arenosa stream station between august 2007 and December 2012 ... 125
Figure 5.15 Rainfall time series of Calderas rain gauge for the period March and May 2007 ... 130
Figure 5.16 Rainfall time series of La Arenosa rain gauge for the period March and May 2007 ... 130
Figure 5.17 Results using nonlinear SHIA_Landslide of simulated hourly discharges at the calibration flow gauge station La Arenosa during the calibration period compared with the discharges obtained for La Arenosa stream. ... 131
Figure 5.18 Results using linear SHIA_Landslide of simulated hourly discharges at the calibration flowgauge station La Arenosa during the calibration period compared with the discharges obtained for La Arenosa stream. ... 131
Figure 5.19 Nonlinear simulated perched water table level for an slope grid cell (accumulated area = 800 m2) of La Arenosa for the period between March and May 2007. ... 132
Figure 5.20 Linear Simulated perched water table level for an slope grid cell (accumulated area = 800 m2) of La Arenosa for the period between March and May 2007. ... 133
Figure 5.21 Rainfall from La Arenosa rain gauge for the period July to September 1990. ... 134
Figure 5.22 Stream flow simulated for nonlinear SHIA_Landslide for the period July to September 1990.. ... 134
Figure 5.23 Stream flow simulated for linear SHIA_Landslide for the period July to September 1990. ... 134
Figure 5.24 Perched water table level simulated for nonlinear SHIA_Landslide for the period July to September 1990 for a slope grid cell (800 m2).. ... 135
Figure 5.25 Perched water table level simulated for linear SHIA_Landslide for the period July to September 1990 for a slope grid cell (800 m2). ... 135
xii
Figure 5.27 Areas with landslide occurrence triggered by the September 1990 rainstorm simulated by nonlinear
SHIA_Landslide. ... 137
Figure 5.28 areas with landslide occurrence triggered by the September 1990 rainstorm simulated by linear SHIA_Landslide. ... 138
Figure 5.29 rainfall time series for La Arenosa rain gauges. ... 139
Figure 5.30 Rainfall time series for Calderas rain gauges. ... 139
Figure 5.31 Simulated discharge from nonlinear SHIA_Landslide compared to La Arenosa discharge.. ... 140
Figure 5.32 Simulated discharge from linear SHIA_Landslide compared to La Arenosa discharge for the period September to November2012 ... 140
Figure 5.33 Nonlinear Simulated perched water table level slope grid cell (accumulated area = 800 m2) ... 141
Figure 5.34. Linear Simulated perched water table level slope grid cell (accumulated area = 800 m2) ... 141
Figure 5.35 Areas reported for nonlinear SHIA_Landslide with landslide occurrence triggered by rainfall for the period September to November 2012 ... 142
Figure 5.36 Areas reported for linear SHIA_Landslide with landslide occurrence triggered by rainfall for the period September to November 2012 ... 143
Figure 5.37 Rainfall time series for La Arenosa rain gauges for the period from September to November 2007 ... 143
Figure 5.38 Rainfall time series for Calderas rain gauge Landslide for the period from September to November 2007 144 Figure 5.39 Simulated discharge according to nonlinear SHIA_Landslide compared to La Arenosa Discharge for the period from September to November 2007. ... 144
Figure 5.40 Simulated discharge according to linear SHIA_Landslide compared to La Arenosa Discharge Landslide for the period from September to November 2007. ... 145
Figure 5.41 Simulated perched water table level using nonlinear SHIA_Landslide for the period from September to November 2007 ... 145
Figure 5.42 Simulated perched water table level using linear SHIA_Landslide for the period from September to November 2007. ... 145
Figure 5.43 Areas simulated by nonlinear SHIA_Landslide with landslide occurrence triggered by rainfall for the period from September to November 2007.. ... 146
Figure 5.44 Areas simulated by linear SHIA_Landslide with landslide occurrence triggered by rainfall for the period from September to November 2007. ... 146
Figure 6.1 Temporal analysis of model performance for the September 21, 1990 rainstorm. Considering only cells correctly classified as unstable for the no-linear model. ... 154
Figure 6.2 ROC analysis matrix ... 154
Figure 6.3 ROC analysis map for La Arenosa rainstorm event. ... 155
Figure 6.4 SHALSTAB model applied for the September 21, 1990 rainstorm by Martinez (2012). ... 158
Figure 6.5 Perched water table simulated for nonlinear SHIA_Landslide for a slope grid cell with a accumulated drainage area of 800 m2 and a hydraulic conductivity of 0,01Ks ... 161
Figure 6.6 Perched water table simulated for nonlinear SHIA_Landslide for a slope grid cell with a accumulated drainage area of 800 m2 and a hydraulic conductivity of 0,1Ks ... 162
Figure 6.7 Perched water table simulated for nonlinear SHIA_Landslide for a slope grid cell with a accumulated drainage area of 800 m2 and a hydraulic conductivity of Ks ... 162
Figure 6.8 Perched water table simulated for nonlinear SHIA_Landslide for a slope grid cell with a accumulated drainage area of 800 m2 and a hydraulic conductivity of 10Ks ... 163
Figure 6.9 Perched water table simulated for nonlinear SHIA_Landslide for a slope grid cell with a accumulated drainage area of 800 m2 and a hydraulic conductivity of 100Ks ... 163
Figure 6.10 Percentage of potentially unstable grid cells according to the maximum rainfall peak for La Arenosa catchment ... 164
xiii
Figure 6.11 Landslide triggered by rainfall according to the maximum rainfall peaks. Percentage is related to the
potentially unstable grid cells ... 165
Figure 6.12 Landslide occurrences according to saturation percentage for La Arenosa catchment ... 166
Figure 6.13 Landslide occurrences according to perched water table increasing... 167
xiv
List of tables
Table 1.1 Population and population growth in the Aburrá Valley (Data from DANE, 2005) ... 10
Table 1.2 Main landslides occurred in the Aburrá Valley (Hormaza, 1991; Saldarriaga, 2003; Aristizábal & Yokota, 2006).Landslides in 1954, 1974, 1987, and 2012 has been the most deadly disasters ... 12
Table 1.3 Homes and population located in high risk areas (UNal, 2009). 5% of Aburrá Valley inhabitants is located on high risk areas. ... 13
Table 3.1 Review of most of physically based models used by researchersOOOOOOOOOOOOOOOO55 Table 4.1 Geomorphological Kinematic Wave parameter ranges proposed for the model ... 85
Table 4.2 Correction parameters used for the model ... 93
Table 5.1 Depth and particle size of the soil profiles present in Yarumal Association. ... 115
Table 5.2 Particle size of the soil profiles present in Poblanco Association... 116
Table 5.3 Land cover for La Arenosa catchment.. ... 117
Table 5.4 Soil parameters of La Arenosa catchment. ... 121
Table 5.5 Geomorphological Kinematic Wave parameters for SHIA_Landslide ... 126
Table 5.6 Correction parameters used for the model ... 127
Table 5.7 Initial condition ... 128
Table 5.8 Calibration and validation periods selected. Maximum rainfall intensity (MRI). ... 128
Table 5.9 Susceptibility grid cells classification by SHIA_Landslide ... 136
Table 5.10 Hazard map: landslides triggered by rainfall for linear and nonlinear SHIA_Landslide for the period July to September 1990. Simulated unstable grid cells are in red, and percentage is estimated according to the total number of potentially unstable grid cells (51,176) ... 138
Table 5.11 Simulated unstable grid cells for linear and nonlinear SHIA_Landslide Landslide for the period September to November 2012. Total percentage corresponds to the number of potentially unstable grid cells (51,176) ... 141
Table 5.12 Simulated unstable grid cells for linear and nonlinear SHIA_Landslide Landslide for the period from September to November 2007. Total percentage corresponds to the number of potentially unstable grid cells (51,176 ... 145
Table 6.1 Comparison between nonlinear and linear SHIA_Landslide. Maximum rainfall intensity (MRI). ... 148
Table 6.2 ROC analysis for La Arenosa rainstorm event. ... 155
Table 6.3 Statistical indexes measuring the performance of SHIA_Landslide shown in figure 6.3. ... 157
Table 6.4 Comparison of SHALSTAB and SHIA_Landslide for La Arenosa rainstorm event. ... 157
Table 6.5 Comparison of SHIA_Landslide and SHALSTAB performance.. ... 159
INTRODUCTION
In tropical and complex terrains, landslides are one of the main causes of human and economic losses worldwide (Schuster, 1996; Sidle & Ochiai, 2006). Expanded land urbanization is increasing the vulnerability to landslides due to high concentration of population and lifelines along areas of higher landslide susceptibility. Therefore, landslide hazard assessment and the capacity to predict these phenomenon has been a topic of great interest to the scientific community (Aleotti & Chowdhry, 1999; Chacon et al., 2006; Godt et al., 2012; Cepeda et al., 2009).
In regards to the magnitude of the landslide issue, numerous studies have been developed in recent years and have increase the understanding of the causes involved in these morphodynamic processes. However, because of the complexity related to landslide occurrence, there is still great uncertainty in predicting their occurrence. Landslides are caused by a variety of geologic, and anthropologic factors – compelling researchers to take an interdisciplinary approach in order to predict them, integrating concepts of soil mechanics hydrogeology, and geomorphology (Crosta & Frattini, 2008). Landslide hazard is a function of slope susceptibility, which depends exclusively on conditional factors, and the frequency and magnitude of the phenomenon, which is related to triggering factors (Brunsden, 2002). Some authors consider that the biggest challenge for landslide investigation is the need to predict landslide occurrence in terms
Introduction
---
2
of time, thus it is essential to understand and characterize their triggering factors (Aristizábal & Yokota, 2006).
Although multiple causes play an important role on landslide occurrence, usually just a single factor becomes the triggering element, generating an almost immediate response, which is to mobilize slope materials, either by the rapid increase stresses or by reducing shear strength (Wang & Sassa, 2003). This triggering factor is generally rainfall, earthquakes, volcanic eruptions or human activities. In tropical environments and complex terrains like the Colombian Andes, a high percentage of these landslides are triggered by heavy or prolonged rainfall (Aristizábal & Gómez, 2007).
Rainfall induced shallow landslides are a common problem in many tropical areas covered by thick residual soils and subjected to tropical rainfall regimes. The modeling of shallow landslide triggered by rainfall has great interest within scientific community for implementation of early warning systems –EWS- (Caine, 1980; Montgomery & Dietrich, 1994; Finlay et al., 1997; Crosta, 1998; Terlien, 1998; Crozier, 1999; Polemio & Petrucci, 2000; Iverson, 2000; NOAA-USGS, 2005; Restrepo et al., 2008; Larsen, 2008). The warning of the community of shallow landslide occurrence can be provided based on landslide modeling combined with rainfall forecasts and real-time detection. A comparative analysis of the frequencies and impacts of various natural disasters by the International Early Warning Programme (2005) and Guzzetti et al. (2005) have shown that overall damages arising from natural disasters occur more often than the capacity for society to prevail via their economic resilience. Therefore, new approaches must focus on land use planning and developing and implementing early warning systems in order to minimize loss of life and infrastructure. Although EWS are currently considered one of the most practical and effective measures for disaster prevention, just few EWS for shallow landslides have been implemented around the world based on empirical thresholds, and there is not any EWS supported by physical
SHIA_Landslide ---
3
models. Much more work need to be carried out on this subject to reduce human and economic losses.
Most of the models proposed for shallow landslide prediction show very complex relationship with a great number of input parameters, or very simple functions letting out fundamental variables which play an important role on this subject. Furthermore, all these models available are applied just for very special environmental conditions that do not allow adjusting them to particular rainfall and terrain complexities such as the Colombian tropical Andes.
The present research project aims to develop a conceptual and physically based model for shallow landslide prediction triggered by rainfall in tropical environments and complex terrains supported by geotechnical and hydrological aspects occurring over a basin wide scale, which is named SHIA_Landslide.
SHIA_Landslide is an original and significant contribution that offers a new perspective to analyses shallow landslide processes for a basin scale, incorporating a full and comprehensive distributed hydrological tank model that includes water storage in the soil, coupled with a geotechnical and classical analysis of infinite-slope stability under saturated conditions. With this new conceptual model, it was built a complete algorithms and Fortran code with a graphical user interface that allows users to easily implement the model. Finally the model was tested using a real case in the Colombian Andes validating the high capacity of prediction.
This research was conducted to improve the understanding of the mechanism associated with slope instability and rainfall infiltration in mountainous areas located in rainy environments, where population pressure is leading to the expansion of development into landslide-prone areas.
The model is validated by using a real case which occurred in the La Arenosa catchment on September 21, 1990, more specifically at the Central Cordillera of
Introduction
---
4
Colombian Andes. During this rainstorm, more than 838 shallow landslides were triggered, removing from the steep slopes approximately 1.5 Mm3 of soil.
SHIA_Landslide is a potential tool for local and regional risk management offices for emergency planning purposes focused on prevention measures, as well for land-use management, since it can be used to evaluate landslide susceptibility of an specific area that is going to be urbanized.
Chapter 1
STATEMENT OF THE ISSUES
1.1 Background
Human and economic losses generated by landslides occur every year in all countries; however, the impact of landslides varies considerably according to the local geological conditions and socio-economic vulnerability (Alcantara - Ayala, 2002; Harp et al., 2009). Although landslides do represent changes in terrain morphology within the natural and continuous geomorphological cycle (Scheidegger, 1998) their occurrence in recent decades has been closely tied to world population growth and consequent urban expansion on susceptible slopes to this type of processes. The urban population of developing countries has increased by 5 times in 40 years and continues to increase rapidly (UN; 2006a; UNFPA, 2007). The greatest landslide losses occur in the Ring of Fire countries (Alcantara - Ayala, 2002). Estimation made by Varnes (1981) indicates that 89% of deaths due to landslides take place in those countries. Data presented by Sidle & Ochiai (2006) pointed that the Asian continent gathers the largest number of landslide victims, where Nepal stands at 186 deaths per year, followed by Japan and
Chapter 1: Statement of the issues
---
6
China, with 170 and 140-150, respectively. In Latin America, Brazil holds the first place with an average of 88 people killed per year. In economic terms, Japan is the country most affected by landslides, with an estimated loss of 4 billion dollars annually, followed by Italy, India and the United States with losses ranging from 1 to 2 billion dollars per year (Cruden et al., 1989; Schuster, 1996; Schuster & Highland, 2001; Sidle & Ochiai, 2006).
Although the occurrence of landslides has impacted the Colombian Andes for a long time, specific studies on this subject remark such events only from the 80's (Shlemon 1979). Essentially, these studies evaluated landslide susceptibility through methodologies based on morphological criteria (Chica, 1987; Ingeominas 1990; Florez et al., 1996 & 1997; García, 2004); also, few studies considering rainfall as a triggering factor have been carried out in our country.
Early studies appear at the beginning of the 90’s in Colombia. Paz & Torres (1989) concluded that landslides which occur in the northern Colombian Central Andes take place during normal precipitation events on any day of the year where most landslides occur under normal conditions.
Gómez (1990) studied the relationship between distant rainfall infiltration with deep landslides and the relationship between local storms and shallow landslides in Bucaramanga, through a predictive model of groundwater levels from rainfall. Van Westen et al. (1994) proposed for the Chinchina river basin a bidimensional hydrological model to estimate the position and seasonal fluctuations in water table. Castellanos (1996) and Castellanos & González (1996, 1997) studied the relationship of rainfall with landslides in Colombia. These authors relate critical rainfall with annual rainfall and critical duration with critical rainfall. Terlien (1997) carried out a hydrological study in volcanic soils in the city of Manizales (Colombia) with the objective to find areas with positive pore pressure, which are defined as locations of potential failure with significant vertical changes in hydraulic conductivity. This analysis revealed that
SHIA_Landslide ---
7
landslides are triggered by daily rainfall above 70 mm, while deep landslides are triggered by antecedent rainfall over 200 mm in 25 days. Terlien proposed a finite element one-dimensional hydrologic model which was calibrated with real data from piezometers and tensiometers installed on the field.
Arango (2000) studied groundwater levels and their impact on the safety factor of slopes in the city of Manizales. The results found by this author show that the best indicators are antecedent rainfall of 30 days with a lag of about one month between the rainfall and landslides, and 15 days between rainfall and rising water table.
Mayorga (2003) studied the relationship of rainfall with landslide occurrence across Colombia, according to previously defined characteristics of landslide types. This work presents a statistical methodology using the linear regression method for building critical rainfall thresholds based on cumulative rainfall and daily rainfall.
Echeverri & Valencia (2004) analyzed landslides that occurred in La Iguaná catchment in the city of Medellín during the period ranging from 1980 to 2001. These authors consider as most important parameter the 15 days preceding the rainfall and the previous 3 days, and they found critical rainfall depths of 60 mm for antecedent rainfall for 3 days and 120 mm for preceding 15 days rainfall.
Vélez et al. (2004) developed a distributed, physically based model for shallow landslide, coupling a hydrological model with an infinite slope stability model. The model defines the flow directions according to watershed morphology. These authors recommended using scales of the order of minutes for rainfall and a spatial resolution of 100m2.
Moreno et al. (2006) studied the relationship between rainfall and landslides in the region of Antioquia from the period of 1929 to 1999, and they proposed thresholds as well as regions according to rainfall records of the previous 15 and 3 days. They presented these results as a first approach in order to establish an early warning
Chapter 1: Statement of the issues
---
8
system for critical areas in Antioquia. These authors highlighted the need to refine the methodology based on real time rainfall data and the need to integrate geomorphologic, hydrologic, geological and anthropic factors.
Aristizábal & Gómez (2007) compared the Aburrá Valley disaster database with the rainy seasons in the period of 1880 to 2007, finding a close relationship between precipitation and landslide occurrence, with a bimodal seasonal cycle with maxima during May and October, and minima during January and July (Figure 1.1).
Figure 1.1 Average seasonal cycle of distribution of landslide occurrence in the period 1880 - 2007 (blue bars) versus average monthly precipitation for the Aburrá Valley (black line) (Hormaza, 1991; Saldarriaga, 2003; Aristizábal & Gómez, 2007).
Suárez (2008) analyzed historical records until 2005 for the city of Bucaramanga and proposed landslide alert levels using a decision tree, from which critical thresholds were obtained such as an accumulated rainfall of 150 mm for 15 days, 55 mm rainfall record of 24 hours and magnitudes of 120 mm for a single event.
Aristizábal et al. (2011) analyzed critical rainfall thresholds for landslides forecasting in the Aburrá Valley by means of an empirical procedure, using a database of landslides and precipitation. The results show that the major determinant for the occurrence of landslides in the Aburrá Valley is the antecedent rainfall. Data indicate that landslides used in the analysis occurred for antecedent rainfall over 60 mm for 30 days, 160 mm for 60 days and 200 mm for 90 days.
SHIA_Landslide ---
9
1.2 The need of a landslide early warning system for the Aburrá Valley - Colombia
The Aburrá Valley, with an area of 1,326 km2 and a length of 65 km, is located in the northern region of the Central Cordillera of the Colombian Andes. Its approximate geographical coordinates are between latitudes 6° 00” N and 6° 30” N and longitudes 75 ° 15” W and 75 ° 45” W (Figure 1.2). The climatic conditions of the valley are typical of tropical environments, with an average temperature of 22 ° C and relative humidity of 70%. Precipitation has a bimodal distribution, with rainfall peaks during May and October. The mean annual rainfall varies from 1,400 mm in the valley’s central part and 2,700 mm in its north and south regions.
Figure 1.2 Location of the Aburrá Valley. Red color represents urban development.
The Aburrá Valley has an estimated population of 3.3 million inhabitants, where 95% corresponds to its urban population located in only 26% of the territory (340 km2 of
Chapter 1: Statement of the issues
---
10
(372 K), and Itagüí (230 K), concentrate much of their population over the valley slopes (DANE, 2005). Such population growth has been extremely fast, as in a century the valley's population has multiplied by 30; from 103,305 people in 1905, the population increased to 3'317,166 in 2005. Since 1950, thousands of immigrants have occupied areas exposed to natural disaster, and even areas that had been impacted by major events.
1.3 Hazard and vulnerability in the Aburrá Valley
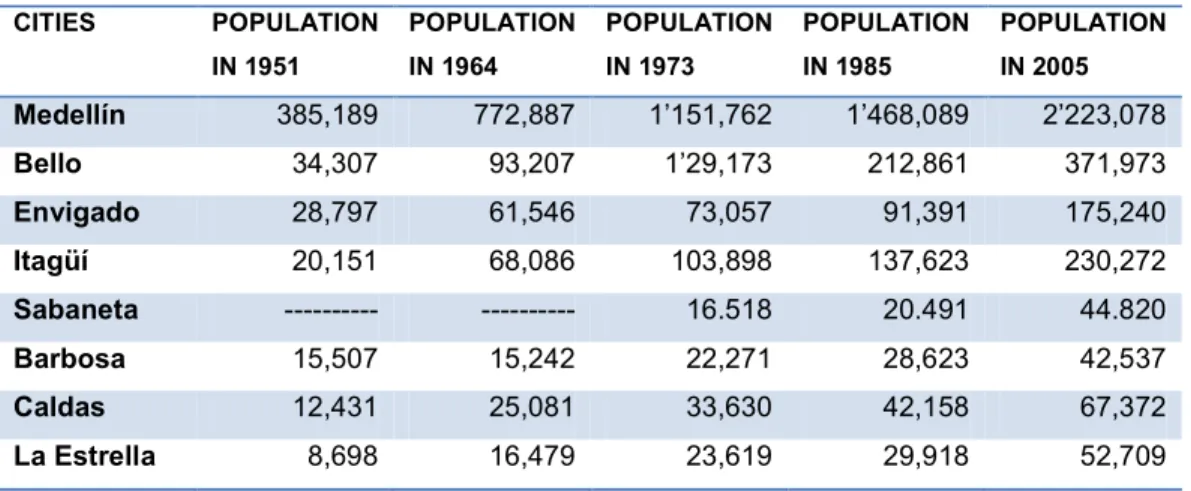
The Aburrá Valley has been impacted by a large number of disasters, most of them with a magnitude ranging from small (<10 deaths) to moderate (10 – 100 deaths). According to Aristizábal & Gomez (2007), during the period of 1889 – 2007, 6750 disasters were registered. From this period, 42% of the total events correspond to floods, 35% to landslides, and 15% to forest fires. These three types of natural phenomena account for 92% of all disasters. It means that from 10 disasters that occurred in the Aburrá Valley, 8 are due to floods or landslides, reflecting the close relationship between natural disasters and the hydrometeorological conditions of the valley. It is clear that rainfall events combined with antecedent moisture conditions are driving forces triggering most disasters in Aburrá Valley. However, in the last two decades the recurrences of disasters have increased, as well as human exposure to risk.
Table 1.1 Population and population growth in the Aburrá Valley (Data from DANE, 2005).
CITIES POPULATION IN 1951 POPULATION IN 1964 POPULATION IN 1973 POPULATION IN 1985 POPULATION IN 2005 Medellín 385,189 772,887 1’151,762 1’468,089 2’223,078 Bello 34,307 93,207 1’29,173 212,861 371,973 Envigado 28,797 61,546 73,057 91,391 175,240 Itagüí 20,151 68,086 103,898 137,623 230,272 Sabaneta --- --- 16.518 20.491 44.820 Barbosa 15,507 15,242 22,271 28,623 42,537 Caldas 12,431 25,081 33,630 42,158 67,372 La Estrella 8,698 16,479 23,619 29,918 52,709
SHIA_Landslide --- 11 Girardota 10,956 12,729 17,879 23,684 42,744 Copacabana 10,720 19,403 29,997 40,309 61,421 TOTAL 526,756 1’084,660 1’601,804 2’095,147 3’317,166
These geological and hydrological hazards, associated to the origin and evolution of the valley, have been recurrent (Aristizábal et al., 2005). However, in the last five decades, the hazard dynamics have changed due to the human occupation on the valleys slopes and flooding plains, causing hundreds of deaths and millions in economic losses. The most populated cities in the valley are the most affected, Medellín with 72% of disasters, followed by Itagüí (5.4%), Envigado (4.9%), and Bello (4.8%). The city located inside the valley with the lowest number of disasters recorded is Barbosa with only 1.2% of the total.
According to Aristizábal et al. (2005) disasters generated by floods are concentrated in Medellín (74%), followed by Itagüí (8.5%), Bello (5.5%) and Envigado (4%). Regarding landslides, 82.4% of them occurred in Medellín, followed by Caldas (3.6%), and Girardota (3%).
Nine moderate disasters with fatalities ranging from 11 to 100 have been recorded in the Aburrá Valley, as well as two events classified as major disasters, with more than 100 deaths, which correspond to (i) the Media Luna landslide that occurred on July 12, 1954 with an outcome of more than 100 people dead, from which 77 had their bodies found and an undetermined number were missing of approximately 70 people, and (ii) Villatina landslide on September 27, 1989, although it has never been possible to determine the exact number of victims, a number of approximately 500 people is considered for this matter, where only about 200 bodies were rescued.
Landslides verified in the Aburrá Valley are mainly soils slips and debris/mud flows (Table 1.2). Some of the most memorable landslides due to their great impact are:
Chapter 1: Statement of the issues
---
12
Rosellon (1927), Media Luna (1954), Santo Domingo Savio (1974), Villatina (1987), La Cruz (2007), El Socorro (2008), El Poblado (2008), and La Gabriela (2010).
1.4 Risk condition of the Aburrá Valley
The Aburrá Valley still lacks rigorous databases related specifically to the assessment of damages and economical losses by disasters. According to partial results shown by Aristizábal & Gomez (2007) using a disaster database named DesInventar and developed by LA RED (La Red de Estudios Sociales en Prevención de Desastres en America Latina), the disasters recorded have left a tragic toll of 1,390 deaths during the last century, most fatalities generated by landslides (74%) and flash floods (13%). Although floods are the most recurrent disaster, they represent only 5% of the total fatalities. The number of homes impacted is mainly associated to flooding (53%), followed by landslides (33%), and the highest proportion of people impacted is in the city of La Estrella, which is 41% followed by Medellín with 28%.
Table 1.2 Main landslides occurred in the Aburrá Valley (Hormaza, 1991; Saldarriaga, 2003; Aristizábal & Yokota, 2006). Landslides in 1954, 1974, 1987, and 2010 have been the most deadly disasters.
PLACE DATE LANDSLIDE TYPE DEATHS
Rosellón (Envigado) 18 June 1927 Mudflow 22
Media Luna (Santa Elena) 12 July 1954 Mudflow >100 La Manguala (S.A. Prado) 25 June 1973 Debris slide 13 Santa Domingo (Medellín) 29 September 1974 Mudflow >70
Medellín 4 February 1975 Landslide 18
San Antonio (Medellín) 20 October 1980 Debris flow >18 Santa Maria (Itagüí) 23 November 1984 Debris slide 10 Villatina (Medellín) 27 September 1987 Mudflow >500 El Socorro (Medellín) 31 May 2008 Complex rotational slide 27 El Poblado (Medellín) 16 November 2008 Complex rotational slide 12 La Gabriela (Bello) 5 December 2010 Complex rotational slide -
debris flow
84
Landslides alone are responsible for 1,030 fatalities and huge economic losses. Aristizábal & Gómez (2007) reached a figure of a minimum value of US$10 million for the period concerning 1880 to 2007 and using just the information.
SHIA_Landslide ---
13
In regards to Medellín, a total of 29,174 households are located in areas of high risk, equivalent to 112,697 people or 4.9% of the total households of the municipality. For the rest of the Aburrá Valley, recent studies have showed that there are 16,847 homes in high risk areas, which corresponds to 62,057 inhabitants (UNal, 2009). These data, together with the results obtained in Medellín in 2005, reveal a total of 174,384 people located in high risk areas, which is equivalent to 5.1% of the total population (Table 1.3).
Table 1.3 Homes and population located in high risk areas (UNal, 2009). 5% of Aburrá Valley inhabitants are located on high risk areas.
MUNICIPALITIES HIGH RISK POPULATION HIGH RISKHOMES
Medellín 112,697 29,174 Barbosa 3,646 961 Bello 21,391 5,381 Caldas 2,357 614 Copacabana 4,345 1,172 Envigado 6,856 2,260 Girardota 457 123 Itagüí 17,954 4,942 La Estrella 4,489 1,199 Sabaneta 562 195 TOTAL 174,754 46,021
1.5 The target area for the implementation of the model
Considering spatial extension, human intervention and the lack of reliable landslide database concerning the Aburrá Valley, a detailed search of landslide databases related to watersheds in tropical and mountainous terrains was carried out. Only two landslide cluster events were found in the literature referring to the Antioquia region: La Arenosa, in September 1990, and Tarazá, in 2007. However, only the La Arenosa case was devoted the attention of several detailed studies and an undergraduate thesis, in which a partial landslide inventory was made.
According to these elements, the La Arenosa catchment was selected for the implementation of the model. La Arenosa is located 160 km to the east of the Aburrá
Chapter 1: Statement of the issues
---
14
Valley, on the southeaster side of the Central Cordillera in the Antioquia region. The catchment is part of the upper San Carlos River Basins, and it is formed by the confluence of the La Arenosa and Betulia rivers, with an extension of 9.91 km2 (Figure
1.3).
Elevation ranges between 1,000 m and 1,900 m a.s.l. The basin is highly dissected with hillslope lengths at the order of 40-60 m.
Figure 1.3 Location of the La Arenosa catchment, in the southeastern side of the humid tropical and complex terrains of Central Andean Cordillera in Colombia.
The area has a tropical humid climate with a mean annual precipitation of 4,300 mm and a mean annual temperature of 23° (IGAC, 2007a). The precipitation regime is dominated by high variability at both interannual and interseasonal scales (Figure 1.5). Monthly rainfall distributions reveal an evident seasonal pattern, with a clear difference between the rainy season that extends from September to November, and from March to May, and the dry season with a minimum of rainfall level in July.
SHIA_Landslide ---
15
Figure 1.4 shows the general topography and the distribution of slope gradients in the Territory. Most of the land area has slope angles ranging from 20 to 40 degrees.
Figure 1.4 General topography of the La Arenosa catchment. The basin is highly dissected with steep hillslopes.
Figure 1.5 The average monthly accumulation of rainfall is characterized by a bimodal distribution, with maximum peaks in May and October (average monthly precipitation in millimeters) (Mejía & Velásquez, 1991).
Granitic sandy residual soil covers the hillslopes, except for narrow ridges or steep slip scars with bedrock exposures. The majority of the study area is covered with crops and pasture.
The geology of the study area consists of residual soils from granodiorite rocks covered in the gently sloping areas with slopes and fluviotorrential deposits, with a depth ranging from 3 m to 20m. Its dominant, granitic component is grey and medium to
Chapter 1: Statement of the issues
---
16
coarse-grained, and consists of cream or pale yellow feldspar, smoky quartz and smaller proportions of reddish-brown biotite and dark hornblend.
These rocks have been severely weathered in situ. The progressive spheroidal decomposition of the granite has been rapid and extensive, with an average weathering depth of 30 m and is primarily due to chemical decomposition under the humid tropical climate (Mejía & Velásquez, 1991).
The saprolite is fairly well graded, being sandy silt to silty sand in texture with some gravel and small amount of clay. Relict joints of the parent rock are preserved in the saprolite zone, and can significantly alter the observed hydraulic conductivities of the surrounding soil matrix (INTEGRAL, 1990).
The deposits are matrix supported and formed by granitic boulders and residual soils and vegetation debris. About 15% of the land area of the territory is covered with colluvium. Colluvium generally accumulates at footslopes or in gullies at upper levels. These deposits have resulted from landslide which took place in the geological past and are usually poorly consolidated with high cobble-boulder content, and abundant natural soil pipes (Mejía & Velásquez, 1991).
1.6 The September 21, 1990 rainstorm in the La Arenosa catchment
A short duration, high intensity rainfall event impacted the basin of La Arenosa on 21 September 1990. In less than 3 hours a precipitation of 208 mm fell within the study area, triggering many landslides (Figure 1.6). The September 21, 1990 event is unique considering the huge number of failures that took place (Figure 1.7).
During this event, the population was strongly affected, 20 people were killed and 260 had to be evacuated, 27 houses were destroyed and 30 others were damaged, several bridges and more than 100 m of highway were ruined. The Calderas Hydropower Energy Plant was flooded and severely damaged by large blocks carried by La
SHIA_Landslide ---
17
Arenosa stream (Figure 1.8). Total losses were estimated at more than US $ 6 million (Hermelin et al., 1992).
Figure 1.6 Hourly rainfall histogram of the September 21, 1990 rainstorm. In less than 3 hours a precipitation of 208 mm fell within the study area, triggering 808 landslides in La Arenosa catchment (Mejía & Velásquez, 1991).
Prolonged low-intensity precipitation characterized the two preceding months with approximately 621 mm of rain. The statistical analysis of historical rainfall carried out by Mejía & Velásquez (1991) indicated that the event was exceptional, according to the rain gauge of San Carlos, with a return period of 200 years.
Figure 1.7 General view of the La Arenosa upper catchment with distribution of shallow landslide triggered by rainfall in the September 21, 1990 rainstorm (Taken from Mejía & Velásquez, 1991).
Chapter 1: Statement of the issues
---
18
Figure 1.8 Landslides material removed from the upper catchment slopes was later carried away by runoff producing torrential floods that destroyed 27 houses (left picture) and severe damaged to the Calderas Hydroelectric Plant of ISAGEN (right picture) (Taken from Mejía & Velásquez, 1991).
The analysis of post event aerial photos and field investigations allowed performing a partial reconstruction of the pattern and characteristics of the landslides in the La Arenosa catchment. INTEGRAL (1990) and Mejía & Velásquez (1991) offer a detailed landslide inventory and a comprehensive description of the landslides triggered during the event, which was obtained through the analysis of post event aerial photos, field investigation and an exhaustive survey. According to the INTEGRAL’s report (1990), aerial photographs and topographic maps of the entire catchment were not available, reason why it was not possible to properly determine the total number of landslides. Although the landslide inventory and description consider the whole catchment, landslide inventory maps cover only about 70% of the catchment.
Mejía & Velásquez (1991) reported 838 soil slips in the entire upper basin for the San Carlos river, and most of them transformed into debris flows. For the La Arenosa catchment, 699 landslides were reported; all classified as soil slips and mud/debris flows, from very to extremely rapid, with high water content.
Figure 1.9 maps the locations of landslides observed in the field. The occurrence of these landslides was triggered by the rainstorm.
SHIA_Landslide ---
19
Figure 1.9 Landslides scars produced by the September 21, 1990 rainstorm. Read lines shows the landslide scars according to landslide database elaborated by Mejía & Velásquez (1991) and INTEGRAL (1991).
The landslides commenced as shallow translational slides. After the initial mobilization, a rapid displacement occurred in a chaotic mixture, containing a variable amount of water and scouring the residual soil and vegetation downward, incorporating soil and bedrock fragments. The movement evolved along the slopes under a quasi-viscous flow in high speed, increasing the sediment transport for superficial erosion along the channels.
The landslide bodies were small with respect to the flow length and slip surface, parallel to the slope surface. Field studies showed that the depth of failure surface was around 0.6 – 1.5 m. and corresponded to contact residual soil – saprolite (Figure 1.10). In all cases observed, the failure surface matches the contact area of the residual soil
Chapter 1: Statement of the issues
---
20
with underlying saprolite. The majority of landslides were initiated within residual soils in hollows and open slopes with slope steepness ranging from 35° to 42° (Mejía & Velásquez, 1991).
Figure 1.10 Detailed photo of shallow landslides that were triggered by the September 21, 1900 rainfall at the La Arenosa catchment (taken from Mejía & Velásquez, 1991).
Chapter 2
FORMULATION OF THE PROBLEM
2.1. Objective
To develop and evaluate a model for predicting landslides triggered by rainfall in tropical mountainous environments based on physical principles.
2.2. Specific objectives
1. To propose a conceptual and mathematical model that responds to the physical process involved in shallow landslides triggered by rainfall in tropical mountainous environments.
2. Based on the conceptual model, to develop a computational model supported by hydrological and geotechnical aspects for the prediction of shallow landslide triggered by rainfall in tropical mountainous terrains.
Chapter 2: Formulation of the problem
---
22
3. To calibrate, validate and evaluate model performance and coherency by means of computer simulations, comparing the model result with a real case in the Colombian Andes.
2.3. Working hypothesis
Landslide occurrence results of a highly complex nonlinear system; however, it is possible to fit a simplified model with acceptable confidence levels according to the degree of understanding reached on the variables and parameters.
Landslide occurrence is a function of rainfall infiltration as a triggering factor for slopes rendered susceptible as a result of many other important variables. This function is complex, and it is based on shear strength reduction by pore pressure increasing or suction reduction. However, considering that saturated conditions prevail during rainfall, the model only will simulate shallow landslide triggered under saturated conditions.
A physically-based model of rain-triggered landslides can be adjusted for complexity based on scale and assumptions that adequately characterize the spatial variability of both the geotechnical and hydrological conditions and mechanisms.
2.4. Research questions and hypothesis testing
Numerous research questions could be tested through the computational model in order to ensure the accuracy and coherency of the model by using a real case in the tropical mountainous terrains of Colombia. Some of those research questions to be analyzed are:
How do hydrologic processes influence the location, timing, and rates of landslides? How can this new model achieve high predictive capacity without overestimating the landslide hazard areas?
SHIA_Landslide ---
23
What are the most important variables that contribute to shallow landslides triggered by rainfall in tropical and mountainous terrains?
How is the topography representative of the geomorphology and a fundamental element which controls both shallow subsurface flow and reflects areas of positive pore pressure build-up?
How does rainfall accumulation and antecedent soil moisture play an important role in landslide occurrence for tropical mountainous terrains?
How can a hydrologically and geotechnically coupled model be optimized so that it can become the foundation of an early warning system?
2.5. Scope
Shallow landslides triggered by rainfall in tropical environments under saturated conditions generally present irregular fault surface but planar trend, and can be classified into soil-slip or shallow translational slides rapidly changing to debris or mud flows. The analysis of this project will not include deep landslides with complex surface fault or displacement behavior after slope failure, but instead focus on predicting slope failure. Simulating landslide displacement behavior is another key element to hazard and risk assessment, which involves a detail analysis of rheology, although out of the scope of this study.
The project aims to understand, explain and model the simplest process involved on landslide occurrence, which essentially considers natural terrain conditions, but no external factors such as human disturbances will be incorporated into the analysis. We acknowledge the high degree of human intervention in most terrains plays a crucial role in increasing the number of landslide occurrences over time.
The project is designed to perform a process of calibration, validation, and performance evaluation in the La Arenosa catchment. Although there are some limitations regarding spatial variability of the geotechnical and hydrological parameters of the soil, and
Chapter 2: Formulation of the problem
---
24
limitations with an incomplete landslide inventory, the information available is considered enough for the purpose of the model
The model developed is expected to be incorporated into an early warning system. However, the scope of this research project has the sole intent of developing the model and proposing a conceptual development of the early warning system. The implementation of the model in the Aburrá Valley and the creation of a detailed early warning system are beyond the scope of this research.
Chapter 3
RAINFALL – INDUCED SHALLOW LANDSLIDES
Generally, landslides result from various elements, in locations where the configuration and morphological evolution of slopes play a critical role (Brunsden, 2002; Griffiths et al., 2002; Hutchinson, 1995). The simplest widely accepted definition is given by Cruden (1991), who defines the term as the movement of a mass of rock, debris or earth along a hillside. According to this definition, there are a variety of landslides. Some are slow, small and imperceptible, while others involve large volumes of material and reach high speeds with great destructive power (GEMMA, 2007). The classification of landslides widely known and formally accepted is proposed by Varnes (1978) and updated by Cruden & Varnes (1996). These authors use the type of movement and type of material as the main criterion for classification. The types of mass movements are: falls, toppling, slides, flows, and lateral spread. A great complexity of movements may arise from the combination of these simple criteria.
Chapter 3: Rainfall-induced shallow landslides
---
26
Landslides are product of the progressive weakening of the mechanical properties of slope materials by means of natural processes such as weathering, uplifting, and human activities that trigger slow and usually imperceptible landslides (Costa & Baker, 1981; Soeters & van Westen, 1996). Nevertheless, a single factor, usually an intense rainfall event or an earthquake, is considered an external stimulus that can generate an almost immediate response to mobilize slope materials, either by a rapid increase of stresses or by reducing shear strength (Wang & Sassa, 2006).
The factors controlling the occurrence and distribution of landslides can be divided into two categories: quasi-static variables or dynamic variables. The quasi-static variables such as soil properties and topography contribute to slope susceptibility and define the spatial distribution of landslides (Figure 3.1). Meanwhile, dynamic variables such as rainfall and degree of saturation control the triggering factors on landslide-prone-slopes, and characterize landslide temporal patterns (Crosta & Frattini, 2003).
Figure 3.1 Factors controlling the occurrence and distribution of landslide in the hillslope system.
3.1. Characteristics and mechanisms of shallow landslides triggered by rainfall
Shallow landslides triggered by rainfall, which are usually called soil slips, have a planar slip surface. They are characterized by their shallow thickness (0.3 - 2 m), much smaller than their flow length, as well as by the slip of surface fault parallel to the slope and escarpment small area (Anderson & Sitar 1995). These movements are generated
SHIA_Landslide ---
27
during intense rainfall events by the rapid increase in pore pressure or by the loss of apparent cohesion component (Wang & Sassa, 2003; Terlien, 1998; Crosta, 1998; Crosta & Frattini, 2003). Subsequently, the displaced material, by means of processes of static liquefaction and rapid reduction of shear strength in undrained conditions (Anderson & Sitar, 1995), becomes a flow that spreads down, transporting sediment eroded from the channel and increasing the initial displaced volume of the material (Wang & Sassa, 2003; Wieczorek & Guzzetti, 2000). Some authors describe the initiation of the movement and its mobilization as simultaneous and not distinguishable (Eckersley, 1990; Anderson & Sitar, 1995).
For unsaturated soils, Li et al. (2005) describe this process as a result of infiltration of rainfall, which reduces soil matrix suction: such reduction, in its turn, reduces soil shear strength. Once the soil is completely saturated, the suction disappears and the water table develops positive pore pressure. As a consequence, this positive pore pressure reduces shear strength and increases slope instability.
Gostelow (1991) and Iiritano et al. (1998) affirm that rainfall can act in two different ways on slope stability: (1) very intense rainfall events that cause a reduction of shear strength by reducing the cohesion and generating shallow landslides, and (2) rainfall events that cause long-term increase in pore pressure over an area of potential failure, generating much deeper landslides and often along pre-existing shear surfaces. Shallow landslides are usually triggered by short, intense rainfall (Crosta, 1998), while deeper landslides are more related to rainfall distribution and variation throughout long periods (Aleotti, 2004).
Collins & Znidarcic (2004) propose two different failure mechanisms generated by infiltration. In the first mechanism, failure occurs due to positive pore pressure increase caused by static liquefaction of the material, while the second failure mechanism occurs in negative pore pressures where the material is still in an unsaturated state, failure takes place due to reduced suction and mass behaves like a rigid body. In