Strathprints Institutional Repository
Mohamed, Mohamed and Elatriby, Sherif and Shi, Zhusheng and Lin, Jianguo (2016) Prediction of forming limit diagram for AA5754 using artificial neural network modelling. Key Engineering Materials, 716. pp. 770-778. ISSN 1013-9826 ,
http://dx.doi.org/10.4028/www.scientific.net/KEM.716.770
This version is available at http://strathprints.strath.ac.uk/58218/
Strathprints is designed to allow users to access the research output of the University of Strathclyde. Unless otherwise explicitly stated on the manuscript, Copyright © and Moral Rights for the papers on this site are retained by the individual authors and/or other copyright owners. Please check the manuscript for details of any other licences that may have been applied. You may not engage in further distribution of the material for any profitmaking activities or any commercial gain. You may freely distribute both the url (http://strathprints.strath.ac.uk/) and the content of this paper for research or private study, educational, or not-for-profit purposes without prior permission or charge.
Any correspondence concerning this service should be sent to Strathprints administrator:
Prediction of Forming Limit Diagram for AA5754 using Artificial Neural
Network Modelling
Mohamed Mohamed*
1,3, Sherif Elatriby
2,3, Zhusheng Shi
4, and Jianguo Lin
41Advanced Forming Research Centre (AFRC), Strathclyde University, Glashow, UK 2School of Mechanical and Systems Engineering Department, Newcastle University, UK 3Mechanical Engineering Department, Faculty of Engineering, Helwan University, Egypt 4Department of Mechanical Engineering, Imperial College London, London SW7 2AZ, UK
aMohamed.Mohamed@strath.ac.uk, belatribysherif@h-eng.helwan.edu.eg, cZhusheng.Shi@imperial.ac.uk, dJianguo.Lin@imperial.ac.uk
Keywords: Aluminium alloys, Warm forming, Forming limit diagram (FLD), artificial neural network
(ANN)
Abstract. Warm stamping techniques have been employed to solve the formability problem in forming aluminium alloy panels. The formability of sheet metal is a crucial measure of its ability for forming complex-shaped panel components and is often evaluated by forming limit diagram (FLD). Although the forming limit is a simple tool to predict the formability of material, determining FLD experimentally at warm/hot forming condition is quite difficult. This paper presents the artificial neural network (ANN) modelling process to predict FLDs based on some experimental results (different temperature, 20°C-300°C and different forming rates, 5-300 mm.s-1). It is shown that the ANN can be trained to predict the FLDs and there is a good agreement between experimental and neural network results
Introduction
In recent years, there has been an increasing trend for using lightweight materials, such as aluminum alloys, particularly for automotive applications. Aluminium alloys are a natural choice due to their high strength/weight ratio, and they are being used as replacements for steel in many sheet metal parts [1]. Although aluminium alloys have many advantages compared with steel, their wider application has been hindered partly due to their relatively low formability at room temperature, which results in some difficulties to manufacture complex-shaped components with aluminium alloys.
Warm stamping techniques have been employed to solve the formability problem in forming aluminium alloy panels. The ductility of these alloys increases with increasing temperature and/or deceasing forming rate, thus processes that have these two features will enable complex-shaped aluminium sheet components to be formed [2]. The formability of sheet metal is a crucial measure of its ability for forming complex-shaped panel components and is often evaluated by forming limit diagram (FLD). This diagram can be used to determine the limit to which a sheet metal can be deformed before its failure in particular forming processes. A forming limit diagram (FLD) shows the critical combinations of major and minor strains in a metal sheet at the onset of necking and provides information for a process engineer to optimise process conditions such as material condition, tool features and lubrication. The concept of FLDSs was introduced by Keeler (1965) [3], who developed a principle to establish the relationship between the surface principal strains, e1 and e2, at fracture. The relationship is presented as a curve and if the orthogonal principal strain set, at all positions in a deforming sheet, lies below it a sound product will result and if above, failure will occur. Several factors affect the FLC including sheet thickness, temperature, strain rate and grain size and strain hardening exponent. In a warm stamping process, the metal sheet is normally warm and
the tool is relatively cool. Temperature and strain rate are changed dynamically with both time and location in the sheet metal. In warm forming condition, it is exceptionally challenging to determine the FLD of the material accurately, because there are many variables can influence the formability and failure mode of the material such as friction [4], temperature and strain rate [5]. Forming limits are normally evaluated using cylindrical dome and flat punch drawing processes [6, 7]. Due to the above mentioned variables the failure always occurring at the mid-span of the work-piece for both flat and spherically nosed punches. For many process conditions, deformation is very little at the centre of the work piece. Therefore, determining and prediction of the FLD at different extreme conditions could be achieved by an accurate model and may require complex calculations and expensive advanced computational analyses, which are time consuming. Therefore, the main aim of this work was to develop an ANN model to predict the FLDs for AA5754 at warm forming condition. Some FLD diagrams for these alloys were obtained experimentally at certain cases.
Experimental FLD test
Test-pieces were prepared from commercial alloy AA5754 that has good corrosion resistance, weldability and formability. The material was supplied by Novelis UK Ltd in the form of 400 x 400 x 1.5 mm sheet, in H111 condition. It has a 0.2% proof stress of 121 MPa, a tensile strength of 234 MPa and an elongation (A80) of 25%. The FLC tests were carried out at various temperatures up to 300 °C and forming speeds ranging from 5 – 300 mm/s. The geometry of the test-piece was a circular blank with a central parallel edged waist (Fig. 1a), based on ISO 12004-2:2008 standard. The rolling direction of the material was parallel to the longitudinal axis of the waist. In-situ online measurement systems such as GOM ARAMIS systems are often used to obtain strain distribution and limit strains in the FLCs at room temperature. For tests at elevated temperatures, however, online measurement using such systems is more difficult due to the restriction of access and viewing of the test-piece during forming. For this reason, another optical system, GOM ARGUS was selected for the current study. This system measures strain by comparing the pre-applied regular pattern before and after forming. Fig. 1b shows the selected strain paths for the tests. Further experimental details can be found in [8].
Fig. 1. (a) Blank geometry for Nakajima type tests, and (b) Schematic drawing of FLC test points.
Examples of the isothermal FLC tested specimens are shown in Fig. 2. The numbers at the top of Fig. 2 are the geometry numbers corresponding to those in Fig. 1b, covering strain ratios from pure tensile to equibiaxial conditions. The experimental data for isothermal FLD tests are shown in Fig. 3a and 3b for different temperatures and strain rates.
Fig. 2 Test-pieces of AA5754 formed at a temperature of 250 ˚C and a forming speed of 20 mm/s. A GOM-ARGUS system was used to process the strain profiles. Minor and major strains were obtained by using inverse parabolic fittings as described in ISO 12004-2:2008 standard. By analysing test-pieces with different geometries, data for different strain paths were determined and hence an FLC obtained. Fig. 3a shows refined experimental FLCs for different temperatures at a forming speed
of 75 mm/s, and different forming speeds at a temperature of 250˚C. As shown by the symbols in Fig.
3a, formability increases with increasing temperature as evidenced by the increase of the FLCs along the major strain axis. The increase is more significant at high temperature and much improvement in forming limit is observed from 250˚C to 300˚C. The increase in formability from 250 ˚C to 300˚C is about twice the increase from 200 ˚C to 250 ˚C in the plane strain region. As temperature increases, the V-shape of the FLCs appears to flatten, showing that the effect of the minor strain on formability reduced. As shown by the symbols in Fig. 3b, the forming limit increases with decreasing forming speed, suggesting that the best ductility lies at low speeds for warm forming. It can be seen that when speed decreases from 300 mm/s to 75 mm/s, the forming limit increases slightly. But much more increase is observed from75 mm/s to 20 mm/s.
Fig. 3. Experimental FLDs for (a) different temperatures at a forming speed of 75 mm/s and (b) different forming speeds at a temperature of 250˚C.
Neural network
The artificial neural networks (ANNs) are a powerful estimation tool that can be used in mapping any function whatever the number of variables controls that functions. The main problem associated
0 0.1 0.2 0.3 0.4 0.5 0.6 -0.4 -0.2 0 0.2 0.4 0 0.1 0.2 0.3 0.4 0.5 0.6 -0.4 -0.2 0 0.2 0.4 0.6 Minor Strain M a jo r S tr a in 300°C 250°C 200°C 20°C 20 mm/sec 250 mm/sec 300 mm/sec Minor Strain M a jo r S tr a in
with applying ANN is the limited amount of data that are used in training the network. The more the available data for training the more the accuracy can be achieved from the network estimate. In this case, the training set, that coming from practical experiments, is comparatively limited and should be pre-processed before applying the learning process of the ANN [9]. Such pre-processing aims at formalizing these numeric values in such a way that facilitates the learning process and requires lower degree of complexity of the network just to overcome the shortcoming of low number of training set on hand [10].
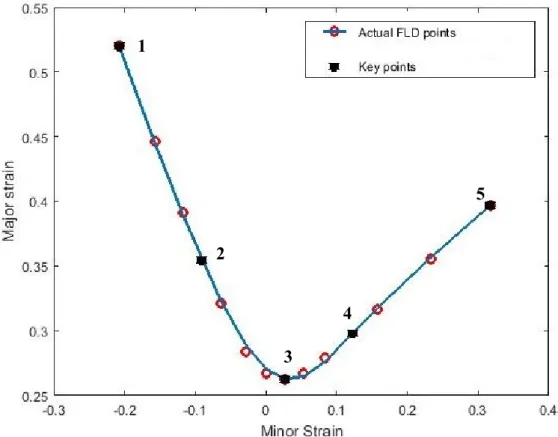
For example, Fig. 4 shows the FLD, one of the experimental data used in training the network, at temperature of 250C and forming rate 75 mm/s. the FLD is fully defined through a set of 12 points that cover the range of both major and minor strains. The typical design of the ANN in this situation is double input multiple output ANN. The inputs are the temperature (in C) and forming rate (in mm/s), while the output is a set of vectors represent the points that control the FLD. The type of ANN used in this paper is the feed forward error back propagation ANN, which are commonly used in mapping all sort of functions. The ANN is designed to estimate the key points that control the FLD to produce the FLD with reasonable value of approximation error.
Fig. 4 shows the main points that control the estimated FLD. Those points are the start point (point number 1), the finish point (point number 5) and the critical point (point number 3). The pre-processing step of the training sets needs extra points to enhance the fitting of FLD, in both ranges between points (1, 3) and points (3, 2), to match the actual ones. Two additional points will be used to describe the nonlinear behaviour of the FLD in both ranges after and before the critical point (3). Fig. 4 illustrates the using of the five key points in geometrical approximation of FLD with the resultant approximated curve with respect to the actual points.
Fig. 4. The main five key points that controlling the FLD
The reduced control points in each training set of the experimental FLD data to only five points will be used in the training process of the networks at max approximation error of 5%. The approximation error is defined by the percentage difference between the experimental and predicted data. The experimental data of FLDs are used to train 4 different ANNs separately to control the five key points that describe the FLD, as shown in Fig. 5. The first network is used to estimate the starting and
1
2
3
4
finishing point of the FLD (points 1 and 5). The second network is used to estimate the critical point at minimum major stain (point 3). The third and fourth networks, are used to estimate the nonlinearity control point before and after the critical point (points 2 and 4).
Fig. 5. The structure of ANNs learning
Fig. 6. Nonlinear deviation before and after the critical point
The estimated non-linearity factors are illustrated in Fig. 6 at the mid-point between point 1 and 3 to estimate the coordinates of point 2, and at the mid-way between 3 and 5 to estimate the coordinates of point 4.
The ANNs were built and trained in the Matlab environment. The calculations performed at each neuron of input and hidden layers are determined by logistic sigmoidal activation function (LOGSIG), while the output layer is linear activation function (PURELIN), as illustrated in Fig. 7. The learning
Non-linearity at point (2) N(2)
Non-linearity at point (4) N(4)
is performed with Levenberg–Marquardt learning algorithm targeting the minimum value of (Mean Square Error) MSE.
Fig. 7. The architecture of the different ANNs used to estimate control points
Fig. 8 shows the four different architecture of ANNs and the output vectors for each. The four ANNs are independent on each other to give higher degree of flexibility in learning and validating the result with the actual FLDs. This independency provides the ability of accurately controlling the estimated FLDs to satisfy the on-hand actual FLDs. Network No.1 (ANN1) is trained to estimate the major and minor strains at both start and end of FLDs that used as training sets. Network No.2 (ANN2) is the reasonable of estimation the both strains of the critical point at minimum major strain at point (3). Networks No. 3 and 4 (ANN3 and ANN4) are trained to estimate the nonlinear compensation before and after the critical point at points 2 and 4.
Fig. 8. The four different ANNs used to estimate control points
Table 1 summarizes the data that used in training the four networks. The total number of the training sets is the five sets that characterise the different process parameters of the experimental FLDs at different temperature and forming rates as inputs to all networks. The outputs of each network at each training set is also presented accordingly.
Table 1. The data of training sets Input T 20 200 250 300 250 250 V 75 75 75 75 300 20 Output ANN1 1(point 1) -0.165 -0.183 -0.208 -0.165 -0.146 -0.211 2(point 1) 0.414 0.453 0.521 0.548 0.417 0.602 1(point 5) 0.319 0.318 0.317 0.308 0.366 0.522 2(point 5) 0.354 0.368 0.396 0.439 0.406 0.580 ANN2 1(point 3) 0.013 0.028 0.013 0.059 0.016 0.021 2(point 3) 0.212 0.229 0.264 0.367 0.245 0.356 ANN3 N(2)(point 2) 0.025 0.036 0.029 0.040 0.026 0.032 ANN4 N(4)(point 4) 0.007 0.002 0.012 0.007 0.008 0.013 Training of ANN
A neural network model enabling to predict FLCs of AA5754 aluminium alloy sheets was developed. The experimental results used to train and build up the ANN are provided in Figs. 3a and 3b. Based on the iterative approach used in ANN, the fitting of the ANN FLCs with experimental FLCs is an excellent result as shown in Figs. 8a and 8b. These results proved that the ANN is trained successfully and provides a robust tool which will be able to predict the FLCs at different combination of temperatures and strain rates which are out of the defined boundaries for training data used in the ANN.
Fig. 9. Comaprison of the predcited tarined ANN (solid Lines) and Experimental FLC data (symbols) for (a) different temperatures at a forming speed of 75 mm/s and (b) different forming
speeds at a temperature of 250˚C. Predicted ANN FLDs
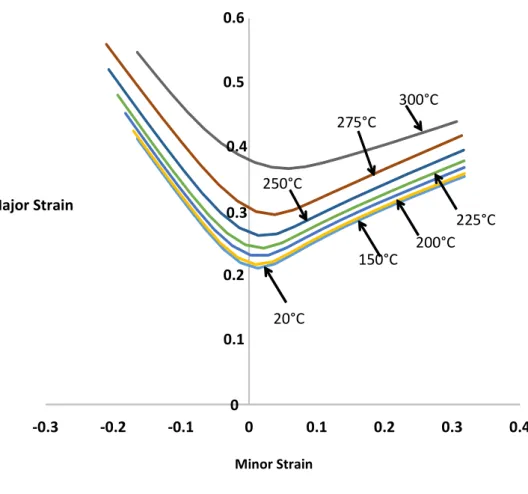
After the network has been tarined using the avialable experimental data shown in Figs. 3a and 3b, the ANN is introduced to predict FLCs. The ANN is used to predict the FLCs at different temperatures (150°C, 225°C and 275°C) which are not used for training the ANN as shown in Fig. 10. From this figure, it is found that there is a good correlation between the predicted values of the optimum neural
0 0.1 0.2 0.3 0.4 0.5 0.6 0.7 0.8 -0.4 -0.2 0 0.2 0.4 0.6 0 0.1 0.2 0.3 0.4 0.5 0.6 -0.4 -0.2 0 0.2 0.4 20 mm/s 75 mm/s 300 mm/s 300°C 250°C 200°C 20°C Minor Strain M a jo r S tr a in Minor Strain M a jo r S tr a in
network model of these data and the trained data shown in Fig. 9a for AA5754 aluminum alloy. By comparison of the formability level at different temperatres, it is noticed that the predicted FLCs at all temperatres are in a reasonable feature as shown in Fig. 10.
Fig. 10. Predicted ANN FLDs for AA5754 at different temperatures and forming rate of 75 mm/s. Conclusions
This paper presents the artificial neural network (ANN) modelling for predicting FLCs at different temperatures (20 - 300°C) and different forming rates (20 - 300 mm/s). The outcome of this research is encouraging. The neural network model is built up and trained fairly well. According to comparisons, there is a good agreement between experimental and neural network results. It correctly predicted the FLCs and it shows the effectiveness of the neural network technique to comprehend and solve complex problems. This technique can also be viewed as a tool to precict extreme virtual experimental cases whereby the effect of various variables can be assessed, which is physically just not possible.
References
[1] J. Polmear, Light Alloys-Metallurgy of the Light Metals, 3rd, London, (1995), pp.337-342. [2] M. Mohamed, Solution heat treatment in HFQ process, Steel Research International, 79-11-VII, (2008)160-167.
[3] P.S. Keeler, Determination of forming limits in automotive stampings, Sheet Met., 42 (1965) 683– 91. 0 0.1 0.2 0.3 0.4 0.5 0.6 -0.3 -0.2 -0.1 0 0.1 0.2 0.3 0.4 Minor Strain 300°C 275°C 250°C 225°C 200°C 150°C 20°C Major Strain
[4] Abspoel, M. Atzema, E. H. Droog, J. M. M. Khandeparkar, T. Scholting, M. E. Schouten, F. J. Vegter, H. ‘Inherent influence of strain path in Nakazima FLC tests’, Proceedings of the 8th IDDRG Conference, Mumbai, India, (2011) 1-9.
[5] Goodwin, G. M., Application of strain analysis to sheet metal forming problems in the press shop’, Metall, Italiana, 60 (1968) 764–74.
[6] Z. Marciniak, K. Kaczynski, K. T. Pokora, Influence of the plastic properties of a material on the forming limit diagram for sheet metal in tension, International Journal Mechanical Science, 15 (1973) 789–805.
[7] K. Nakazima, T. Kikuma, K. Asaku, Study on the formability of steel sheet, Yawata Technical Report 264, (1968).
[8] Z. Shi, Y. Wang, J. Lin, T. Dean, D. Balint, M. Stanton and D. Watson, An investigation, using standard experimental techniques, to determine FLCs at elevated temperature for aluminium alloys, in S.J. Yuan et al. (eds), Proceedings of the 3rd International Conference on New Forming Technology (ICNFT2012), Harbin, China, (2012) 100-104.
[9] A. Derogar and F. Djavanroodi, Artificial Neural Network Modeling of Forming Limit Diagram, Materials and Manufacturing Processes, 26:11 (2011) 1415-1422.
[10] N. Kotkunde, A. Deole, A. Kumar Gupta, Prediction of Forming Limit Diagram for Ti-6Al-4V Alloy Using Artificial Neural Network, Procedia Materials Science 6 ( 2014 ) 341 – 346.