from VHR Satellite Imagery using Deep
Learning Techniques
Dissertation zur Erlangung
des Doktorgrades der Naturwissenschaften (Dr. rer. nat.) des Fachbereichs Mathematik / Informatik
der Universität Osnabrück
Vorgelegt von
Ksenia Bittner
Prüfer der Dissertation:
Prof. Dr. Peter Reinartz, Universität Osnabrück
Prof. Dr. techn. Friedrich Fraundorfer, Technische Universität Graz, Österreich
B
uilding information extraction and reconstruction from satellite images is anessential task for many applications related to 3D city modeling, planning, dis-aster management, navigation, and decision-making. Building information can be obtained and interpreted from several data, like terrestrial measurements, airplane surveys, and space-borne imagery. However, the latter acquisition method outperforms the others in terms of cost and worldwide coverage: Space-borne platforms can provide imagery of remote places, which are inaccessible to other missions, at any time. Be-cause the manual interpretation of high-resolution satellite image is tedious and time consuming, its automatic analysis continues to be an intense field of research. At times however, it is difficult to understand complex scenes with dense placement of buildings, where parts of buildings may be occluded by vegetation or other surrounding construc-tions, making their extraction or reconstruction even more difficult. Incorporation of several data sources representing different modalities may facilitate the problem. The goal of this dissertation is to integrate multiple high-resolution remote sensing data sources for automatic satellite imagery interpretation with emphasis on building infor-mation extraction and refinement, which challenges are addressed in the following:Building footprint extractionfrom Very High-Resolution (VHR)satellite images is an
important but highly challenging task, due to the large diversity of building appearances and relatively low spatial resolution of satellite data compared to airborne data. Many algorithms are built on spectral-based or appearance-based criteria from single or fused data sources, to perform the building footprint extraction. The input features for these algorithms are usually manually extracted, which limits their accuracy. Based on the advantages of recently developed Fully Convolutional Networks (FCNs), i.e., the
auto-matic extraction of relevant features and dense classification of images, an end-to-end
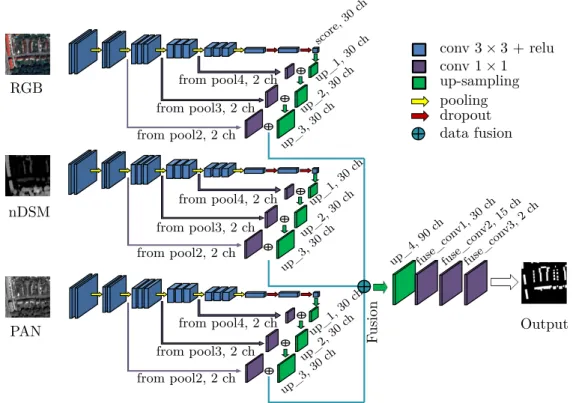
framework is proposed which effectively combines the spectral and height information fromred, green, and blue (RGB),pan-chromatic (PAN), andnormalized Digital Surface Model (nDSM)image data and automatically generates a full resolution binary building
mask. The proposed architecture consists of three parallel networks merged at a late stage, which helps in propagating fine detailed information from earlier layers to higher levels, in order to produce an output with high-quality building outlines. The perfor-mance of the model is examined on new unseen data to demonstrate its generalization
capacity.
The availability ofdetailed Digital Surface Models (DSMs)generated by dense
match-ing and representmatch-ing the elevation surface of the Earth can improve the analysis and interpretation of complex urban scenarios. The generation of DSMs from VHR opti-cal stereo satellite imagery leads to high-resolution DSMs which often suffer from mis-matches, missing values, or blunders, resulting in coarse building shape representation. To overcome these problems, a methodology based onconditional Generative Adversarial Network (cGAN)is developed for generating a good-qualityLevel of Detail (LoD)2 like
DSM with enhanced 3D object shapes directly from the low-quality photogrammetric half-meter resolution satellite DSM input.
Various deep learning applications benefit from multi-task learning with multiple
re-gression and classification objectives by taking advantage of the similarities between individual tasks. Therefore, an observation of such influences for important remote sensing applications such as realistic elevation model generation and roof type classifi-cation from stereo half-meter resolution satellite DSMs, is demonstrated in this work. Recently published deep learning architectures for both tasks are investigated and a new end-to-end cGAN-based network is developed, which combines different models that provide the best results for their individual tasks.
To benefit from information provided by multiple data sources, a different
cGAN-based work-flow is proposed where the generative part consists of two encoders and a common decoder which blends the intensity and height information within one network for the DSM refinement task. The inputs to the introduced network are single-channel photogrammetric DSMs with continuous values and pan-chromatic half-meter resolu-tion satellite images. Informaresolu-tion fusion from different modalities helps in propagating fine details, completes inaccurate or missing 3D information about building forms, and improves the building boundaries, making them more rectilinear.
Lastly, additional comparison between the proposed methodologies for DSM enhance-ments is made to discuss and verify the most beneficial work-flow and applicability of the resulting DSMs for different remote sensing approaches.
Die Extraktion von Gebäudeinformationen und die Rekonstruktion von Gebäuden aus Bilddaten ist ein zentraler Arbeitsschritt zahlreicher Anwendungen im Bereich der 3D Stadtmodellierung und -planung, Katastrophenmanagement, Navigation und Entschei-dungsfindung. Diese Gebäudeinformationen können aus Daten unterschiedlicher Art gewonnen werden, darunter Landvermessungsdaten, Luftbilder oder hochaufgelöste (VHR) satellitengestützte Erdbeobachtung. Letztere übertrifft jedoch die anderen Meth-oden der Datenerhebung in Bezug auf Kosten und weltweite Flächenabdeckung: Satel-litenplattformen können zu jeder Zeit Daten auch an solchen Orten erheben, welche für andere Methoden unzugänglich sind. Allerdings ist die manuelle Interpretation von Satellitenbildern mühsam und langwierig. Deshalb ist und bleibt die automatisierte Ve-rarbeitung von hochauflösenden Satellitenbildern ein intensives Forschungsthema. Für Algorithmen ist es jedoch schwierig, komplexe Szenen mit dichter Bebauung zu inter-pretieren, da Teile der Gebäude aufgrund von Vegetation oder eines flachen Aufnah-mewinkels verdeckt sein können, was die Extraktion oder Rekonstruktion sogar noch erschwert. Dieses Problem kann durch die Integration mehrerer Datenquellen unter-schiedlicher Modalitäten gelöst werden.
Das Ziel der vorliegenden Arbeit ist somit mehrere hochaufgelöste Fernerkundungs-datenquellen für eine voll automatisierte Satellitenbildanalyse zu integrieren. Der Fokus liegt dabei auf der Extraktion von Gebäudeinformationen und deren Verbesserung hin-sichtlich der Bildqualität. Dabei werden zwei Problemstellungen erforscht, die im Fol-genden adressiert werden: Die Extraktion von Gebäudegrundflächen aus sehr hochau-flösenden Satellitenbildern ist ein wichtiger Prozessschritt, der aber aufgrund der äußerst hohen Diversität der Gebäudeformen, sowie der—im Vergleich zu Luftaufnahmen— relativ niedrigen räumlichen Bildauflösung sehr anspruchsvoll ist. Die Bildmerkmale (“features”), die für diese Algorithmen nötig sind, werden für gewöhnlich manuell erfasst, was ihre Genauigkeit limitiert. Basierend auf den Vorteilen, welche der kürzlich entwick-elte Ansatz der Fully Convolutional Networks (FCN) bietet—nämlich der automatischen Extraktion relevanter Merkmale und der dichten Bildklassifikation—wird hier ein “end-to-end framework” vorgeschlagen, welches Spektral- und Höheninformationen aus rot-grün-blau (RGB) und panchromatischen (PAN) Bildern, sowie normalisierten digitalen Oberflächenmodellen (nDSM) effizient kombiniert und daraus automatisiert eine
lauflösende binäre Gebäudemaske errechnet. Die vorgeschlagene Architektur besteht aus drei parallelen Netzwerken, welche zu einem späteren Prozesszeitpunkt fusioniert werden. Dies hat den Vorteil, dass feingranulare Informationen von früheren Verar-beitungsschritten zu höheren Ebenen des Netzwerks propagiert werden, sodass der Out-put in hochqualitativen Gebäudeumrandungen besteht. Die Leistungsfähigkeit dieses Modells wird anhand von neu erhobenen, nie zuvor prozessierten Daten untersucht, um die Generalisierbarkeit bzw. Übertragbarkeit des Modells auf weitere Anwendungen (z.B. andere Städte) zudemonstrieren.
Die steigende Verfügbarkeit detaillierter digitaler Oberflächenmodelle (DSM), welche mittels Dense Matching und der Representation von Höhenprofilen auf der Erdoberfläche gewonnen werden, kann die Analyse und Interpretation komplexer urbaner Szenarien verbessern. DSMs, welche aus optischen stereo VHR-Satellitenbildern gewonnen wer-den, sind zwar hochauflösend, beinhalten aber Höhen-Diskrepanzen und fehlende oder sogar falsche Fragmente, was bei der Gebäuderekonstruktion in einer groben bzw. falsc-gen Gebäudeform resultiert. Um dieses Problem zu lösen wurde im Rahmen dieser Arbeit ein auf einem Conditional Generative Adversarial Network (cGAN) basieren-der Ansatz entwickelt, welcher aus einem photogrammetrischen halb-Meter aufgelösten DSM schlechter Qualität direkt ein hochqualitatives DSM entsprechend eines Level of Details (LoD) 2 mit erweiterten 3D Objektformen produziert. Diverse Deep-Learning-Anwendungen können von dem hier präsentierten Multi-Task Learning mit multipler Re-gression und Klassifikation profitieren, indem die Lösungsansätze der einzelnen Prozess-chritte auf ähnliche Teilaufgaben übertragen werden. Um die Vorzüge dieses Ansatzes zu bewerten wird die Wirkungsweise bei wichtigen Fernerkundungsanwendungen, wie z.B. der realitischen Schätzung von Höhenprofilmodellen, und der Dachtypenklassifika-tion aus stereo halb-Meter-aufgelösten Satelliten-DSMs demonstriert. Es werden kür-zlich veröffentlichte Deep-Learning-Architekturen für beide Anwendungen geprüft, und ein neues “end-to-end” cGAN-basiertes Netzwerk entwickelt, welches verschiedene Mod-elle in einer Weise kombiniert, in der sie zunächst separat genutzt werden, um möglichst spät im Rechenprozess die bestmöglichen Ergebnisse der individuellen Aufgaben zu kom-binieren. Um die Vorzüge der Verfügbarkeit von Informationen aus multiplen Daten-quellen zu nutzen, wird zudem ein weiterer cGAN-basierter Prozess vorgeschlagen, dessen generativer Anteil aus zwei Encodern und einem gemeinsamen Decoder besteht, wobei die Intensitäts- und Höheninformationen aus den Bilddaten innerhalb eines Netzwerks kombiniert werden, zum Zwecke der Verfeinerung des DSMs. Als Inputs für dieses vorgeschlagene Netzwerk werden photogrammetrische Einzelkanal-DSMs mit kontinuier-lichen Werten, sowie halb-Meter aufgelöste panchromatische Einzelkanal-Satellitenbilder benutzt. Die Fusion der Informationen aus verschiedenen Modalitäten hilft dabei, feine Details, vollständig falsche oder fehlende 3D information über Gebäudeformen zu propa-gieren, und verbessert die Gebäudeumrisse, indem sie sie rechtwinkliger macht. Zuletzt werden die vorgeschlagenen Lösungsmethoden zur DSM-Verbesserung miteinander ver-glichen, um den nützlichsten Ansatz zu identifizieren und zu verifizieren und um die Anwendbarkeit der resultierenden DSMs für verschiedene Fernerkundungsaufgaben zu beurteilen.
I would like to express my deepest gratitude to all people, whose support and encour-agement made this work possible:
First of all, I would like to emphasize my appreciation to Prof. Dr. Peter Reinartz for giving me the opportunity to join his Department of Photogrammetry and Image Analysis at German Aerospace Center (DLR) and be able to carry out this dissertation at the University of Osnabrück. I would like to thank him for introducing me to the interesting remote sensing problems and supporting me with many discussions, valuable suggestions and constructive comments which helped me to reach the final goal. I feel very grateful that he was always taking time out of his busy days and being there when I needed his help and advice. Moreover, I would like to thank Prof. Reinartz for the possibility to attend different international workshops and conferences, and for the freedom to participate in various research projects.
I would like to express my sincerest thanks to Prof. Dr. Friedrich Fraundorfer from Technical University of Graz for showing interest in my work and giving me the oppor-tunity to visit his computer vision research group for two months where I had the luck to meet an amazing group of people. Under guidance of Prof. Fraundorfer I was able to approach my topic differently and develop an extended version of my methodology which helped me further to improve results. His brilliant insights into computer vision problems, knowledge and experience, have been continuously inspiring me. Moreover, I would like to thank him for agreeing to be a co–referee of this dissertation.
I would also like to acknowledge the German Academic Exchange Service (DAAD) for financial support of my PhD study and the German Aerospace Center (DLR) for providing facilities and satellite data for this research.
Further, I would like to thank Dr. Marco Körner and his team for giving me support and encouragement, sharing their thoughts and ideas with me. At many stages of this research I benefited from Dr. Körner’s advice and enlightening discussions, particularly when exploring new ideas and methodologies. His positive outlook and confidence in my research gave me a strong motivation. Moreover, his careful editing and proofreading contributed enormously to my publications and this thesis. I also would like to thank Dr. Shiyong Cui for sharing with me his knowledge of machine learning techniques, teaching me programming and being patient responding many of my questions and queries at the
beginning of my PhD.
I cannot find words to express my gratitude to all colleagues at DLR with whom I was lucky to work together every day. Special thanks to Dr. Pablo d’Angelo for the valuable discussions, sharing with me his profound scientific knowledge and experience, providing me a technical support and generating all of the datasets required for this research. I would like to thank Peter Schwind and Dr. Emiliano Carmona for their technical and programming support during my research work. I am very grateful to Thomas Krauß, Dr. Jiaojiao Tian, Maximilian Langheinrich, Dr. Xiangyu Zhuo, Adam Fathalrahman, Zeinab Gharib Bafghi and Dr. Tahmineh Partovi, along with many others for valuable discussions and sharing with me their time, knowledge and experience, listening to my ideas or problems and supporting me continuously.
Completing this work would have been all the more difficult without my best friends who have been always there for me no matter what, and I appreciate it!
Last but not least, I would like to express my deepest gratitude to my family for always believing in me, encouraging and unconditionally supporting me in all my pursuits entire live: my beloved grandparents, Olga and Alexander, who loved me to the Moon and back; my cousin Elena and her husband Christian, who help and support me since the first day of coming to Germany; my uncle Sergey, who accepts me as his own child and guides me with his valuable advises, my dear mother, Irina, who coveres my back my entire live, loves me enough with her compassion, understanding and unconditional acceptance, my beloved husband, Nikolaj, who enriches my every day with love, sharing with me not only happy moments but strongly supporting me in case of difficulties, always having the solution for any problem. I can’t thank you all enough for being there for me and constantly loving me.
Ksenia Bittner Oberpfaffenhofen, December 2019
Abstract ii
Zusammenfassung v
Acknowledge vii
1 Introduction 1
1.1 Scope of the Dissertation . . . 3
1.2 Guidelines for Reading . . . 4
2 Background 7 2.1 High-Resolution Satellite Imagery. . . 7
2.1.1 Active Imagery . . . 7
2.1.2 Passive Imagery . . . 8
2.1.3 Digital Surface Models . . . 10
2.1.4 Satellite Stereo-Based Digital Surface Model Generation . . . 14
2.2 Satellite Image Processing using Deep Learning Techniques . . . 16
2.2.1 Convolutional Neural Networks . . . 16
2.2.2 Training the Network with Backpropagation. . . 18
2.2.3 Diversities of Convolutional Neural Networks . . . 20
2.2.4 Generative Adversarial Networks . . . 24
2.2.5 Multi-Modal Networks . . . 26
2.2.6 Multi-Task Learning . . . 27
2.3 Summary . . . 29
3 State-of-the-Art 31 3.1 Building Footprint Extraction from Very High-Resolution Satellite Imagery 31 3.1.1 Traditional Methodologies . . . 32
3.1.2 Deep Learning-Based Methodologies . . . 37
3.2 Building Shape Refinement for Elevation Models . . . 41
3.2.1 Filter-Based Approaches . . . 41
3.2.2 Interpolation-Based Approaches . . . 43
3.2.3 Incorporation of Auxiliary Data Sources . . . 44
3.2.4 Object-Oriented Refinement . . . 45
3.2.5 Deep Learning-Based Approaches. . . 46
3.3 Contributions of this Dissertation . . . 49
3.3.1 Building Footprint Extraction. . . 50
3.3.2 Digital Surface Refinement with Focus on Building Shapes . . . . 50
4 Building Footprint Extraction from VHR Remote Sensing Images Combined with Normalized DSMs using Fused Fully Convolutional Networks 51 4.1 Problem Statement . . . 51
4.2 Methodology . . . 53
4.2.1 Convolutional Neural Networks . . . 53
4.2.2 Fully Convolutional Network Architecture . . . 55
4.3 Study area and Experiments. . . 58
4.3.1 Data Preprocessing. . . 59
4.3.2 Implementation and Training Details . . . 59
4.3.3 Comparison with alternative methods . . . 60
4.4 Results and Discussion . . . 60
4.4.1 Qualitative Evaluation . . . 61
4.4.2 Quantitative Evaluation . . . 66
4.4.3 Model Generalization Capability . . . 68
4.5 Summary . . . 70
5 DSM-to-LoD2: Spaceborne Stereo Digital Surface Model Refinement 71 5.1 Problem Statement . . . 72
5.2 Conditional GAN for LoD2-like DSM Generation . . . 76
5.2.1 Methodology . . . 76
5.2.2 Study Area and Experiments . . . 80
5.2.3 Results . . . 83
5.3 Building Shape Improvements and Roof Type Understanding . . . 92
5.3.1 Methodology . . . 92
5.3.2 Study Area and Experiments . . . 95
5.3.3 Results . . . 97
5.4 Information Fusion from Depth and Intensity Data for DSM Refinement . 105 5.4.1 Methodology . . . 106
5.4.2 Study Area and Experiments . . . 109
5.4.3 Results . . . 109
5.4.4 Practical Applications of Refined Digital Surface Models . . . 115
5.5 Comparison and Discussion . . . 118
5.6 Summary . . . 121
6 Conclusion 123 6.1 Summary . . . 123
Acronyms 127 List of Figures 131 List of Tables 139 Bibliography 141 Appendices 161 A Related Publications 163 A.1 Journals . . . 163 A.2 Conferences . . . 163
Chapter
1
Introduction
I
n the last 10 years, satellite technologies with high-resolution sensors have becomean important tool for large-scale Earth observation. They provide essential infor-mation by orbiting around the Earth and observing areas of interest for a large diversity of applications. Moreover, satellite images cover much greater areas compared, for example, to aerial mapping. The constant development of space-borne instruments makes it possible to collect digital data at spatial resolutions up to 30 cm which allows detailed terrestrial scene understanding. This is especially important for controlling the impact of urbanization, because a large part of the population is still moving from less developed regions to urban areas due to modernization and industrialization. Conse-quently, this entails changes in urban spaces and appears as a formation of new building constructions or their destruction. Remote sensing is a valuable tool to monitor these changes for large areas and in a time-efficient manner, because the speed of urban changes has provoked a huge demand of reliable building information extraction, which was not possible two decades ago due to the low-resolution of satellite images. However, the analysis of current commercial high-resolution satellite imagery with very fine detail and applying automatic algorithms instead of slow and expensive manual image inter-pretation allows the disclosure of individual, industrial, and residential buildings from images. This information is favorable for a vast amount of remote sensing applications, like the update of Geographic Information System (GIS) databases, civil engineering,city management, emergency problems handling, 3D city modeling, etc. Although nu-merous attempts have been made to develop methodologies towards automatic buildings extraction from satellite imagery, this topic is still an open issue for scientists due to low-resolution in comparison to airborne data and the large diversity of building appearances resulting in scene complexity.
The development of innovative algorithms for building information extraction is also motivated by the type of data which advanced satellite technologies produce. For ex-ample, the modern WorldView-2 satellite provides multi-spectral imagery (2 m pixel spacing) allowing objects recognition through their color differences, and pan-chromatic imagery (0.5 m pixel spacing) allowing detailed extraction through much finer
tion embedded in the images. In some cases, however, it is not enough to only use spectral information since roads and building roofs can have similar texture appearance. More-over, in observing only two-dimensional images, we lose the third dimension—height. The availability ofDigital Surface Models (DSMs) and their combination with spectral
information can be used for solving these problems and as a result, improve image in-terpretation. This is especially important for building extraction and reconstruction applications, because geometrical information is crucial for 3D object discrimination.
In previous studies, buildings are delineated utilizing pan-chromatic (PAN),
multi-spectral images, height information from DSMs, or even the combination of multi-spectral and height data. However, the majority of approaches showed the potential for extracting buildings with similar color, size, or simple shapes, i.e., rectangular or square. In this dissertation, buildings with arbitrary shapes and sizes are automatically delineated, tak-ing advantage of spatial, spectral, and height information from multi-view stereo satellite data sources.
A DSM represents the elevation of the Earth surface including topography and objects above the bare Earth, be it natural objects, e.g., trees, or man made activities, e.g., build-ings. Because DSMs provide the geometry and structure of an urban environment with buildings being the most prominent objects in it, they can increase the understanding and explanation of complex urban scenarios. DSMs can be produced from a variety of source data. Their production, however, is most common from multi-view stereo satellite imagery, e.g., WorldView or Pleiades satellites, because these satellites provide global coverage and exhibit sub-meter resolution. Moreover, DSMs from satellite platforms are less expensive and are not subject to bad weather conditions like Light Detection and Ranging (LiDAR) surveys from aerial platforms. However, despite the available
tech-niques capable of generating large-scale elevation models from high-resolution satellite images, DSMs still feature many mismatches and noise in forms of blunders or spikes due to occlusions by dense and complex building structures, perspective differences, or stereo matching errors during their generation [1, 2]. This introduces difficulties for building extraction and reconstruction. Hence, the development of methodologies able to im-prove photogrammetric DSMs (see example in Figure 1.1a) automatically to a higher quality level (see example in Figure1.1b), e.g., close to Level of Detail (LoD)2
regard-ing theCity Geography Markup Language (CityGML) standard, with more realistic and
complete building geometries is in demand, since earlier approaches which mainly uti-lized filtering and interpolation strategies, have not been very successful and affect the steepness and details of raised objects.
With recent advances in the field of artificial neural networks, it is possible to learn image features automatically instead of extracting them by classical methods, e.g., hand crafted feature extraction. Innovative architectures, such as Convolutional Neural Net-works (CNNs), have demonstrated the ability to classify high-dimensional data sources
accurately and robustly and have become the state-of-the-art for image recognition tasks. Considering these new advantages in the field of image processing, this dissertation aims to develop novel deep learning based algorithms for extracting building footprints from
ge-(a) Photogrammetric DSM (input) (b) Desired building shape (output)
Figure 1.1: Illustration of the building shape refinement we aim to achieve in this dissertation. (a) demonstrates the original low-quality photogrammetric DSM we want to refine, (b) shows the desired enhancement regarding building shape in DSM which is generated from CityGML data.
ometries in photogrammetrically generated DSMs. Moreover, we aim to investigate if the inclusion of auxiliary knowledge in form of spectral, height, segmentation or cate-gorization, e.g., roof type, information into the algorithmic procedures can improve the estimation results of both tasks.
1.1 Scope of the Dissertation
This thesis is primarily focused on the development of new methodologies for detailed and robust terrestrial scene interpretation from VHR satellite imagery regarding building objects. We accomplished this goal by tackling two specific objectives:
• Objective 1: Building Footprint Extraction
The terrestrial scene understanding includes the identification of various natural or man-made targets in an image. Buildings are one of the most difficult, but also one of the most significant objects among them to extract, since they are the most pronounced elements of urban organization. Satellite data provide compre-hensive information, applicable for building footprint extraction. Modern satellite platforms capture images from multiple sensors. To improve the accuracy of ex-tracted building footprints, information from multiple sensors, e.g., pan-chromatic and multi-spectral, can be combined to compensate the limitations of each inde-pendent sensor. However, not only spectral knowledge can be merged. The height information derived from multi-view stereo satellite imagery is also very useful for improving building outlines extraction, because it provides detailed informa-tion about the building geometry. Extracting spectral and height related features for building hypothesis generation is a complex task if done manually or with traditional machine learning approaches. A new potential solution is automatic
extraction of relevant features using deep learning techniques which demonstrated their superiority over traditional ones. In order to produce improved building footprints, we aim to develop an end-to-end neural network for remote sensing imagery understanding which benefits from information combined from different modalities.
• Objective 2: Space-borne Photogrammetric Digital Surface Model Re-finement
Height information embedded in DSMs can greatly contribute to the scene inter-pretation, since it provides knowledge about object silhouettes—a crucial clue for automatic building extraction and reconstruction tasks. Although the DSM can be generated from different data sources, in this thesis we focus on space-borne platforms because these data offer large area coverage around the world and are especially challenging. However, DSMs from multi-view satellite images have some limitations. For example, due to the presence of vegetation building constructions are often hidden under the tree crown and appear incomplete in the DSM. The fronto-parallel plane assumption in the Semi-Global Matching (SGM) algorithm
affects inclined roofs, like hip and gable, by reconstructing them as piece-wise horizontal planes which are far from realistic building appearances. Moreover, the dense matching algorithm can cause errors in the presence of homogeneous or low-textured areas. All these problems can influence the performance of ap-proaches which utilize photogrammetric DSMs. Therefore the quality enhance-ment of photogrammetric DSMs with emphasis on building shapes is in demand. Previously developed approaches did not show significant improvement, resulting only in over-smoothed DSMs or being constrained to a few building forms. In order to automatically improve DSMs to a high level of accuracy, deep learning can be applied, as it has already shown promising results towards depth image re-construction task. We also aim to positively influence building boundaries as well as roof plane reconstruction by introducing auxiliary knowledge via pixel-wise roof type classification masks or intensity information from PAN images additionally incorporated into the learning process. This additional information can make the network more confident when performing the detailed DSMs refinement.
1.2 Guidelines for Reading
This is acumulative dissertation which is organized as follows. Chapter 2 gives a brief
introduction to the fundamental knowledge related to this thesis. Chapter 3 summa-rizes the state-of-the-art as well as the contributions of this dissertation related to the aforementioned objectives. Chapter4defines problems related to building footprint ex-traction task and describes the developed methodology to tackle them. Moreover, the experimental results for two different cities applying the proposed deep learning ap-proach together with qualitative and quantitative evaluations are shown and discussed in this chapter. The chapter represents a peer-reviewed journal paper
• K. Bittner, F. Adam, S. Cui, M. Körner, and P. Reinartz, “Building Footprint
Extraction from VHR Remote Sensing Images Combined with Normalized DSMs using Fused Fully Convolutional Networks,” IEEE Journal of Selected Topics in Applied Earth Observations and Remote Sensing, vol. 11, no. 8, pp. 2615–2629,
2018 [3].
Chapter5introduces open questions to our second objective related to DSM refinements. It states three possible approaches to solve the problem. Furthermore, experimental results of three proposed methodologies together with qualitative and quantitative anal-ysis are presented in this chapter. An additional comparison between three proposed methodologies is also followed by detailed discussions. Chapter 5 is based on the com-bined findings of the following two peer-reviewed journal papers:
• K. Bittner, P. d’Angelo, M. Körner, and P. Reinartz, “DSM-to-LoD2: Space-borne
Stereo Digital Surface Model Refinement,” Remote Sensing, vol. 10, no. 12, p.
1926, 2018 [4]
• K. Bittner, M. Körner, F. Fraundorfer, and P. Reinartz, “Multi-Task cGAN for
Si-multaneous Space-borne DSM Refinement and Roof-Type Classification,”Remote Sensing, vol. 11, no. 11, p. 1262, 2019 [5]
and one double-blind peer-reviewed workshop paper:
• K. Bittner, M. Körner, and P. Reinartz, “Late or Earlier Information Fusion
from Depth and Spectral Data? Large-Scale Digital Surface Model Refinement by Hybrid-cGAN,” in Proceedings of the IEEE Conference on Computer Vision and Pattern Recognition (CVPR) Workshops, 2019 [6].
Chapter
2
Background
“Man must rise above the Earth—to the top of the atmosphere and beyond—for only thus will he fully understand the world in which he lives."
— Socrates, Philosopher
2.1 High-Resolution Satellite Imagery
W
e live on a planet which changes very rapidly, and there is no confidenceabout the changes that are coming in the future. It is beneficial to gain a new vision, and prove all facts, before reaching any critical decision. To monitor changes globally, we need a bird’s-eye view of our planet from above. Satellite imagery can help us to achieve this goal. In this technology-driven era, our planet is con-tinually being observed and imaged by satellites providing long-term global observations of the land surface, oceans, biosphere, and atmosphere in very high spatial, spectral, and temporal resolution and with large-area coverage. As a result, the aforementioned advantages make a satellite a valuable instrument which can collect more data more quickly than instruments on the ground or by using airplanes and helicopters.2.1.1 Active Imagery
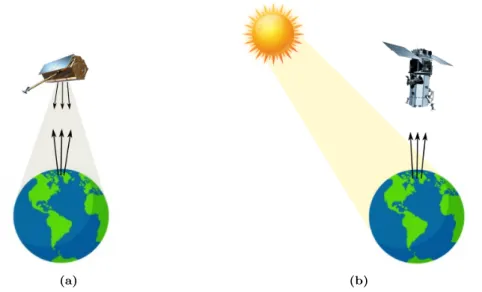
Remote sensing instruments collect light energy within specific regions of the electro-magnetic spectrum, and comprises the range of all types of electroelectro-magnetic radiation covering visible light, radio waves, microwaves, infrared light, ultraviolet light, X-rays and gamma-rays as depicted in Figure 2.1. Two types of remote sensing equipments can be distinguished: active and passive. Active sensors, e.g., Synthetic Aperture Radar (SAR) or Light Detection and Ranging (LiDAR), provide their own energy source for
target illumination (see Figure 2.2a). Regular pulses of energy are emitted at a known electromagnetic wave towards the surface of the Earth to be investigated. The radia-tion reflected, refracted, or scattered by the Earth’s surface or its atmosphere back to
Wavelength [nm] decreases
Visible light
Radio waves Microwaves IR UV X-rays Gamma-rays
106 100 10−3 10−8 10−11 10−13
750 700 600 500 400 [nm]
Figure 2.1:The electromagnetic spectrum illustration from the longest wavelength (at the left) to the shortest wavelength (at the right).
the satellite is detected and measured by the sensor. Radar imaging systems, such as
European Remote Sensing Satellite (ERS), TanDEM-X, TerraSAR-X, and Japan Earth Resources Satellite (JERS), are examples of active sensors. The advantage of using
mi-crowaves is that they are able to obtain measurements at any moment, without any limitations from the time of day or the season. They can even penetrate clouds. How-ever, to adequately illuminate targets on the Earth surface, active sensor instruments require a large amount of energy. This type of data also cannot differentiate the visible color of objects which is crucial for many remote sensing applications.
2.1.2 Passive Imagery
On the other hand, passive instruments detect natural energy in the wavelength range they are capable of that either emitted or reflected back to space from the observed area (see Figure 2.2b). The sunlight reflected by objects on the ground is the most usual external radiation source sensed by passive instruments. By analyzing the strength of reflection, a land surface can be understood, e.g., urban areas or farm fields, forests, rivers and lakes, or distribution of plants. Passive instruments can only be utilized to detect reflection when energy of natural origin is available. This can only occur while the Sun illuminates the Earth. Weather conditions also influence data acquisition. For instance, optical sensors cannot observe areas under clouds. The examples of passive instruments that measure only sunlight radiation and reflected or emitted radiation by the Earth are WorldView, Landsat, Sentinel-2 and Pleiades satellites.
2.1.2.1 Pan-chromatic Band
Earth observation sensors can capture data in single or multiple bands producing pan-chromatic (PAN)and multi-spectral images, respectively. The PAN image is the result
(a) (b)
Figure 2.2:Schematic illustration of (a) active and (b) passive remote sensing instruments in action.
(NIR)spectrum. This measurement would typically cover wavelengths between 0.47 µm
and 0.83 µm, like for WorldView-2 satellite. The broad bandwidth allows to maintain a high signal-to-noise ratio, resulting in the PAN data with a high spatial resolution. As the PAN band combines the information from this spectral range, it returns a single intensity value per pixel that is often displayed in a gray-scale image (see Figure2.3a).
2.1.2.2 Multi-Spectral Band
With more spectral bands, the information gathered by the sensor increases. Most com-mercial Earth observation satellites generate multi-spectral images covering several, and commonly narrow bands, over the visible and infrared portions of the electromagnetic spectrum. This means that each multi-spectral image layer is gathered at a specific wavelength band. Therefore, the range of wavelengths contributing to the radiation en-ergy collected by the sensor is reduced and multi-spectral instruments typically have to acquire energy on a larger spatial extent to enhance the signal-to-noise ratio. This leads to a lower spatial resolution opposite to PAN images. Typically, multi-spectral sensors provide a discrete and limited number of bands, generally under 15, although on some sensors, such ashyperspectral, it can contain more than 100 spectral bands.
A common example of multi-spectral images is the production of “natural color” pho-tographs which combine three bands of the visible spectrum: blue, green and red (see Figure 2.3b). However, current remote sensing multi-spectral cameras are not only re-stricted to the visible spectrum. They can detect different infrared spectral ranges, e.g., NIR, shortwave,infrared (IR), thermal IR or even the ultraviolet ranges. For example,
the image which couples the green, red, and near infrared bands is a valuable data source for remote sensing applications related to the land, forest and agriculture monitoring be-cause it highlights the presence and health of the vegetation: healthy vegetation absorbs
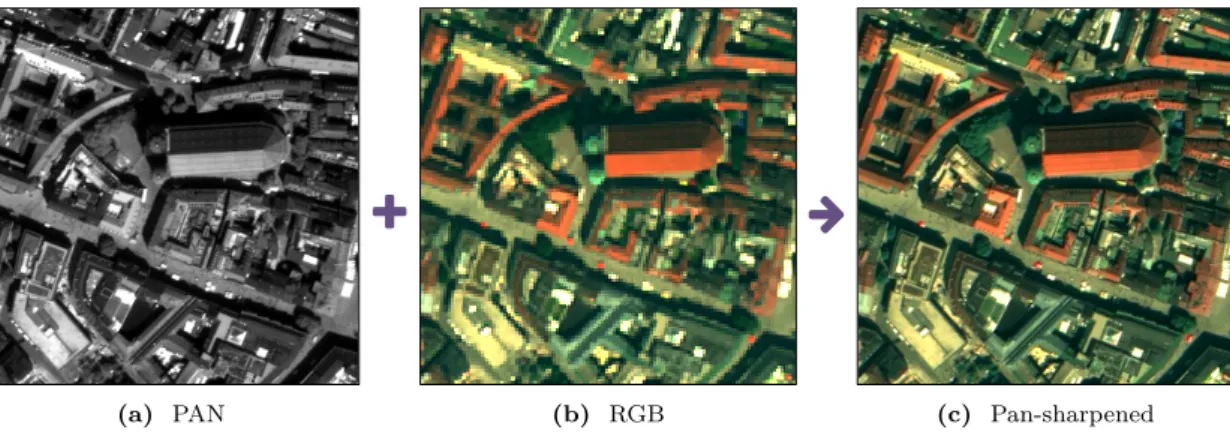
(a) PAN (b) RGB (c) Pan-sharpened
+
ú
Figure 2.3:An example of (a) PAN image withGround Sampling Distance (GSD) of 0.5 m, (b) red, green, and blue (RGB)image with GSD of 2 m, and (c) pan-sharpened image with GSD of 0.5 m depicting a central cathedral in the city of Munich, Germany. Images are acquired with WorldView-2 satellite. The pan-sharpened image is generated by combining the high-resolution pan-chromatic image with low-high-resolution RGB image using a pan-sharpening technique developed by Kraußet al.[7].
blue- and red-light energy to fuel photosynthesis and creates chlorophyll which reflects strongly in the NIR spectrum, and therefore appears in darker red in the image. Numer-ous other combinations of wavelength bands are possible, depending on the information to be extracted for the Earth’s surface investigation (soil, water, geological formations, etc.).
2.1.2.3 Pan-Sharpening
Current commercial satellites, like Pleiades or WorldView, commonly include both lower-resolution multi-spectral bands and a single higher-lower-resolution pan-chromatic band. The reason to configure the satellites in this way is to keep their weight, cost, bandwidth and data rate lower. The desire to have space-borne images with both high spatial and spectral resolution motivates researchers to develop pan-sharpening techniques that merge high-resolution pan-chromatic data with medium-resolution multi-spectral data to create a multi-spectral image with higher-resolution features. An example of pan-sharpened image is illustrated in Figure 2.3c. Obtaining high spatial and at the same time spectral resolution data, can be crucial in many remote sensing applications.
2.1.3 Digital Surface Models
Traditional satellite image provides valuable 2D information from which the physical state of the Earth surface can be analyzed. However, the world is three-dimensional and two-dimensional imagery only represents a part of the reality. Elevation models can measure and analyze the real world in 3D for a more complete picture. The digital format of a height model is given by aDigital Surface Model (DSM), consisting of elevation data
DSM is a 2.5D height representation because it considers the maximum height over ground rather than looking at all objects that might be below.
Remote sensing technologies provide several approaches to measure the surface topog-raphy. Most common data sources are ground survey, stereo airborne, or space-borne photogrammetry, satelliteInterferometric Synthetic Aperture Radar (InSAR), and aerial
LiDAR.
2.1.3.1 Ground survey
Ground survey is used to collect detailed topographic and land cover characteristic data for smaller target areas such as city districts, dumping area, reservoir site, etc. It involves
Global Positioning System (GPS)observations, total stations and laser ranging to gather X,Y,Z coordinates of terrestrial points in a gridded way for DSM generation. Although
this technique gives detailed elevation models, it has limitations consisting of high cost, narrow area coverage, and is highly time consuming because it requires extensive labor involvement [8,9].
2.1.3.2 Light Detection and Ranging Technology
The LiDAR technology utilizes the NIR band of the electromagnetic spectrum and mea-sures the time it takes for the emitted laser pulse to travel from the transmitter to the object on the Earth’s surface and back to the receiver. Because the speed of light is known, the distance can be calculated. The LiDAR technique has an up to centimeter level accuracy as well as a regular scan pattern with high density. This allows the pro-duction of a high-quality DSMs. The pulse laser light transmitted by the LiDAR is also able to partially penetrate vegetation and also acquires ground points through the vege-tation cover. However, LiDAR data acquisition is expensive and does not provide global coverage compared to satellites. Furthermore, LiDAR data only provide the building or roof top sparse depth information. It influences the precise identification and measure, as the exact corners of building construction usually do not contain collected points [10].
2.1.3.3 Interferometric Synthetic Aperture Radar
The DSM generation can be obtained through radar interferometry, using the difference in phase between at least two complex SAR images. The interferometry image pair is either taken sequentially via repeat-pass mode, or simultaneously via single-pass mode by airborne or space-borne sensors from slightly different view angles focused on the same area of interest [11,12]. SAR is a cost-effective technology which can perform wide coverage measurements with ground resolution up to 1 m under all weather conditions and at day and night times [13]. However, densely settled areas, steep topography, shadow regions, or vegetation presence are hard to handle in InSAR processing, as they lead to limited visibility of objects due to occlusion issues and as a result, produce erroneous or missing height estimates [14]. Moreover, because of the side-looking sensor
principle, InSAR technology is not as useful for some remote sensing applications, such as building recognition and reconstruction.
2.1.3.4 Multi-View Stereo Photogrammetry
Height information extraction is possible from either airborne or space-borne multi-view stereo photogrammetry by using correlations between every pixel of overlapping images over an area. Multi-view stereo photogrammetry contributes to the scene completeness by minimizing the occlusion between landscapes and by allowing a multitude of match-ing points. Airborne platforms provide a good performance with respect to spatial and spectral resolution. The resulting images are not affected as much by atmospheric per-turbations. Airborne platforms are very flexible in operation and all acquired data is available to the customer as soon as the survey mission is over [15]. However, turbu-lences, clouds, and air traffic control, as well as the high costs, limit the efficient use of airborne platforms. Furthermore, they cannot be used during volcanic eruptions or hurricanes because it puts the crew in danger. Also, airborne survey missions are usually planned as one-time operations compared to the space-borne platforms which continu-ously observe the Earth. A good overview of existing airborne stereo systems is given by Zhang [16].
In recent years, the techniques of stereo imagery acquisition from space-borne plat-forms have rapidly evolved, allowing researchers to obtain DSMs of improved quality and resolution. The data is very useful for many applications, as it provides regular surveys of the same area, e.g., for security surveys or when monitoring natural disasters [16]. When compared to airborne platforms, they are cost-effective and provide a much wider area of coverage. Multi-view stereo data can be collected by across-track stereoscopy from two or more adjacent orbits in different days. However, the quality of DSMs gen-erated from across-track stereo imagery is influenced by temporal changes of the surface reflection due to the different acquisition dates. The recently employed same-date along-track stereo data acquisition from the same orbit using multiple cameras or by adjusting the viewing angles overcomes this problem. It reduces the radiometric image variations allowing higher quality 3D reconstructions than previously possible. An example of such a DSM is illustrated in Figure2.4.
Satellite imagery products vary in their spectral and spatial resolution, geographic and temporal coverage, cloud cover, security regulations, and price [18–20]—characteristics and operation mechanisms which can limit specific Earth observation applications. Tech-nological progress and increasing accessibility of high-resolution satellite imagery expand traditional application domains in remote sensing. Examples of modern, submeter-resolution commercial space-borne platforms are the GeoEye-1, WorldView 1–4 and Pléi-ades 1A/1B satellites. They represent the most important very high-resolution satellites with stereo acquisition capabilities.
• GeoEye-1
GeoEye-1 is an American very high-resolution satellite that was launched on Septem-ber 6, 2008. It collects 0.41 m resolution PAN and 1.64 m resolution multi-spectral
Figure 2.4: An example of optical DSM with a resolution of 0.5 m produced from six pan-chromatic Worldview-1 images usingSemi-Global Matching (SGM)[17] method. The depicted area is located in Berlin, Germany and represents a 1.5 km2 coverage. The image is color-shaded for better visualization.
images providing 15.3 km swath at nadir. The multi-spectral images consist of four color bands including blue, green, red, and near-infrared channels. The satellite can be ro-tated forward, backward or sidewards with high-precision and has a revisit capability of one to three days, depending on latitude. This sensor is meant to be utilized for large projects, as it can collect over 350 000 km2 of pan-sharpened multi-spectral satellite im-agery per day. The description of the GeoEye-1 satellite is taken from the Satellite Imaging Corporation web page [21].
• WorldView 1-4
WorldView-1 is a commercial Earth observation satellite that has provided high-resolution pan-chromatic multi-view stereo imagery collection since its launch on Septem-ber 18, 2007. The satellite has revisit time of 1.7 days on average and is capable of covering up to 750 000 km2 per day of half-meter resolution PAN imagery.
WorldView-2 is another commercial Earth observation satellite operated by Digital-Globe that provides a 0.5 m pan-chromatic images as well as 2 m multi-spectral images with four standard colors (red, green, blue, and near-infrared 1) and four additional bands (coastal, yellow, red edge, and near-infrared 2). The satellite was launched on October 8, 2009. WorldView-2 has a revisit time of 1.1 days and is able to collect nearly 1 million km2 every day of multi-view stereo imagery in a single pass by adjusting the camera viewing angle.
WorldView-3 is the first multi-payload, super-spectral, high-resolution commercial satellite sensor. It was launched on August 13, 2014. Along with 0.31 m pan-chromatic and 1.24 m multi-spectral bands, the WorldView-3 sensor collects eight-band 3.7 m res-olution short wave infrared (SWIR) and Clouds, Aerosols, Water Vapor, Ice and Snow (CAVIS) data at 30 m resolution. The CAVIS offers standardized data independent of
where or when the images have been acquired by correcting the inconsistencies caused by certain conditions.
WorldView-4 satellite was successfully launched on November 11, 2016. Similar to WorldView-3, it is capable of delivering the pan-chromatic image with 0.31 m resolution
and collecting four-band multi-spectral image at 1.24 m resolution. WorldView-4 satellite is able to revisit any point on the Earth every 4.5 days, depending upon the required look angle. The very high-resolution of provided images offers customers precise views for 2D or 3D mapping, change detection and image analysis tasks.
The description of the WorldView 1-4 satellites is taken from the web pages of the Satellite Imaging Corporationg [21] and European Space Imaging [22].
• Pléiades 1A/1B
Pléiades is an optical observation system built by Airbus Defence and Space consisting of two identical satellites, Pléiades 1A and Pléiades 1B, that deliver 50 cm color images. Pléiades 1A was successfully launched on December 16, 2011 followed by Pléiades 1B launched on December 2, 2012. Operating 180◦ apart on a phased orbit, the Pléiades
system allows a daily revisit to any location on the Earth, which makes it ideal for mapping large scale areas. This information about the Pléiades satellites is taken from the Satellite Imaging Corporation web page [21].
2.1.4 Satellite Stereo-Based Digital Surface Model Generation
The high agility of modern Very High-Resolution (VHR) satellites, like WorldView-1
and 2, makes the collection of multiple images of the same area under different viewing angles in a single pass possible. By merging DSMs, generated from several image pairs applying SGM algorithms [17, 23, 24] which avoid matching windows, a better-quality DSM with minimum number of outliers and sharper object boundaries can be achieved. Elevation information extraction in the form of DSMs from along-track stereo satellite imagery is a highly valuable component for many remote sensing applications.
The DSM generation pipeline incorporates two main steps: 1) stereo imagery orienta-tion computaorienta-tion considering givenRational Polynomial Coefficient (RPC)and 2) dense
image matching. An accurate stereo matching is a very important procedure, because the density and accuracy of derived matching points directly influence the quality of DSMs.
• Multi-View Image Orientation
Elevation model extraction from multi-view very high-resolution satellite imagery re-quires accurate calculation of RPC camera parameters for each image. The initial RPCs known from orbit and attitude information cannot meet fitting requirements between multiple images in most situations. Thus, it is necessary to refine RPCs as the satel-lite position and orientation errors will result in systematic failures during dense image matching for generating DSMs.
Errors in sensor position and orientation can be corrected by abundle adjustment
pro-cess which ensures that the observations in multiple images of a single ground point are in a unified geodetic framework [25]. Several works [24,26,27] have been applying RPC bundle adjustment refinement procedure already to establish a good relative orientation
between the images. The correction of RPCs first requires accurate tie points between the stereo images. Initial tie points for stereo pair can be located at one pixel accuracy by sliding the pattern area over all the search region. These tie points are then refined to sub-pixel accuracy using localLeast Squares Matching (LSM)[28]. Second, to correct
absolute orientation, optimal Ground Control Points (GCPs) at sub-pixel accuracy are
needed which are 3D locations of points known a priori from GPS observations or al-ready existing DSMs and high-resolution orthorectified images. However, the acquisition of required GCPs could be tedious or even impossible, if a rapid response is needed in cases like large scale processing or crises situations. Because this type of information is not always available, contemporary research uses automatic image-based techniques to extract and correct GCPs [29].
• Dense Image Matching
To generate a detailed DSM from multi-view stereo images, a dense stereo matching method called SGM [17,23] is used. The SGM defines a pixel-wise matching of mutual information and approximates global 2D smoothness constrains by following 1D con-strains in multiple directions through the image [23]. The main fundamentals of SGM are matching and disparity map generation.
After establishing a good relative orientation, matching is performed for all potentially matching pixels in the stereo pair using epipolar geometry. SGM does not involve window matching technique [17, 23]. As a result, a reliable reconstruction of object edges can be achieved. To avoid strong local assumption on the local surface shape, the matching step is viewed as an energy minimization problem solved by optimizing the aggregation costs from 16 directions and finding disparity imageD with low energy
E(D) = Σp C(p, Dp) + X q∈Np P1T[|Dp−Dq|= 1] + X q∈Np P2T[|Dp−Dq|>1] . (2.1)
The function C is a data term which defines the pixel-wise matching cost between the
image pixels p and corresponding pixels in disparity map Dp. The second and third
terms of the energy function are regularization terms which favor similar disparities for neighboring pixels Np but also allows large jumps in areas with high contrast,
respec-tively. As a result, if disparity changes are small (disparity change = 1 pixel), a constant penalty P1 is added to the energy function. In contrast, if a higher disparity change occurs (disparity change > 1 pixel), a larger constant penaltyP2 is added. The function T is a condition which is equal to 1 if the argument is true, and to 0 otherwise. The
detailed description of cost aggregation is given by Hirschmuller [23].
Image pairs are matched from the first to the second, and from the second to the first image by applying the SGM on multiple images. It allows to keep only consistent disparities and avoids to fuse the most mismatched regions. Small isolated regions are rejected as irregularities. The obtained separate disparity maps from each image pair are first reprojected to the desired projection and merged afterwards to generate a single DSM by using a median filter [24].
Figure 2.5:The schematic representation of CNN hierarchically structured of multiple convolutional,
Rectified Linear Unit (ReLU)and pooling layers. The top layers are fully connected layers, which after applying the softmax normalization on each of the neurons represent a class of probability distributions.
2.2 Satellite Image Processing using Deep Learning Techniques
Currently, the amount of data obtained by remote sensors are large and complicated. As a result, only inspecting them manually is impractical or even impossible. Numerous image analysis approaches have been developed to interpret and extract information at the greatest extent possible from remote sensing images. The strategies applied for image analysis are strongly dependent on the goals of each individual project.
Until approximately five years ago, machine learning algorithms mainly used hand crafted features from the images, like spectral and textural, calculated from a few training samples. With the recent advances of deep learning methods for remote sensing imagery processing, it is now possible to solve many Earth observation problems automatically and at a high-level of accuracy. Deep learning algorithms demonstrate excellent results at recognizing patterns captured in neighboring pixels within the images. As a result, they learn to represent the image context as a hierarchy of patterns where each pattern is a combination of simpler and more abstract features. The most extensively used deep learning concept is Convolutional Neural Networks (CNNs) [30] that are particularly
powerful for computer vision tasks, such as image recognition [31,32], segmentation [33, 34] and classification [30,35–37].
2.2.1 Convolutional Neural Networks
The search for good internal information about image objects has been the main inten-tion since the beginning of computer vision. Many studies are based on a mathematical operation, called convolution. The general expression of discrete two-dimensional con-volution is (k∗f)x,y = W1 X s=−W1 W2 X t=−W2 ks,tfx−s,y−t (2.2)
where f represents the input image and k defines the filter given by s∈[−W1, . . . , W1] and t∈[−W2, . . . , W2].
CNNs take the general advantages of neural networks and manage to work with 2D or 3D data. As a result, their training parameters represent 2D or 3D matrices. CNNs are typically composed of multiple trainable blocks. Each of the blocks receives a collection of feature maps and transforms it to a new collection of feature maps through differentiable functions. A common CNN block is built of three layers: a convolutional layer, a layer with non-linear activation function and a pooling layer.
A convolutional layer consists ofS filters of size (2·W + 1)×(2·W + 1) in spatial direction and of sizeC in spectral direction with trainable weightskm,n,c, wherem, n∈
[−W, . . . , W] determine the spatially localized region and c ∈ [1, . . . , C] determine the spectral one. The spectral size defines a number of features per pixel position, i.e., a number of channels, such as three for a RGB image. The feature map yli,j,s of layerl at spatial locationi, j and at spectral channel sis computed as
yi,j,sl =σ( W X m=−W W X n=−W C X c=1 (klm,n,c−1,s ·yil−−1m,j−n,s+bli,j,s−1)) (2.3)
where bli,j,s−1 is a bias matrix. It is not necessary that the number of spectral channels s stays the same along the whole network architecture. In most cases, it gradually increases from the bottom to the top of the networks.
Due to the translation equivariance property [38], if one feature is useful to compute at some image location (x1, y1), then it should also be useful to compute at a different image location (x2, y2). As a result, the same weight parameters defining identical features can be applied around the whole image. In CNNs, this strategy is extensively exploited allowing the sharing of weights and biases across the entire layer. With local connectivity and shared weights, CNNs tend to reduce a number of learning parameters compared to the standard fully connected neural networks and provide a better generalization when dealing with computer vision problems [39].
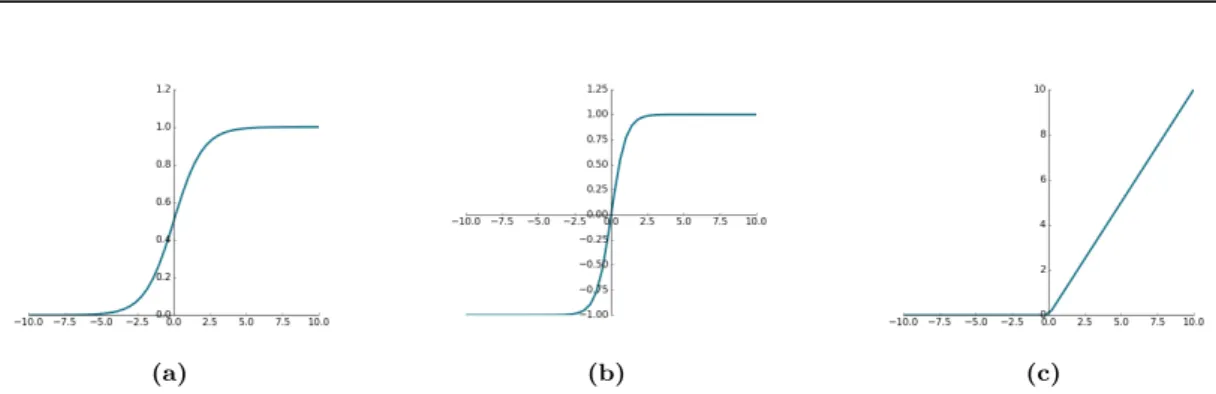
In Equation (2.3), the σ(x) defines a non-linear activation function which helps the network to learn a complex data. In other words, non-linearities ensure that the model is able to perform more complex function approximation than a linear one. Common non-linear functions used for feed-forward neural networks are thesigmoid (see Figure2.6a)
σsigmoid(x) = 1
1 + e−x (2.4)
or thehyperbolic tangent (see Figure2.6b)
σtanh(x) = e
x−e−x
(a) (b) (c)
Figure 2.6:Examples of (a) sigmoid, (b) tanh, and (c) ReLU non-linear activation functions commonly used for feed-forward neural networks.
For CNNs it is common to use therectified linear unit non-linearity
σReLU(x) = max(0, x) (2.6)
which sets all negative values in the convolution matrix to zero introducing the sparsity to the network and keeps the positive values unchanged (see Figure2.6c). This is beneficial for training the network with backpropagation [40] because it prevents the gradient vanishing problem and makes the computational implementation more efficient.
A pooling layer progressively reduces the information in the spatial range [−P, . . . , P]. The most common pooling operation ismax pooling
pli,j,s= max
m∈[i−P,i+P],n∈[j−P,j+P] n
ym,n,sl o (2.7)
which takes the maximum element in a local region, thereby providing a small degree of invariance. Pooling operation reduces the number of parameters and computation in the network, and as a result is able to control overfitting.
CNNs were initially developed for image classification tasks. Thus, the top layers of CNNs are usually fully connected layers, which merge the information of the whole image to predict the correct class associated with it. The final layer is a 1D array of neurons representing a class of probability distributions after applying softmax normalization on each of the neurons. The size of the last 1D group of neurons is equal to the number of possible classes established for the task. A multi-stage design of CNN architectures allows to automatically and adaptively learn spatial hierarchies of features, from low-level components at the bottom, such as edges and corners, to high-level semantic information at the top layers. In other words, convolutional and pooling layers transform the input image to a higher spectral but low spatial resolution abstract representation which are easier to separate.
2.2.2 Training the Network with Backpropagation
The signal of the entering data is distributed in forward direction through neural network parameters towards the point where a decision will be made. Training a network means
finding such parameters which minimize dissimilarities between predicted values by the network and given ground-truth labels on a training dataset. The misclassifications are penalized by a task-dependent loss function. Tasks based on classification use the cross-entropy loss function
LCE(x,y,p) =−X i
yilogp(xi) (2.8)
paired with sigmoid (cf.Equation (2.4)) or softmax
σsoftmax(x) = e xk
P jexj
(2.9)
normalization, while regression tasks use the Euclidean error function
LEucl(x,y,p) =X i
kyi−p(xi)k22. (2.10)
The Euclidean error function can be also used in case of binary classification. How-ever, the common choice of the cross-entropy loss function over the Euclidean loss func-tion for training the CNNs for the binary classificafunc-tion task can be explained by its ability to avoid the slowdown problem during the learning process and to provide a more numerically stable gradient when coupled with softmax normalization [41]. Here,
x={x1, . . . , xn}is the set of input examples in the training dataset andy={y1, . . . , yn}
is the corresponding set of target values for those input examples. The p(xi) represents
the predicted output of the neural network for provided input xi.
The main objective of neural networks is to create a model from the training data which correctly generalizes on a very wide range of previously unseen data. It is possible, due to the network’s ability to learn relevant features in the data. A method which is only able to work on the training data is not effective.
To prevent a tendency of neural network to overfit the training data, a process of prior knowledge insertion, called regularization, is usually employed. It can appear in many forms, e.g., data augmentation, but a common way is to add an additional term to Equation (2.8) called “weight decay”,
L(x,y,p) =X i
L0(yi, p(xi)) +λkwk22, (2.11)
which prevents the weights growing too large. Here, the term L0 defines the
cross-entropy loss function (cf. Equation (2.8)) and λ is a constant controlling how strong large weights should be penalized.
By minimizing the loss function (cf.Equation (2.11)), w.r.t the weights wand biases b, the network can be trained. Generally, neural networks are trained using the
back-propagation algorithm [40], which computes the derivatives of the loss function with respect to parameters ∂L
∂wi and
∂L
that they can alter the parameters wi ←wi−α ∂L ∂wi (2.12) bi ←bi−α ∂L ∂bi (2.13)
with learning rate α one step at a time. This standard loss minimization technique is called gradient descent. Since a neural network is a composition of multiple simple
functions, the computation of derivatives for the gradient descend algorithm is done by applying the chain rule
f(g(x))0=f0(g(x))·g0(x). (2.14) Computing the gradient descend for data with thousands (or more) elements for every iteration is impractical. Therefore, an approximation called the Stochastic Gradient Descent (SGD)with a mini-batch is a typical choice, as the gradient computation is done
on a small number of data points rather than on the entire dataset. The training can be further optimized by SGD with momentum [42] which is often considered an essential component to train deep networks. In specific cases, the extensions like Adagrad [43], Nesterov’s accelerated gradient descent [44], Adadelta [45] and Adam [46], tend to be very similar in quality, if not better than vanilla momentum.
Deep neural networks have a large amount of parameters. As a result, they are prone to overfitting on the training data. In addition to the classical weight decay regulariza-tion (cf.Equation (2.11)), a dropout [47] regularization technique shows its power and
strength to improve generalization for deep neural networks. The term “dropout” refers to ignoring a random amount of units (along with their connections) from the neural network during training [47]. Consequently, only a random subgroups of neurons are trained in a single iteration of SGD. This prevents neurons from co-adapting too much to the problem.
2.2.3 Diversities of Convolutional Neural Networks
2.2.3.1 Recurrent Neural Networks
Recursive Neural Networks (RNNs) are powerful and robust types of neural networks
which have gained more popularity in the last years. Unlike feed-forward networks, the RNNs are networks with loops in them, also called recurrent connections. The major advantage of RNNs is that with these connections the network is able to refer to last states, allowing information to persist over time, and can therefore making use of sequential information. This is similar to how the human brain processes the information. Humans do not start their thinking from scratch every second. For example, when we read a poem, we understand each sentence based on our understanding of the previous words.
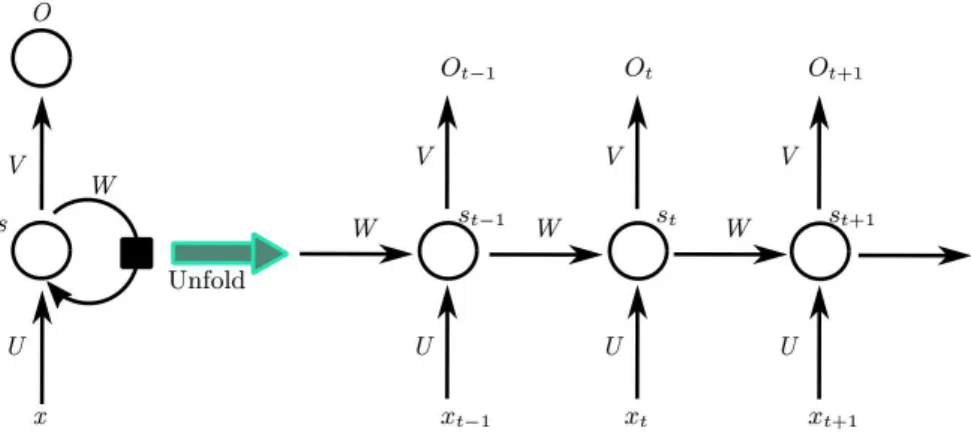
Figure 2.7: A diagram of an unfolded RNN represented as a chain of repeated units whereU defines weight vector for hidden layer,V represents weight vector for output layer,W represents the same weight vector for output layer but for different time steps,x is an input vector andOis an output vector.
its input to its output as well as a connection from its output again to its input. This extra loop connection allows information to be passed from one step of the network to the next.
The illustrated RNN block can be unrolled (or unfolded) into a full network (Fig-ure 2.7) ofk instances. The number of k instances depends on the length of the whole
sequence. For example, if an input sentence consists of three words, the network is un-folded into a three-layer neural network, where one layer is responsible for one word. If we specify the hidden state at time stept asst, the process of carrying memory forward
can be defined as
st=σ(U ·xt+W ·st−1) (2.15)
where xt is the input or the second word of a sentence at a time step t modified by a
weight matrixW, added to the hidden state of the previous time stepst−1 multiplied by
its own hidden-state-to-hidden-state matrix U. The function σ is one of non-linearity functions described in Section2.2.1.
The training of RNN is done on unfolded networks, like in Figure2.7, with a back-propagation algorithm the same as for the feed-forward networks, except that each epoch has to run through each unfolded layer. The extension of backpropagation algorithm for RNN receives the nameBackpropagation Through Time (BPTT).
RNNs have demonstrated superior results in many tasks. Their ability to deal with sequential data is significant for applications like image or video captioning [48], hand-writing recognition [49], speech synthesis [50] and speech recognition [51], where a model produces sequential outputs. In the case of time series forecasting [52], video analy-sis [53], and musical information retrieval [54], a model must learn from inputs that are sequenced. Some interactive tasks, like translating natural language [55, 56], engaging in dialogue [57], and controlling a robot [58], often require both capabilities.
forward/inference backward/learning pixel-wise prediction segmen tation g.t. 96 256 384 384 256 4096 4096 21 21
Figure 2.8:Fully convolutional network representation. Compared to standard CNNs,Fully Convolu-tional Networks (FCNs)are able to learn to make dense predictions for each pixel within a given input image. The image is adapted from Longet al.[59].
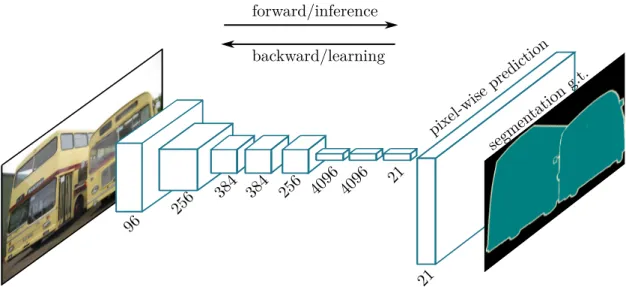
2.2.3.2 Fully Convolutional Networks
The semantic segmentation task is different from the classification task because of its requirement to assign a class for each pixel from the input image (see Figure 2.8), instead of only one class for the whole input image. This problem is extremely difficult because the method should be able to classify and to locate the objects at the same time. Moreover, the produced output should have the same size as the original input image.
Recently introduced FCNs [59] have become the state-of-the-art methodologies for the task of image segmentation. They are an adaptation of traditional CNNs, where the top fully connected layers are changed with convolutional layers. As a result, unlike the basic CNNs, the spatial information in the top layers is not lost when applying FCNs, but can be tracked back [60]. This also reduces the number of parameters and computation time as well as makes the network independent from the input size.
The output layer of FCNs is the same height and width as the input image, but the number of channels is equal to the number of classes of the task and represents the per-class probability mapscli(x, y). In the case of binary classification, the shape of the
final output layer will beheight×width×2.
Semantic segmentation requires a mechanism to project the lower-resolution features learned at different stages of the encoder onto the higher-resolution space to obtain a dense classification. For the encoder, a pre-trained classification network like VGG [36] or ResNet [61] is commonly used. The recovering of spatial information is done in the so-called decoder part of the network using transposed convolution layers which perform a learned interpolation from a set of nearby points.
Applying up-sampling to bring the classification maps to the original size does not guarantee the production of accurate segmentation masks with very detailed object
![Figure 3.2: Visual comparison of DSMs generated with (a) Semi-Global Matching (SGM) [17] approach from six pan-chromatic Worldview-1 images, (b) LiDAR point cloud and (c) City Geography Markup Language (CityGML) data](https://thumb-us.123doks.com/thumbv2/123dok_us/9833015.2475911/54.892.165.789.169.897/comparison-generated-matching-approach-chromatic-worldview-geography-language.webp)
![Figure 4.1: Schematic representation of our FCN4s architecture adapted from FCN8s [59] for building footprint extraction task from VHR remote sensing imagery](https://thumb-us.123doks.com/thumbv2/123dok_us/9833015.2475911/68.892.189.760.148.495/figure-schematic-representation-architecture-adapted-building-footprint-extraction.webp)