Long-standing restrictions on where banks could locate their operations began to erode more than twenty years ago and were mostly eliminated with the passage of interstate branch-ing and bankbranch-ing legislation in 1994. As a result, the U.S. banking industry experienced substan-tial consolidation.1 While this has likely
con-tributed to the industry’s robust performance of late, it could have important consequences for banks’ small business lending. Large, complex banking organizations are traditionally not seen as significant sources of financing for small busi-nesses.
On the other hand, the banking industry, like other segments of the economy, is an active participant in the information and communica-tions revolution. Credit scoring models lower the costs of extending credit and improve access to small business financing, especially for larger banks. So, while consolidation could reduce small business lending, technological advances may increase the flow of small busi-ness credit.
In this article we summarize some of the ways consolidation and advances in technology may affect small business lending. We then examine the available data on small business loans over the period 1994 through 1999 to detect any changes in small business lending patterns and their possible consequences.
Although small business lending has increased since 1994, we find that the share of total lending devoted to small business loans has declined. However, the aggregate numbers conceal some important trends across organiza-tions of different sizes. We find evidence that large banks are increasing their presence in the smallest segment of the small business loan market and that the average loan size has declined, especially at larger institutions. Larger banks also appear to have narrowed the gap relative to small banks in their focus on the smallest loans. These trends are consistent with the view that new information technology, most notably credit scoring, is changing the structure of small business lending.
WHY LOOK AT BANKS’ SMALL BUSINESS LENDING? Small business lending by banks has been the subject of extensive theoretical and empiri-cal investigation. This reflects the value of small businesses to the U.S. economy and the poten-tially unique role of banks in small business lending. Small businesses (those with fewer than 500 workers) employ 53 percent of the pri-vate nonfarm workforce and are responsible for
Consolidation, Technology,
and the Changing
Structure of Banks’ Small
Business Lending
David P. Ely and Kenneth J. RobinsonL
arge banks are increasing
their presence in small
business lending, especially
in the smallest-sized loan
category, reflecting both
consolidation trends and
greater use of new
information technology.
David Ely is a professor of finance at San Diego State University. Kenneth Robinson is a senior economist and policy advisor in the Financial Industry Studies Department at the Federal Reserve Bank of Dallas.
51 percent of private gross domestic product. Small businesses are also responsible for a major portion of job creation. From 1990 through 1995, small businesses created more than three-fourths of all new jobs (U.S. Small Business Administration 1999).
Relationships
Banks fill an important niche in financing small businesses. Small firms are more likely to obtain financing from a commercial bank than from other sources, including depository and non-depository institutions (Cole and Wolken 1995). Small business lending is often viewed as idiosyncratic and relationship-based. It depends on collecting and analyzing detailed, proprietary information because public information on small firms is often lacking. Many small business loans are treated in the same manner as consumer loans because the creditworthiness of the firm’s owner — rather than the firm — is frequently a key factor in the lending decision. In contrast, ample public information is usually available about larger borrowers. The unique information requirements for small business loans may give smaller, more locally based banks an advantage in extending these types of loans (Berger and Udell 1996).
Lending relationships between banks and firms can reduce the monitoring and oversight costs associated with small business loans. Theoretical models of relationship lending can be found in Greenbaum, Kanatas, and Venezia (1989), Petersen and Rajan (1994, 1995), and Boot and Thakor (2000). These articles stress the presence of information asymmetries between borrowers and lenders and how bank-ing relationships can overcome the problems associated with providing small business credit. For an overview of issues involved in studies of relationship banking, see Boot (2000).
An extensive number of empirical investi-gations also support the view that banking relationships generate information about bank customers and yield benefits, such as lower funding costs and increased availability of credit to customers. Petersen and Rajan (1994) find that the length of the borrower relationship affects the availability of small business lending but not the price. Berger and Udell (1995) use lines of credit to isolate relationship loans and find that firms having longer relationships with banks pay lower rates. They also report that a longer relationship decreases the likelihood that the lender will require collateral to secure a loan. Cole (1998) finds that banks are more likely to lend to firms with which they have a
preexisting relationship, regardless of the length of that relationship.
One of the premises of relationship lend-ing is that larger, more complex banks might find the gathering and monitoring of informa-tion for nonstandard small business loans too expensive. To the extent that larger banks find it more costly than smaller ones to evaluate small business borrowers, larger banks would be expected to extend less small business credit than smaller banks. On the other hand, larger organizations may enjoy greater diversification and lower costs, which could serve to increase small business lending.
Consolidation and Small Business Lending Individual states began allowing out-of-state-institutions to establish operations across state lines more than twenty years ago. This process culminated with the Riegle – Neal Inter-state Banking and Branching Efficiency Act of 1994, authorizing interstate banking and branch-ing nationwide. Proponents of the legislation pointed to the efficiency and cost-saving po-tential of freeing banks from geographic re-strictions on their operations. However, as this legislation was likely to accelerate the consoli-dation trends already evident in the industry, it also raised concerns about the effects on banks’ small business lending. The number of U.S. banks peaked at over 14,400 in 1984 and cur-rently stands at roughly 8,500. In 1990, the top ten banking organizations accounted for 25.5 percent of U.S. banking assets; by 1999, they held 46.2 percent.
Several studies have looked at the effects of bank mergers and acquisitions (M&As) on small business lending. Berger et al. (1998) examine both the static and dynamic impacts of mergers and acquisitions, using more than six thousand M&As from the late 1970s to the early 1990s. The static effect is the predicted change in lending from simply combining the balance sheets of the participating banks. Using results from a model of lending activity, Berger et al. find that the small business lending predicted for the combined bank is less than that of the two (or more) pre-M&A banks. However, when dynamic effects are considered, such as changes in the consolidated institution’s lending focus or the response by other banks in the same mar-ket, they find that the static declines in small business lending are mostly offset.
Peek and Rosengren (1998a,b) present evi-dence that acquiring banks recast their targets in their own image. But, because most mergers are between two or more small banks and because
acquirers are likely to have larger small business loan portfolios than their targets, any concerns about the effects on small business lending from mergers and acquisitions may be unwarranted.
Strahan and Weston (1998) point out that smaller banks may not realize lower costs rela-tive to larger banks if size-related diversification advantages offset organizational diseconomies in business lending. Their finding that consoli-dation among small banks increases lending to small businesses while other types of mergers have little effect is consistent with important diversification effects that come with size.
Jayaratne and Wolken (1999) provide evi-dence that small banks have no cost advantage in making small business loans. These authors also find that young firms and firms with poor credit histories are as likely to have a line of credit from a large bank as a small bank. Because loans to these firms usually require closer scrutiny, this result is also consistent with no cost advantage for smaller banks to engage in small business lending.
As these studies show, fears that the ongo-ing consolidation of the U.S. bankongo-ing industry may diminish small business lending are gener-ally not supported by the evidence. Also, the possibility that larger banks find themselves at a cost disadvantage in extending small business loans is open to question. One factor that may reduce the costs of small business lending is banks’ increasing use of advances in informa-tion technology.
Technology and Small Business Lending
Banks’ growing presence online may be the industry’s most obvious embrace of the new economy (Couch and Parker 2000). But banks are also adopting recent advances in informa-tion technology and computing — particularly credit scoring models — to their small business lending decisions.
In the past, banks relied on personal credit histories and their own judgment in deciding whether to extend credit. Credit scoring uses sophisticated statistical models to evaluate potential borrowers, isolating characteristics that best predict riskiness. These models then pro-duce scores that banks can use to rank their borrowers in terms of risk. Originally used for credit card and other consumer loans, credit scoring is now making significant inroads into mortgage origination (Mester 1997).
Even more important for our purposes, an increasing number of banks are adopting credit scoring models for use in small business lend-ing. The Federal Reserve’s January 1997 Senior
Loan Officer Opinion Survey on Bank Lending Practicescontained several questions on the use of credit scoring in small business lending. Thirty-eight of the fifty-four banks responding indicated they used credit scoring models in extending small business loans. Larger banks (those with assets greater than $15 billion) were more likely to use credit scoring models than smaller banks (Federal Reserve Board 1997). To the extent that credit scoring reduces large banks’ costs of extending small business loans, it would be expected to narrow the gap between large and small banks’ emphasis on small business lending.
Levonian (1997) reports that lenders view business loans below a certain size as analogous to consumer loans, making these smaller loans attractive candidates for credit scoring models. An article in theWall Street Journal noted that over the past five years banks have turned to scoring models in their small business lending and that about 90 percent of big banks use a credit scoring model known as the Fair Isaac system (Prager 1999). A recent survey of credit scoring found that the median loan size scored in 1998 was $150,000, up from $100,000 in 1997 (American Banker1998).
When looking at mergers, Peek and Rosengren (1998b) find that the largest acquir-ing banks (those with assets greater than $1 bil-lion) show an increase in their portfolio shares of small business loans with original amounts of $100,000 or less. On the other hand, smaller-sized acquirers record decreases in their port-folio shares of loans of $100,000 or less. Peek and Rosengren argue that larger banks’ invest-ment in information technology enables them to use credit scoring models to service small busi-ness loans at lower costs.
To obtain some insights into what role consolidation and technological advances play in the small business loan market, we examine the available data on small business lending. SMALL BUSINESS LENDING:
SOME PATTERNS AND IMPLICATIONS
Banks’ Reports of Condition and Income, or call reports, contain data on small business loans based on the size of the loan, which serves as a proxy for the size of the borrower. Three categories are identified: loans with nal amounts of $100,000 or less; those with origi-nal amounts of $100,001– $250,000; and those with original amounts of $250,001– $1 million. These data are collected yearly and appear in the second quarter call reports.2
In the following sections, we investigate trends in aggregate small business lending at U.S. banks. However, because aggregate data could conceal substantial variation in lending activity and focus, we also examine lending at banks of four different asset sizes: those with assets less than $300 million; those with assets of $300 million to less than $1 billion; those with assets of $1 billion to less than $5 billion; and those with assets of $5 billion and greater. All total asset and loan values are expressed in 1999 dollars, using the consumer price index to remove the effects of inflation. We use data at the organization level because intracompany transactions among banks that are part of a multibank holding company could make bank-level comparisons misleading (Strahan and Weston 1998). For example, Demsetz (1999) presents evidence that such banks are more likely to buy and sell loans than are indepen-dent banks or banks that are part of a one-bank holding company.3
Consolidation Trends
Table 1 indicates the consolidation trends in the industry over our analysis period by revealing banks’ market shares in terms of total loans. Only the largest bank size classification recorded an increase in market share. Banks with assets of $5 billion and above accounted for 72 percent of all loans in 1994; in 1999, this share increased to 77 percent. The other size classifications recorded declines in their loan shares, especially banks with assets of less than $300 million.
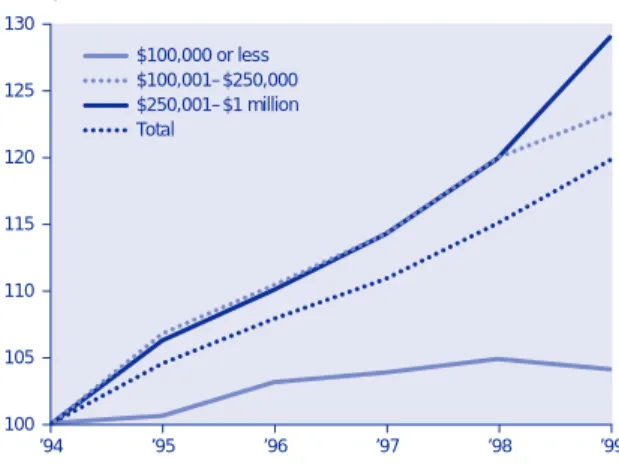
Figure 1 shows how total small business lending and the three categories of loans have increased from 1994 through 1999.4 All
cate-gories have grown, with the exception of loans of $100,000 or less, which declined slightly in
1999. These data are consistent with the avail-able evidence that consolidation of the U.S. banking industry has not led to large declines in small business lending.
The portfolio shares of the three lending categories from 1994 through 1999 for all U.S. banks are displayed in Figure 2. We measure the shares using both total assets and total loans as the base. The overall asset share of small busi-ness lending has held steady at U.S. banks at close to 8 percent. However, when using total loans as the base, portfolio shares drop from 13 percent in 1994 to 11.9 percent in 1999, reflect-ing differences between small business loan growth and total loan growth at U.S. banks. While total small business lending has increased 20 percent since 1994 (in inflation-adjusted terms), it has not kept pace with overall loan growth, which increased 31 percent between 1994 and 1999.
Table 1
Banks’ Market Share by Bank Size, 1994 – 99
(Percent of total loans)
Asset size 1994 1995 1996 1997 1998 1999
Less than $300 million 12 11 11 11 10 9
$300 million to less than $1 billion 7 6 6 7 7 6
$1 billion to less than $5 billion 9 8 8 8 8 7
$5 billion and greater 72 74 75 75 76 77
NOTE: Assets in 1999 dollars.
SOURCE: Report of Condition and Income.
Figure 1
Small Business Lending, 1994 – 99
Index, 1994 = 100 100 105 110 115 120 125 130 ’99 ’98 ’97 ’96 ’95 ’94 Total $250,001–$1 million $100,001–$250,000 $100,000 or less
Figure 3 highlights two general trends in small business lending over 1994 – 99 for the four bank size groups. The first trend is the growing presence of the largest banks in the small business loan market. While the value of loans controlled by the smallest-sized banks fell from $95 billion to $92.3 billion, the holdings of banks with $5 billion or more in assets increased from $158.2 billion to $204.3 billion. The middle-sized banks also show modest gains in holdings of small business loans.
The second trend of note in Figure 3 is the shifting focus of small business loans. For the smallest banks, the value of loans of $100,000 or less decreased from $48.7 billion in 1994 to $39.8 billion in 1999, but loans greater than $100,000 increased. For the middle-sized banks, business loans of less than $100,000 increased between 1994 and 1999 but less so than the loans in the ranges of $100,001– $250,000 and $250,001– $1 million. The largest banks’ hold-ings of loans of $100,000 or less expanded
grad-Figure 2
Small Business Lending Portfolio Shares in Percent of Assets and Loans, 1994 – 99
0 2 4 6 8 10 12 14 ’99 ’98 ’97 ’96 ’95 ’94 Assets 0 2 4 6 8 10 12 14 ’99 ’98 ’97 ’96 ’95 ’94 Loans $250,001–$1 milllion $100,001–$250,000 $100,000 or less Percent Percent
SOURCE: Report of Condition and Income.
Figure 3
Small Business Loans Outstanding by Bank Size, 1994 – 99
Billions of 1999 dollars 0 25 50 75 100 125 150 175 200 225 ’99 ’98 ’97 ’96 ’95 ’94 ’99 ’98 ’97 ’96 ’95 ’94 ’99 ’98 ’97 ’96 ’95 ’94 ’99 ’98 ’97 ’96 ’95 ’94 $250,001–$1 milllion $100,001–$250,000 $100,000 or less
< $300 million $300 million–<$1 billion $1 billion–<$5 billion $5 billion +
ually from $35.4 billion in 1994 to $47.2 billion in 1999. While these trends largely reflect U.S. banking industry consolidation, a more detailed examination of changes in lending shares also provides evidence that technology is changing the structure of small business lending.
TECHNOLOGY’S ROLE Lending Focus
Table 2 presents details on banks’ share of total loans devoted to small businesses for 1994 – 99. We calculate the aggregate shares for each bank size classification as a group and for all banks combined. We focus on loan shares rather than asset shares to account for cyclical effects on lending. That is, during an upswing in
the business cycle, lending would tend to increase. This cyclical effect could cause various loan-to-asset ratios to rise independent of any change in banks’ lending focus.
Our emphasis is on the smallest loans — those with outstanding amounts of $100,000 or less — because they should show the most noticeable effects of credit scoring, given their similarity to consumer loans.
As shown in the table, for all banks com-bined, the aggregate ratio of loans of $100,000 or less to total loans has declined more than 20 percent since 1994. A downward trend is also evident for the various bank size categories, especially the smallest. Banks with less than $300 million in assets recorded an aggregate loan share of nearly 15.2 percent in 1994 but
Table 2
Banks’ Ratio of Small Business Loans to Total Loans, 1994 – 99
Loan share (percent) Bank asset size $300 million $1 billion
Less than to less than to less than $5 billion Loan size All banks $300 million $1 billion $5 billion and greater $100,000 or less 1994 4.23 15.17 7.59 5.23 1.90 1995 3.91 14.57 7.55 4.69 1.85 1996 3.81 14.13 7.66 4.63 1.88 1997 3.69 13.71 7.40 4.75 1.82 1998 3.54 13.42 7.19 4.59 1.82 1999 3.36 12.72 6.78 4.68 1.81 Change 1994 – 99 – 20.57 –16.15 –10.67 –10.52 – 4.73 $100,001 to $250,000 1994 2.59 5.23 5.12 3.59 1.78 1995 2.54 5.36 5.35 3.58 1.75 1996 2.50 5.51 5.31 3.70 1.69 1997 2.49 5.47 5.36 3.81 1.66 1998 2.48 5.55 5.46 4.10 1.65 1999 2.44 5.64 5.56 4.31 1.60 Change 1994 – 99 – 5.80 7.84 8.59 20.05 – 10.11 $250,001 to $1 million 1994 6.21 9.13 11.97 9.03 4.82 1995 6.06 9.71 12.06 8.96 4.65 1996 5.97 9.94 12.19 9.19 4.52 1997 5.96 10.07 12.48 9.06 4.46 1998 5.94 10.40 12.53 9.85 4.37 1999 6.10 11.15 13.22 10.80 4.43 Change 1994 – 99 – 1.77 22.12 10.44 19.60 – 8.09
All small business loans
1994 13.03 29.52 24.68 17.85 8.50 1995 12.51 29.64 24.96 17.23 8.26 1996 12.28 29.58 25.17 17.52 8.09 1997 12.14 29.24 25.24 17.62 7.94 1998 11.96 29.37 25.18 18.54 7.84 1999 11.89 29.51 25.55 19.79 7.85 Change 1994 – 99 – 8.75 –.03 3.52 10.87 – 7.65
NOTE: Assets in 1999 dollars.
12.7 percent by 1999. The declines in loan shares at banks with assets greater than $300 million were substantially less.
These results show the industry has reduced its lending focus on the smallest small business loans. This pattern could reflect less lending demand or less supply or a combination of both. As is clear from Table 2, though, the largest banks have reduced their emphasis on this loan category by a smaller amount than other organizations, which is consistent with the large banks’ adoption of credit scoring for small business loans. The cost reductions made possi-ble by credit scoring may have partially offset the forces otherwise causing the industry to cut back on the smallest loans.
The aggregate shares of loans of $100,001 through $1 million declined slightly for the entire set of banks. However, these loan shares tended to increase for all but the largest banks, indicating that the largest organizations’ empha-sis on the larger loan categories has not kept pace with other banks.
Finally, Table 2 shows that total small busi-ness lending, as a percent of total loans, declined for all banks as a group. However, the lend-ing shares varied little at the smallest banks, increased a bit at the intermediate-sized institu-tions, and declined steadily at the largest banks. These trends in lending share suggest larger banks are changing their small business lending focus relative to the smaller banks. While the smallest loans declined in importance
for all organizations, this decline was substan-tially less at large banks. At the same time, the smaller banks increased their emphasis on the larger loans, while large banks decreased their focus on these loans. Consequently, the gap in lending emphasis between large and small banks in the smallest loan category has nar-rowed, consistent with credit scoring models becoming more important. An examination of trends in the average size of small business loans can also help ascertain the growing rele-vance of credit scoring.
Average Loan Size
Because inflation would likely push loans above the $100,000 cutoff, we would expect the share of the $100,000 or less category to fall over time, as it has, especially at the smaller banks. One explanation for a more moderate decline in this category at larger banks is that the adoption of credit scoring models has offset this inflation effect.
To explore further the possible impact of such technology, we examine patterns of aver-age loan size over time. Because the costs of offering smaller loans would tend to fall when credit scoring is employed, the average small business loan size should also fall. We calculate the average loan size for small business loans of $100,000 or less and for total small business loans. These results appear in Table 3. The dol-lar value of small business loans was divided by the number of loans outstanding to
calcu-Table 3
Banks’ Average Small Business Loan Size by Bank Asset Size, 1994 – 99
(Thousands of dollars)
Loan size 1994 1995 1996 1997 1998 1999 p -value
Banks with assets less than $300 million
$100,000 or less 31.1 30.1 29.5 29.6 30.0 29.8 .000
Total small business loans 53.1 53.0 53.2 53.8 55.6 57.9 .000
Banks with assets $300 million to less than $1 billion
$100,000 or less 33.1 31.4 31.0 30.8 30.0 29.2 .000
Total small business loans 108.9 98.8 95.9 96.8 97.4 97.7 .007
Banks with assets $1 billion to less than $5 billion
$100,000 or less 34.9 32.7 31.3 29.7 29.9 28.3 .000
Total small business loans 126.9 127.9 123.6 112.9 115.5 110.3 .192
Banks with assets $5 billion and greater
$100,000 or less 30.5 29.3 28.3 26.2 26.0 25.4 .033
Total small business loans 115.0 112.0 104.1 98.7 99.2 104.5 .593
NOTE: Assets in 1999 dollars.
late average loan amounts for each bank. These amounts were then averaged across organi-zations. The p-values are significance levels for
F-statistics that test for differences in means over time.5
The average loan size decreases for loans of $100,000 or less for all size groups. For banks with assets less than $300 million, the average loan of $100,000 or less fell from $31,132 in 1994 to $29,840 in 1999, while the average loan amount of all small business loans increased from $53,092 to $57,917.
The decreases in the average loan amounts in the $100,000-and-under category are more substantial for organizations with over $1 billion in assets. For organizations with assets of $1 billion to less than $5 billion, the average loan amount dropped from $34,883 in 1994 to $28,331 in 1999. For organizations with over $5 billion in assets, the average loan amount dropped from $30,461 in 1994 to $25,421 in 1999. While we have not offered a direct test on the use of credit scoring models to lending activity, the declines in the average loan amounts, especially at larger banks, are
consis-tent with anecdotal evidence on the growing use of such technology.
CONSOLIDATION AND TECHNOLOGY: TRENDS IN MARKET SHARE
An increase in the overall presence of larger banks in small business lending would be expected from the combined effects of consoli-dation and the greater use of credit scoring models. And calculations of the market shares of small business loans indicate substantial shifts in shares, especially between large and small banks and particularly in the smallest lending category. Table 4 contains the market shares of the three categories of small business lending, classified by bank size, for 1994 – 99. The market shares of small business loans for the two inter-mediate-sized groups — banks with assets of $300 million to less than $1 billion and those with assets of $1 billion to less than $5 billion — have remained constant. The biggest shifts in market share have occurred at the largest and smallest banks and in the smallest loan cate-gory. In 1994, 45 percent of small business loans
Table 4
Banks’ Market Shares of Small Business Loans Outstanding by Asset Size, 1994 – 99
(Percent)
Percent of total small business loan category
Loan size 1994 1995 1996 1997 1998 1999
Banks with assets less than $300 million
$100,000 or less 45 43 41 40 38 35
$100,001– $250,000 25 24 24 23 22 21
$250,001– $1 million 18 18 18 18 17 17
Total small business loans 28 27 26 26 24 23
Banks with assets $300 million to less than $1 billion
$100,000 or less 12 12 13 13 12 12
$100,001– $250,000 13 13 13 14 14 15
$250,001– $1 million 13 13 13 14 14 14
Total small business loans 13 13 13 14 14 13
Banks with assets $1 billion to less than $5 billion
$100,000 or less 11 10 10 10 10 11
$100,001– $250,000 12 12 12 12 13 13
$250,001– $1 million 13 12 12 12 13 13
Total small business loans 12 11 11 12 12 12
Banks with assets $5 billion and greater
$100,000 or less 32 35 37 37 39 41
$100,001– $250,000 49 51 51 50 50 51
$250,001– $1 million 56 57 57 56 56 56
Total small business loans 47 49 49 49 50 51
NOTE: Assets in 1999 dollars. Shares might not total 100 due to rounding. SOURCE: Report of Condition and Income.
of $100,000 or less were held by banks with assets less than $300 million, and 32 percent were held by banks with assets of $5 billion and above. In 1999, the proportion of these loans held by the smallest banks had fallen to 35 per-cent while the proportion held by the largest banks had increased to 41 percent.6
These data on market shares are consis-tent with both a more consolidated banking industry and a greater role for technology in lending. The industry is becoming more con-centrated, with the largest banks controlling a greater portion of loans, including small busi-ness loans. Consequently, small busibusi-nesses have become more dependent on large banking organizations. And the sharp increase in the largest banks’ market share of loans with out-standing amounts of $100,000 or less could indi-cate a greater role for credit scoring technology in small business lending.
CONCLUSIONS
Consolidation and technological change have characterized the U.S. banking industry recently. Each of these has important implica-tions for small business lending, which has grown steadily since 1994. Large banks’ market share of small business lending has increased at the expense of smaller banks. The largest banks are making the greatest inroads with the smallest loans, and the gap in lending focus between large and small banks has narrowed in this area. Moreover, the average small business loan has declined in size. These results are con-sistent with advances in technology playing a larger role in small business lending. However, given the variety of regulatory and market forces that could also affect small business lending, we cannot be sure that advances in technology are the driving force behind the changes we have observed. Beyond consoli-dation, though, the role of technology is well worth considering when trying to understand changes in banks’ lending to small businesses. NOTES
The authors would like to thank Jeff Gunther and Bob Moore for helpful comments and suggestions. 1 See Moore (1995) for evidence that the industry was
consolidating before passage of interstate branching legislation. All data used in this paper are expressed at the organization level, but for simplicity, we use the terms bank and banking organization interchangeably. 2 Because the data are based on the size of the loan
rather than the size of the business, they are not a
perfect indicator of small business lending by banks. Also, the data are only for loans secured by nonfarm, nonresidential property and commercial and industrial loans, while bank credit to small businesses can take other forms, such as personal lines of credit and home equity loans. Throughout our analysis, we exclude any bank that did not report total loans for the year in question. Also, we exclude banks under five years of age because younger banks may exhibit unusual patterns in small business lending. See Goldberg and White (1998) and DeYoung, Goldberg, and White (1999). 3 Our conclusions are unchanged, however, if we use
bank-level data.
4 Data on small business lending are available begin-ning in 1993. However, the 1993 data were found to contain errors. See Berger and Udell (1996, 576 – 77, footnote 6), and Peek and Rosengren (1998a, 802, footnote 3). Although revisions were made to these data, we begin our analysis in 1994 to avoid any possible data inconsistencies.
5 These tests are based on ANOVA methods to detect any statistically significant differences in the means in at least one year.
6 An alternative way to measure lending to small busi-nesses is to examine market shares based on the number of loans outstanding rather than aggregate dollar amounts. This approach will provide additional insights if the average loan size is changing over time. When we measure market share based on the number of loans, the most notable changes in market share occur, once again, in the smallest lending category at both the largest and smallest institutions. In 1994, the smallest and largest banks both held 40 percent of the number of loans with original amounts of $100,000 or less. In 1999, the smallest banks held only 19 percent of these loans, while the largest held 55 percent.
REFERENCES
American Banker(1998), “Small Business Lending: Securitization Likely Next Step for Banks in the Market,” February 6, 37.
Berger, Allen N., and Gregory F. Udell (1995),
“Relationship Lending and Lines of Credit in Small Firm Finance,” The Journal of Business68 (July): 351– 81. ——— (1996), “Universal Banking and the Future of Small Business Lending,” in Universal Banking: Financial System Design Reconsidered, ed. Anthony Saunders and Ingo Walter (Chicago: Irwin Professional Publishing), 558 – 627.
Berger, Allen N., Anthony Saunders, Joseph M. Saclise, and Gregory F. Udell (1998), “The Effects of Bank Mergers and Acquisitions on Small Business Lending,”
Boot, Arnoud W. A. (2000), “Relationship Banking: What Do We Know?” Journal of Financial Intermediation
9 (January): 7– 25.
Boot, Arnoud W. A., and Anjan V. Thakor (2000), “Can Relationship Banking Survive Competition?” The Journal of Finance55 (April): 679 – 713.
Cole, Rebel A. (1998), “The Importance of Relationships to the Availability of Credit,” Journal of Banking and Finance22 (August): 959 – 77.
Cole, Rebel A., and John D. Wolken (1995), “Financial Services Used by Small Businesses: Evidence from the 1993 National Survey of Small Business Finances,”
Federal Reserve Bulletin81, no. 7 (July): 629 – 67. Couch, Karen, and Donna L. Parker (2000), “ ‘Net Interest’ Grows as Banks Rush Online,” Federal Reserve Bank of Dallas Southwest Economy, Issue 2, March/April, 1– 5. Demsetz, Rebecca S. (1999), “Bank Loan Sales: A New Look at the Motivations for Secondary Market Activity,” Federal Reserve Bank of New York, Staff Reports, no. 69 (March).
DeYoung, Robert, Lawrence G. Goldberg, and Lawrence J. White (1999), “Youth, Adolescence, and Maturity of Banks: Credit Availability to Small Business in an Era of Banking Consolidation,” Journal of Banking and Finance
23 (February): 463 – 92.
Federal Reserve Board (1997), Senior Loan Officer Opinion Survey on Bank Lending Practices(January), http://www.federalreserve.gov/boarddocs/SnLoanSurvey/ 199701/default.htm.
Goldberg, Lawrence G., and Lawrence J. White (1998), “De Novo Banks and Lending to Small Businesses: An Empirical Analysis,” Journal of Banking and Finance
22 (August): 851– 67.
Greenbaum, Stuart I., George Kanatas, and Itzhak Venezia (1989), “Equilibrium Loan Pricing Under the Bank– Client Relationship,” Journal of Banking and Finance13 (May): 221– 35.
Jayaratne, Jith, and John Wolken (1999), “How Important Are Small Banks to Small Business Lending? New Evidence from a Survey of Small Firms,” Journal of Banking and Finance23 (February): 427– 58. Levonian, Mark E. (1997), “Changes in Small Business Lending in the West,” Federal Reserve Bank of San Francisco Economic Letter, January 24.
Mester, Loretta J. (1997), “What’s the Point of Credit Scoring?” Federal Reserve Bank of Philadelphia
Business Review, September/October, 3 –16.
Moore, Robert R. (1995), “Does Geographic Liberaliza-tion Really Hurt Small Banks?” Federal Reserve Bank of Dallas Financial Industry Studies, December, 1–12. Peek, Joe, and Eric S. Rosengren (1998a), “Bank Consolidation and Small Business Lending: It’s Not Just Bank Size That Matters,” Journal of Banking and Finance
22 (August), 799 – 819.
——— (1998b), “The Evolution of Bank Lending to Small Business,” Federal Reserve Bank of Boston New England Economic Review, March/April, 27– 36.
Petersen, Mitchell A., and Raghuram G. Rajan (1994), “The Benefits of Lending Relationships: Evidence from Small Business Data,” The Journal of Finance49 (March): 3 – 37.
——— (1995), “The Effect of Credit Market Competition on Lending Relationships,” The Quarterly Journal of Economics110 (May): 407– 43.
Prager, Joshua Harris (1999), “More Small Firms Get a Break from Banks,” Wall Street Journal, June 28, A2. Strahan, Philip E., and James P. Weston (1998), “Small Business Lending and the Changing Structure of the Banking Industry,” Journal of Banking and Finance22 (August): 821– 45.
U.S. Small Business Administration (1999), “The Facts About Small Business 1999,” U.S. Small Business Administration Office of Advocacy.